

Abstract
The inducible zinc finger transcription factors EGR1, EGR2, and EGR3 regulate the expression of numerous genes involved in differentiation, growth, and response to extracellular signals. Their activity is modulated in part through NAB2 which is induced by the same stimuli. In melanoma and carcinoma cells EGR1 activates NAB2 expression. In T lymphocytes EGR2 and EGR3 have been shown to inhibit NAB2 expression. Therefore, we investigated the influence of EGR2 and EGR3 on NAB2 expression in melanoma and carcinoma cells. Here we show that like EGR1, EGR2 and EGR3 induce NAB2 expression in these cells. EGR1 and EGR3 act in concert on the NAB2 promoter and are more potent activators of NAB2 transcription than EGR2. EGR1-, EGR2-, and EGR3-induced NAB2 promoter activity is mediated through similar cis-regulatory elements and the activation by each EGR is repressed by NAB2. Kinetic studies suggest that induction of EGR1 leads to low NAB2 expression while EGR2 and EGR3 are necessary for maximal and sustained expression. As aleady shown for EGR1, reduction of EGR2 or EGR3 expression by siRNAs reduced endogenous NAB2 levels. Depletion of EGR3 also resulted in a reduction of EGR2 levels confirming EGR2 as a target gene of EGR3. Our results suggest that in many cells of neuroectodermal and epithelial origin EGR1, EGR2, and EGR3 activate NAB2 transcription which is in turn is repressed by NAB2, thus establishing a negative feedback loop. This points to a complex relationship between the EGR factors and NAB2 expression likely depending on the cellular context.
Keywords: NAB2, early growth response, EGR, transcription factor, negative feedback loop, autoregulation, promoter
The zinc finger transcription factors of the early growth response family (EGR3) are immediate early response genes that are important for the induction of cellular programs of differentiation, proliferation, and cell death in response to environmental stimuli (Carter et al., 2007; Thiel et al., 2002; Unoki et al., 2003). The most prominent members of the EGR family are EGR1, EGR2, and EGR3, which share consensus DNA binding sequences. While the expression of the EGR family members is low or undetectable in resting cells, it is rapidly and transiently induced by a wide variety of extracellular signals such as cytokines, growth factors, T cell receptor (TCR) activation, and toxic substances (Beckmann et al., 1997; Collins et al., 2006; Collins et al., 2008; Honkaniemi et al., 2000; Skerka et al., 1997). Target genes include growth factors such as vascular endothelial growth factor (VEGF) and platelet-derived growth factor (PDGF) (Khachigian et al., 1995; Liu et al., 2003), as well as genes involved in the differentiation of hematopoietic cells (Collins et al., 2008; Laslo et al., 2006) and in neuronal development (Mager et al., 2008; Nagarajan et al., 2001). The activity of the EGR transcription factors is controlled in part through the members of the NGFI-A binding protein (NAB) family, namely NAB1 and NAB2, which modulate the activity of the EGR family members by binding to them (Russo et al., 1995; Sevetson et al., 2000; Svaren et al., 1996; Svaren et al., 1998). Nab proteins were first identified as Egr1 binding proteins in a two hybrid assay (Russo et al., 1995; Svaren et al., 1996). NAB2, which is also known as melanoma associated delayed early response gene (MADER), was independently identified as a nuclear protein overexpressed in human malignant melanoma (Kirsch et al., 1996). NAB2 can inhibit EGR1, EGR2, and EGR3, whereas NAB1 is able to modulate the activity of only EGR1 and EGR2. Furthermore, NAB1 is constitutively expressed in most cell types, while NAB2 is a delayed early response gene and is induced by the same environmental signals that lead to EGR expression. This implies that NAB2 is the more important regulator of the EGR family, crucial for controlling the EGR-mediated activation of transcription.
Although Nab2 was originally defined as a corepressor of the EGR transcription factors (Svaren et al., 1996), recent studies showed that NAB2 can act also as a coactivator of EGR-mediated gene transcription (Collins et al., 2006; Sevetson et al., 2000). In addition, the influence of the EGR members on NAB2 expression and whether they are coactivated or corepressed by NAB2 seems to be highly dependent on the cellular context. During the determination of hematopoietic cell fates EGR1 and EGR2 functions are redundant in promoting macrophage differentiation by limiting growth factor independent 1 (Gfi-1) transcription repressor function (Laslo et al., 2006). Neither EGR2 or NAB2 alone influence Gfi-1 expression, but together they repress the Gfi-1 gene, resulting in the inhibition of the neutrophil program. TCR-induced NAB2 and EGR1 act together to activate the interleukin-2 promoter leading to T cell activation (Collins et al., 2006). However, TCR-induced EGR2 and EGR3 inhibit T cell activation by repressing the expression of NAB2 and EGR1 (Collins et al., 2008).
Recently, EGR1 was shown to be a major positive regulator of the transcription of its own repressor NAB2 in melanoma and carcinoma cells (Kumbrink et al., 2005). The EGR1-mediated activation of NAB2 transcription was repressed by NAB2, indicating the existence of an EGR1/NAB2 negative feedback mechanism. Electromobility shift assays (EMSAs) pointed to the participation of other members of the EGR family in the regulation of NAB2 expression. In the studies presented here we show that in tumor cells of neuroectodermal and epithelial origin EGR1, EGR2, and EGR3 act as positive regulators of NAB2 gene expression. As shown previously for EGR1 reduction of either EGR2 or EGR3 by short-interfering (si) RNAs reduced NAB2 expression. Expression kinetics in response to phorbol esters suggest that EGR2 and EGR3 are necessary for the maximum induction and maintenance of NAB2 expression. The EGR-mediated activation of NAB2 transcription was repressed by NAB2, further supporting the existence of an EGR/NAB2 negative feedback mechanism in cells of neuroectodermal and epithelial origin which prevents continual NAB2-mediated modulation of EGR target genes in response to extracellular signals.
MATERIAL & METHODS
Cell Lines and culture conditions
Cell lines were obtained from the ATCC (Manassas, VA), established in our laboratory, or obtained through exchange. Cell lines were cultured in RPMI 1640 Medium (Biochrom AG, Berlin, Germany) supplemented with 5% FCS, 1 mM sodium pyruvate, 2 mM L-glutamine, 100 U/ml penicillin and 100 U/ml streptomycin at 37°C and 5% CO2. Cell lines used were, human melanoma: Mel 888, Mel Ei, Mel Juso, and SK-MEL-23; human colon carcinoma: Colo 320DM and LoVo; human breast carcinoma: MCF-7. Cells were seeded 16 hours prior to stimulation by the addition of phorbol myristate acetate (PMA, final concentration 10 ng/ml) obtained from Sigma-Aldrich (St. Louis, MO, USA) for indicated times. All cells were routinely tested for mycoplasma contamination.
Generation of expression constructs
The generation of the expression constructs for human EGR1, NAB1, NAB2, and pleckstrin homology-like domain A-1 (PHLDA1) was described previously (Kumbrink et al., 2005; Neef et al., 2002). Dominant negative (dn)NAB2 was generated by a single nucleotide exchange resulting in amino acid change E51K using the QuikChange™ XL site-directed mutagenesis kit (Stratagene, La Jolla, CA, USA). Wild type NAB2 served as template and primers were: 5′-GGGTGAGGAGGAGTTTCTGAAGAT-3′ (forward) and 5′-GTGCCATGATCTTCAGAAACTCCTCCT-3′ (reverse).
IMAGE Clone 6177872, containing full length human EGR2 cDNA, was purchased from MRC geneservice (Cambridge, UK) and subcloned into EcoR I/Not I-digested pcDNA3.
Human EGR3 cDNA was obtained by reverse transcription, as described under RT-PCR, of total RNA prepared from Mel888 cells stimulated for 2 hours with PMA using the EGR3-specific primer 5′-CCTCAGGCGCAGGTGGTGAC-3′. The obtained EGR3 cDNA was amplified by PCR using Pfu Turbo Polymerase (Stratagene) with the forward primer, including BamH I-site, 5′-ATA GGATCC CCCCTGCACCACGGATCGCC-3′ and the reverse primer, including EcoR I-site, 5′-ATA GAATTC CCTCAGGCGCAGGTGGTGAC-3′ and subcloned into the EcoR I/BamH I-digested pcDNA3-vector.
Isolation and characterization of the NAB2 genomic sequence and the production of NAB2 5′ region deletion reporter constructs were described previously (Kumbrink et al., 2005). Inserts of all constructs were validated by sequencing.
Jetstar 2.0 plasmid kit (Genomed, Lohne, Germany) was used for DNA preparation.
In silico analysis
In silico analysis was conducted using the Genomatix suite of programs (Cartharius et al., 2005; Quandt et al., 1995).
Determination of transfection efficiency
Cells were seeded at 3 × 10⁵ cells/well (in 6-well plates) and incubated for 24 hours before transfection with 2 μg of the enhanced green fluorescent protein (EGFP) expression vector pEGFP-N1 (Clontech, USA) using MATra-A reagent (IBA, Goettingen, Germany) according to the manufacturer’s recommendations. After 48 hours cells were analyzed by flow cytometry (FACscan, Bectin Dickinson) and Cell Quest software.
Transfections and Luciferase Assays
Cells were seeded at 1 × 10⁴ cells/well (in 96-well plates) and cultured for 48 hours prior to transfection. For each transfection 2–60 ng of empty and/or expression vector along with 60 or 100 ng of NAB2 promoter luciferase construct were transfected using MATra-A reagent (IBA, Goettingen, Germany) according to the manufacturer’s recommendations. Forty-eight hours post transfection, or as indicated, cells were lysed with cell culture lysis reagent (CCLR, Promega, WI, USA) at RT for 30 min on a shaker. Luciferase activity of all extracts was measured using the firefly luciferase assay system (Promega) and normalized to protein concentration using Bio-Rad protein assay (Bio-Rad, Hercules, CA, USA). Each experiment was performed in triplicate samples at least twice using different DNA preparations of each construct. In some cases, as indicated cells were seeded at 3 × 10⁵ cells/well (in 6-well plates) and incubated for 24 hours before transfection with 2 μg of the indicated vectors.
siRNA transfections
SK-MEL-23 cells were transfected with 30 nM siRNA using siPORT NeoFX (Ambion, Austin, Texas, USA) according to the manufacturer’s recommendations in 12-well plates and incubated for 24 hours. SiRNAs directed against EGR2 (ID # 115177), EGR3 (ID # 115514), and negative controls (Cat. # 4615 and # 4642) were purchased from Ambion. Sequences of siRNAs specific for EGR2 and EGR3, which are not specific for RNAs of other members of the EGR family were: EGR2, 5′-CGCAAAACCACUAACUGAAtt-3′; EGR3, 5′-CCAACACAACAGAUAGAAUtt –3′.
RT-PCR
Cells were washed twice with phosphate buffered saline (PBS) and lysed on ice. RNA was extracted using RNAeasy kit from Qiagen (Hilden, Germany). One μg of total RNA was reverse transcribed using RevertAid First Strand cDNA Synthesis Kit (Fermentas, Lithuania) according to the manufacturer’s recommendations. The PCR primers, which were designed to amplify cDNA and not genomic DNA, were: human EGR2, 5′-CAACATCTACCCGGTGGAGGAC-3′ (forward) and 5′-GATGCCTGCACTCACAATATTG-3′ (reverse), human EGR3, 5′-CCAGCGCGCTCAACCTCTTC-3′ (forward) and 5′-GTAGAGGTCGCCGCAGTTGGAG-3′ (reverse). Primers for EGR1, NAB2, and glyceraldehyde-3-phosphate dehydrogenase (GAPDH) were described previously (Kumbrink et al., 2005). To check for linear amplification each PCR reaction was performed with 2 μl and 1 μl of undiluted cDNA and serial dilutions of 1:10, 1:100, and 1:1000. Linear amplification for the majority of the PCR reactions was achieved with 1 μl of 1:10 diluted cDNA. Due to the low expression levels of EGR2 and EGR3 in some cell lines these PCR reactions were performed with undiluted cDNA as template. Linear amplification of GAPDH with undiluted cDNA (Fig. 2C) was obtained with a 24 cycle PCR reaction. PCR was performed using 1 μl of 1:10 diluted or undiluted cDNA in a 20 μl 30 cycle PCR reaction with the use of Taq polymerase and buffer Y from Peqlab (Erlangen, Germany). Products were separated by electrophoresis through a 1 % agarose gel. To control for the integrity and uniformity of the sample preparations, GAPDH mRNA was amplified. Densitometric analysis was performed using SigmaGel software (SPSS science).
Real time PCR
Real time PCR was performed utilizing ABI PRISM™ 7000 Sequence Detection System (SDS) Version 1.2.3 (9600 Emulation), TaqMan® Gene Expression Assays, and 2x TaqMan® Universal PCR Master Mix as recommended by the manufacturer Applied Biosystems (Foster City, CA, USA) using 25 ng of cDNA in a 25 μl approach. Comparative Ct method was applied for relative quantitation of each gene expression between samples (Livak et al., 2001) and normalized to glucose-6-phosphate-dehydrogenase (G6PD) levels. TaqMan® Gene Expression Assays used were: EGR1, Hs00152928_m1; EGR2, Hs00166165_m1; EGR3, Hs00231780_m1, NAB2, Hs01082003_m1; G6PD, Hs00166169_m1. PCR specificity and amplicon size was validated by electrophoresis through a 2 % agarose gel.
RESULTS
Regulation of NAB2 by EGR1, EGR2, and EGR3 in carcinoma and melanoma cells
A previous study showing that EGR1 is an important positive regulator of NAB2 expression in colon carcinoma and melanoma cells pointed to the involvement of additional members of the EGR family in NAB2 regulation (Kumbrink et al., 2005). A comprehensive in silico analysis of the NAB2 5′ region revealed that the NAB2 promoter, located from bp −674 to −74 relative to the translation start site (Kumbrink et al., 2005), contains eleven putative EGR1, two EGR2, and two EGR3 sites, most of which overlap with SP1/SP2 sites (Fig. 1). In addition, five sites for cAMP-responsive elements binding proteins (CREB), two ETS family and AP2 sites were identified in the NAB2 promoter. Of note is a cluster of multiple overlapping binding sites between bp −329 to −260 including five Sp1, five EGR1 motifs, and a single EGR3 and AP2 site, which was shown to be the major regulatory element involved in basal NAB2 promoter activity as well as EGR1-mediated and phorbol ester induced NAB2 promoter activation (Kumbrink et al., 2005). Comparative in silico analysis of the NAB2 5′ region of Macaca mulatta, Bos taurus, Rattus norvegicus, and Mus musculus demonstrated a high evolutionary conservation of most of the EGR and SP1 sites including this cluster further pointing to its importance (data not shown).
Fig. 1.
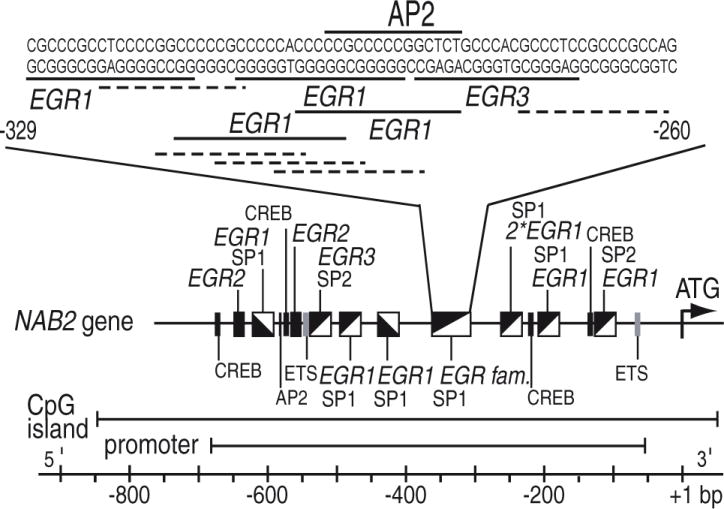
Schematic representation of the NAB2 5′ region. Numbering is in relation to translation start site (+1). Identified promoter region, CpG island, and putative transcription factor binding sites are indicated. EGR family member sites are highlighted in italics. The detailed sequence of the major regulatory element in the NAB2 promoter between bp −329 and −260 including putative binding motifs (dotted line = SP1 binding site, solid line = EGR family member site) is displayed.
In order to investigate the role of the EGR family members in the regulation of NAB2 expression the colon carcinoma cell line Colo 320DM, which expresses nearly undetectable levels of the EGR molecules (Fig. 2B), was transfected with expression constructs for human EGR1, EGR2, EGR3, or PHLDA1 (which does not influence NAB2 promoter activity (Kumbrink et al., 2005)) and empty vector (ev) as controls. The effect on the endogenous NAB2 expression was examined after 48 h by RT-PCR. As seen in Fig. 2A transfection of either EGR1, EGR2, or EGR3 led to enhanced NAB2 mRNA expression in comparison to controls. This suggests that, in addtion to EGR1, also EGR2 and EGR3 participate in the positive regulation of NAB2 transcription.
Fig. 2.

A. EGR1, EGR2, and EGR3 induce endogenous NAB2 expression. Colo 320DM cells were transfected in 6-well plates with 2 μg of expression constructs for human EGR1, EGR2, EGR3, or PHLDA1 and empty vector (ev) as controls. Levels of NAB2, and GAPDH mRNA were determined by RT-PCR after 48 h as described in “Experimental Procedures”. –DNA, control for PCR. B. Autoregulation of EGR family members. Colo 320DM cells were transfected in 6-well plates with 2 μg of expression constructs for human EGR1, EGR2, EGR3, or PHLDA1 as control. Levels of EGR1, EGR2, EGR3, and GAPDH mRNA were determined by RT-PCR after 48 h as described in “Experimental Procedures”. –DNA, control for PCR. C. Inhibition of endogenous NAB2 activity enhances EGR1, EGR2, and EGR3 expression. MCF-7 cells were transfected in 6-well plates with 2 μg of expression constructs for human wild type wtNAB2, dominant negative dnNAB2, or empty vector (ev) as control. Left panel, levels of EGR1, EGR2, EGR3, NAB2, and GAPDH mRNA were determined by RT-PCR after 48 h as described in “Experimental Procedures”. –DNA, control for PCR. Undiluted (undil) or 1:10 diluted cDNA was used as PCR template as indicated. Right panel, densitometric analysis of EGR1, EGR2, and EGR3 mRNA expression after transfection of the indicated construct (as described in “Experimental Procedures”). Results are presented as fold expression in relation to cells transfected with empty vector (ev) control. * P <0.05, n.s., not significant (ev control versus wtNAB2 or dnNAB2). P values were calculated using Student’s t-test. A, B, and C. Results shown are from one representative experiment out of three performed.
Although ectopic expression of EGR2 and EGR3 had no effect on EGR1 levels, transfection of EGR1 led to a slight increase in EGR2 and a stronger induction of EGR3 (Fig. 2B). No influence on EGR3 expression was observed after transfection of EGR2, whereas ectopic expression of EGR3 resulted in enhanced EGR2 levels. These results suggest that EGR1 is a positive regulator of EGR2 and EGR3 transcription and that EGR2 might be a target gene of EGR3.
Consistent with this are results obtained using a dominant negative (dn) NAB2. dnNAB2, containing an E51K amino acid exchange in the EGR binding domain, integrates into wild type (wt) NAB2 protein complexes thereby inactivating the whole complex and leading to increased EGR activity (Svaren et al., 1998). Since the expression of all three EGR family members is low or undetectable in Colo 320DM cells MCF-7 breast carcinoma cells, which express high EGR1, moderate NAB2, and low EGR2, and EGR3 levels (Fig. 2C), were transfected with wtNAB2, dnNAB2, or empty vector control. The effects on endogenous EGR1, EGR2, EGR3, and NAB2 expression were analysed after 48 h by RT-PCR. While overexpression of wild type NAB2 did not significantly effect EGR expression, ectopic expression of dnNAB2 resulted in an increase (P <0.05) in EGR1, EGR2, and EGR3 mRNA levels, which was most prominent for EGR3. This indicates that endogenous NAB2 proteins inhibit not only the activity (Svaren et al., 1998) but also the autoregulated expression of the EGR family members.
To investigate how each of the EGR family members influence NAB2 promoter activity, human EGR1, EGR2, or EGR3 were transfected together with the human NAB2 promoter into the colon carcinoma cell lines Colo 320DM, LoVo, and the melanoma cell lines Mel 888 and Mel Ei (Fig. 3A). Transfection efficiencies of the cell lines as determined using a EGFP expression construct were similar (Mel 888, 40%; Mel Ei, 39%; Lovo 30%; Colo 320DM, 45%). Sixty ng of the luciferase reporter construct maluc-679, which contains the NAB2 promoter, were transfected together with either 40 ng of EGR1, EGR2, EGR3, or PHLDA1 as control. In all cell lines EGR1, EGR2, and EGR3 increased the NAB2 promoter activity compared to PHLDA1. EGR1- and EGR3-mediated activation was higher than EGR2-dependent activation in each cell line. Transfection of EGR2 resulted in an 1.5 to 5-fold activation of the NAB2 promoter. Induction of the NAB2 promoter mediated by EGR1 was 6 to 14-fold in the melanoma cell lines, whereas it was only 2 to 5-fold in the colon carcinoma cells. EGR3-dependent induction was also higher in melanoma cells (7 to 9-fold) than in the colon carcinoma cells (2 to 3-fold). These results indicate not only that EGR1 and EGR3 are more potent activators of NAB2 transcription than EGR2 but also that EGR1 and EGR3 have a strong influence on the regulation of NAB2 expression especially in melanoma cell lines. Transfection of Mel 888 cells with increasing amounts (2–40 ng) of either EGR1, EGR2, EGR3, or PHLDA1 as control together with 60 ng of the reporter construct maluc-679 resulted in a dose-dependent activation of the NAB2 promoter by each of the EGR molecules (Fig. 3B). Although transfection of Mel 888 with 2 ng of EGR1 and EGR2 had no effect on the promoter activity 2 ng of EGR3 were sufficient to activate the NAB2 promoter by 4-fold (P <0.01), suggesting that EGR3 is the more potent activator of the NAB2 promoter. These results indicate that EGR1, EGR2, and EGR3 each induce the expression of their coregulator NAB2 by activating the NAB2 promoter in melanoma and colon carcinoma cells. Similar results were obtained for cervix and breast carcinoma cell lines (data not shown).
Fig. 3.

EGR1, EGR2, and EGR3 are important regulators of NAB2 transcription. A. EGR1, EGR2, and EGR3 activate the NAB2 promoter. Mel 888, Mel Ei, Colo 320DM, and Lovo cells were transfected with 60 ng of maluc-679, which contains the human NAB2 promoter, and 40 ng of either human EGR1, EGR2, EGR3, or PHLDA1 control DNA. Luciferase activity was determined as described in “Experimental Procedures”. Results are presented as fold activity over luciferase activity of maluc-679 cotransfected with PHLDA1. Average and standard deviation of triplicates from a representative experiment is shown. * P <0.05, ** P <0.01, and *** P <0.001 of PHLDA1 versus EGR1, EGR2, EGR3 or as indicated by connecting lines. P values were calculated using Student’s t-test. B. EGR1, EGR2, and EGR3 activate the NAB2 promoter in a dose-dependent manner. Mel 888 cells were transfected with 60 ng of maluc-679, which contains the human NAB2 promoter, and increasing amounts, as indicated, of either human EGR1, EGR2, EGR3, or PHLDA1 control DNA. Empty vector DNA added to make a total of 100 ng. Luciferase activity was determined as described in “Experimental Procedures”. Results are presented as fold activity over luciferase activity of maluc-679 cotransfected with PHLDA1. Average and standard deviation of triplicates from a representative experiment is shown. * P <0.05, ** P <0.01, *** P <0.001, n.s., not significant (PHLDA1 versus EGR1, EGR2, or EGR3). P values were calculated using Student’s t-test. C. EGR1 and EGR3 act in concert to activate the NAB2 promoter. Mel 888 cells were transfected with 60 ng of maluc-679 and different combinations, as indicated, of 15 ng of human EGR1, EGR2, EGR3, or PHLDA1 control plasmid DNA. Vector DNA was added to make a total of 105 ng. Luciferase activity was determined as described in “Experimental Procedures”. Results are presented as fold activity over luciferase activity of maluc-679 cotransfected with PHLDA1 control plasmid DNA. Average and standard deviation of triplicates from a representative experiment is shown. ** P <0.01, *** P <0.001, n.s., not significant of PHLDA1 versus EGR1, EGR2, EGR3 or as indicated by connecting lines. P values were calculated using Student’s t-test. D. Depletion of EGR2 or EGR3 reduces NAB2 expression in the human melanoma cell line SK-MEL-23. SK-MEL-23 cells were transfected with negative control siRNA or siRNAs directed against EGR2 or EGR3 as described in “Experimental Procedures”. 24 hours later mRNA expression of NAB2, EGR1, EGR2, and EGR3 was determined using real time PCR (as described in “Experimental Procedures”). Average mRNA expression in relation to negative control (black bar) and standard deviation of triplicates from one representative experiment out of two performed is shown. * P <0.05, ** P <0.01, and *** P <0.001 of control siRNA versus siRNA against EGR2 or EGR3. P values were calculated using Student’s t-test.
EGR1 and EGR3 activate the NAB2 promoter in concert in melanoma cells
To investigate whether EGR1, EGR2, and EGR3 act simultaneously on the NAB2 promoter Mel 888 cells were transfected with the NAB2 promoter together with different combinations of the EGR expression vectors. Fifteen ng of each expression construct were used in these experiments since previous results indicated that transfection of 10 or 20 ng of EGR1, EGR2, or EGR3 expression constructs lead to detectible but not maximal induction of the NAB2 promoter. Sixty ng of the NAB2 promoter reporter construct maluc-679 were transfected into Mel 888 cells together with 15 ng of either EGR1, EGR2, EGR3, or PHLDA1 as control (Fig. 3C). Empty vector was added to make a total of 105 ng DNA. Similar to the results in Fig. 3A activation of the NAB2 promoter was strongest by EGR1 or EGR3 (5-fold), whereas induction by EGR2 was only 3-fold. Concomitant transfection of EGR1 and EGR3 resulted in a doubling of the NAB2 promoter activity (10-fold) compared to the activation mediated by each transcription factor alone (5-fold). EGR1- and EGR3-dependent promoter induction was not significantly influenced by simultaneous transfection of EGR2. These results suggest that EGR1 and EGR3 act in concert to activate the NAB2 promoter and exclude mutual inhibition between these factors on the NAB2 promoter in melanoma cells.
EGR2 and EGR3 are important positive regulators of endogenous NAB2 expression
The importance of endogenous EGR2 and EGR3 in the regulation of NAB2 expression was investigated using short-interfering (si) RNAs. The human melanoma cell line SK-MEL-23 was chosen for these experiments as it expresses significant basel levels of NAB2, EGR2 and EGR3. SK-MEL-23 was transfected with siRNAs directed against either EGR2 or EGR3, or a negative control with no similarity to human gene sequences. After 24 h the effects on EGR1, EGR2, EGR3, and NAB2 expression were determined by real time PCR (Fig. 3D). Transfection of siRNA directed against EGR2 resulted in a 46% reduction of EGR2 expression and a 34% decrease of NAB2 expression, while EGR3 expression was reduced only slightly and EGR1 expression was not influenced. A reduction of EGR3 expression by 26% by EGR3-specific siRNA was associated with a reduction of NAB2 expression by 38% and EGR2 levels by 21%, whereas EGR1 mRNA remained unaffected. Taken together, our results indicate that the transcription factors EGR2 and EGR3 are important for the basal expression of their coregulator NAB2 in melanoma cells.
Identification of EGR2- and EGR3-responsive elements in the NAB2 promoter
A cluster of multiple EGR/SP1 binding sites and one AP2 site located at bp −329 to −260, in addition to elements located further upstream, was shown to play a crucial role in EGR1-mediated activation of the NAB2 promoter (Kumbrink et al., 2005). To investigate whether the same or distinct elements in the NAB2 promoter are necessary for EGR2- and EGR-3-dependent activation Colo 320DM and Mel 888 cells were transfected with 5′ truncated NAB2 promoter fragments (100 ng) together with 40 ng of expression constructs for EGR2, EGR3, or PHLDA1 as control (Fig. 4). The highest EGR-mediated activity, as normalized to PHLDA1 transfected cells, was obtained in both cell lines with maluc-679, containing the NAB2 promoter, and this was therefore set as 100%. As seen previously (Fig. 3A) the activation by each factor was higher in Mel 888 cells and EGR3-mediated induction (3 and 4-fold) was higher than EGR2-mediated (1.5 and 2-fold). The EGR2- and EGR3-induced pattern of activity of the 5′ truncated NAB2 promoter constructs was similar in Mel 888 and Colo 320DM. Serial truncation of the NAB2 promoter to bp −468 resulted in a successive reduction of EGR-mediated activity. Removal of additional 89 bp to bp −379 had no influence on luciferase activity. This indicates that, as observed for EGR1 (Kumbrink et al., 2005), the EGR1/SP1 binding site at bp −422 is also only of minor importance in response to EGR2 and EGR3, whereas elements further upstream, including two EGR1/SP1 sites, two EGR2 and two CREB sites, an EGR3/SP2 site, an AP2 motif as well as an ETS binding site, contribute significantly to EGR-dependent NAB2 promoter activation. Further 5′ deletion of the NAB2 promoter to nucleotide −263 resulted in a strong reduction of luciferase activity, indicating an important element between bp −379 and −263 responsive to EGR2 and EGR3. This region, comprising a cluster of multiple EGR/SP1 binding sites and one AP2 site (bp −329 to −263), was shown previously to be important for EGR1-dependent activation of the NAB2 promoter (Kumbrink et al., 2005). Although maluc-263 is still responsive to the EGR factors in Colo 320DM, further truncation to bp −195 completely abolished EGR-mediated induction of the NAB2 promoter, suggesting that two EGR1/SP1 sites as well as one ETS and CREB motif, located from bp −195 to −74, have no function in EGR-mediated NAB2 promoter activation in Colo 320DM cells. In contrast to this, in Mel 888 cells a significant activation of maluc-195 was observed in response to EGR2 (2.5-fold) and EGR3 (4-fold). Further addition of 68 bp to bp −263 resulted in the strongest EGR2-mediated activation (5-fold) observed in the NAB2 promoter deletion constructs leading to 30% of the maximum activity induced by EGR2. This indicates the importance of two overlapping EGR1/SP1 sites and one CREB motif between bp −263 and −195 in response to EGR2 in Mel 888 cells. Although in Colo 320DM the complete promoter up to bp −679 is required for maximum EGR2-induced activity in Mel 888 maluc-558 was sufficient, thus indicating the significance of an EGR3/SP2 and an EGR1/SP1 site between bp −558 and −468 in response to EGR2 in Mel 888 cells. However, these cis-regulatory elements mediated the highest EGR3-induced activity (4.5-fold) in Colo 320DM, showing that in Colo 320DM cells this region is preferentially responsive to EGR3 whereas it is important for both factors in Mel 888. While in Mel 888 cells the EGR3-mediated fold activation of maluc-558 was similar to that obtained with maluc-679 the induction of maluc-679 by EGR3 is reduced in Colo 320DM cells by 35%. Since elements located from bp −679 to −558 are necessary in both cell lines for the maximum NAB2 promoter activity in response to EGR3, this suggests the involvement of other factors recruited to this region, which attenuate the EGR3-mediated induction of the NAB2 promoter in Colo 320DM cells. The region between bp −679 and −558 contains two EGR2 and two CREB sites, an EGR1/SP1 site, an AP2 motif, as well as an ETS binding site.
Fig. 4.

Identification of EGR2- (A.) and EGR3- (B.) responsive elements in the NAB2 promoter. Mel 888 and Colo 320DM cells were transfected with 100 ng of the indicated promoter reporter construct and 40 ng of human EGR2, EGR3, or PHLDA1 as control as described in “Experimental Procedures”. The results are presented as the mean and standard deviation of triplicates from a representative experiment. Left panel, results are presented as EGR2- or EGR3-mediated fold activity compared to PHLDA1 control plasmid (set as 1) of the indicated reporter constructs. Right panel, results are shown as percent of the maximum EGR2- or EGR3-mediated NAB2 promoter activty obtained with maluc-679, which was set as 100%. Before calculating the percentages the luciferase activity of the PHLDA1-transfected cells was subtracted from the luciferase activity of the NAB2 promoter constructs.
In summary, the pattern of activation of the NAB2 promoter deletion constructs by EGR2 and EGR3 was similar to that previously described for phorbol esters and EGR1 (Kumbrink et al., 2005). The major regulatory element at bp −329 to −263, comprising a cluster of multiple Egr/Sp1 binding sites and one AP2 site, was shown to be important for EGR1, EGR2, as well as EGR3-induced activity. Furthermore, the region between bp −679 and −558, including two EGR2 and two CREB sites, an EGR1/SP1 site, an AP2 motif as well as an ETS binding site, might contribute to the stronger activation of the NAB2 promoter by EGR3 detected in melanoma cell lines.
The role of the EGR transcription factors in NAB2 induction in response to phorbol esters
The expression kinetics of the EGR transcription factors and NAB2 are highly variable depending on cell type and stimulus (Beckmann et al., 1997; Collins et al., 2008; Honkaniemi et al., 2000). In order to gain insight into the temporal regulation of NAB2 transcription a comprehensive analysis of the expression kinetics of EGR1, EGR2, EGR3, and NAB2 in response to the phorbol ester PMA was performed. Expression levels were monitored over 12 time points in three melanoma and two colon carcinoma cell lines using RT-PCR (Fig. 5). In Mel 888 cells a transient induction of EGR1, EGR2, EGR3, and NAB2 was observed. EGR1 levels were increased after 15 min reaching its maximum after 30 min. EGR2 and EGR3 expression were induced after 30 min. While EGR2 levels peaked after 45 min, the maximum expression of EGR3 was detected after 1.5 h. Due to the high basal levels only a weak induction of NAB2 was observed after 1 h reaching its maximum after 2 h. After 6 to 10 h the levels of EGR1, EGR2, EGR3, and NAB2 declined. A similar kinetic was observed for a second melanoma cell line Mel Ei (data not shown). In comparison to Mel 888 a delayed induction of EGR1, EGR2, and EGR3 expression, which was associated with a postponed NAB2 induction, was observed in the colon carcinoma cell lines Colo 320DM and LoVo (data not shown). In Mel JuSo the maximum expression of EGR3 as well as that of NAB2 in response to PMA ocurred 45 min earlier compared to Mel 888, emphasizing the importance of EGR3 in the induction of NAB2. In contrast to the transient PMA-mediated activation of EGR1, EGR2, EGR3, and NAB2 expression in Mel 888, the induced mRNA expression of all factors remained stable for 14 hours in Mel JuSo. In Colo 320DM a prolonged induction of EGR1 but not of NAB2 was observed, suggesting that EGR2 and EGR3 are necessary to maintain NAB2 expression. These results suggest that EGR1 seems to be important in a rapid but low NAB2 induction, whereas EGR2 and EGR3 are apparently necessary for the maximum induction and maintenance of NAB2 expression in response to phorbol esters.
Fig. 5.

Expression kinetics of EGR1, EGR2, EGR3, and NAB2 in melanoma and colon carcinoma cells in response to phorbol esters. Colo 320DM (A.), Mel 888 (B.), and Mel JuSo (C.) cells were either stimulated for 15 min to 14 h with PMA (as indicated) or left untreated (0′) as described in “Experimental Procedures”. Results are presented from one representative experiment out of at least two performed. Left panel, expression of EGR1, EGR2, EGR3, NAB2, and GAPDH mRNA in the indicated cell lines was determined by RT-PCR (as described in “Experimental Procedures”). –DNA, control for PCR. Right panel, densitometric analysis of EGR1, EGR2, EGR3, and NAB2 mRNA expression as indicated (as described in “Experimental Procedures”). Results are presented as the ratio of EGR1, EGR2, EGR3, or NAB2 to GAPDH levels.
EGR1-, EGR2-, and EGR3-mediated induction of the NAB2 promoter is inhibited by Nab corepressors
Nab1 has been shown to act as a repressor of Egr1 and Egr2 but not of Egr3 (Russo et al., 1995), whereas NAB2 is able to repress Egr3 as well (Sevetson et al., 2000; Svaren et al., 1996; Svaren et al., 1998). To determine the influence of NAB1 and NAB2 on EGR1-, EGR2-, and EGR3-induced NAB2 promoter activity in melanoma cells, 60 ng of the reporter construct maluc-679 was cotransfected with either 40 ng EGR1, EGR2, EGR3, or PHLDA1 as control and 40 ng NAB1 and/or NAB2 into Mel 888 cells (Fig. 6A). Emtpy vector was used to make a total of 180 ng of DNA. Expression of NAB1 reduced the 9-fold EGR1-mediated induction by 75% and the 2-fold EGR2-mediated activation by 54%, whereas the EGR3-mediated induction (8-fold) was not significantly affected. In contrast, transfection of NAB2 completely inhibited the activation of the NAB2 promoter by each of the EGR molecules. EGR2-mediated activation was reduced by NAB2 slightly below the basal NAB2 promoter activity. No further reduction of NAB2 promoter activity was observed after cotransfection of NAB1 and NAB2. Additional transfection of increasing amounts (2–60 ng) of NAB2 together with 40 ng EGR1, EGR3, or PHLDA1 as control resulted in a dose-dependent inhibition of EGR1- and EGR3-mediated NAB2 promoter activity, which was complete at 40 ng (Fig. 6B). These results indicate that NAB2 can completely repress EGR1-, EGR2-, and EGR3-mediated activation of the NAB2 promoter, whereas NAB1 is a less potent inhibitor of only EGR1 and EGR2.
Fig. 6.

EGR1-, EGR2-, and EGR3-mediated induction of the NAB2 promoter is inhibited by NAB corepressors. A. Mel 888 cells were transfected with 60 ng of maluc-679 and 40 ng of expression constructs for human EGR1, EGR2, EGR3, NAB1, NAB2, or PHLDA1, as control for basal promoter activity, as indicated. Vector DNA was added to make a total of 180 ng. Luciferase activity was determined as described in “Experimental Procedures”. The results are presented as the mean and standard deviation of triplicates from a representative experiment. RLU, relative light units/μg protein. n.s., not significant (P >0.05). P values were calculated using Student’s t-test. B. Mel 888 cells were transfected with 60 ng of maluc-679 and 40 ng EGR1, EGR3, or PHLDA1, as control, and increasing amounts of human NAB2, as indicated in ng DNA. Vector DNA was added to make a total of 160 ng. Luciferase activity was determined as described in “Experimental Procedures”. Results are presented as fold activity over luciferase activity of maluc-679 cotransfected with PHLDA1. Average and standard deviation of triplicates from a representative experiment is shown.
DISCUSSION
The EGR family of transcription factors, comprising EGR1 (NGFI-A, Krox24), EGR2 (Krox20), and EGR3 (PILOT), play key roles in the regulation of proliferation, differentiation, and other cellular responses to extracellular stimuli (Carter et al., 2007; Thiel et al., 2002; Unoki et al., 2003). The activity of the EGR family members is controlled in part through the binding of NAB2 (Russo et al., 1995; Sevetson et al., 2000; Svaren et al., 1996; Svaren et al., 1998).
Recent studies have shown that EGR1 itself induces the expression of NAB2 by binding to the human NAB2 promoter following stimulation with phorbol esters in melanoma and colon carcinoma cells (Kumbrink et al., 2005).
How EGR2 and EGR3 influence Nab2 expression appears to depend on cell type specific programs. Enhanced Nab2 mRNA was observed in human breast cancer cells transfected with EGR3 (Inoue et al., 2004) and in rat Schwann cells transfected with Egr2 (Nagarajan et al., 2001). However, depletion of Egr2 did not influence Nab2 levels in myeloid progenitors (Laslo et al., 2006) and in CD4 T lymphocytes Egr2 and Egr3 were shown to inhibit Nab2 expression (Collins et al., 2008). This suggests a distinct regulation of the NAB2/EGR system in hematopoietic cells and cells of neuroectodermal and epithelial origin.
To address this question we have analyzed the regulation of NAB2 expression by members of the EGR transcription factor family in cells of neuroectodermal and epithelial origin. Transient transfections showed that EGR1, EGR2, and EGR3 activate the NAB2 promoter in these cells (Fig. 3). EGR1 and EGR3 are more potent activators than EGR2. Cis-regulatory elements in the NAB2 promoter described to be responsive to EGR1 and phorbol esters (Kumbrink et al., 2005), including the evolutionary conserved major regulatory element at bp −329 to −263, were found to also be important for EGR2- and EGR3-induced activity (Fig. 4). This major regulatory element is comprised of a cluster of multiple overlapping EGR/SP1 binding sites. EGR2 was shown to be recruited to this element in the rat Nab2 promoter after treatment with neuregulin (Srinivasan et al., 2007). The importance of the three EGR family members as activators of endogenous NAB2 expression was shown using transfection of specific siRNAs (Kumbrink et al., 2005) (Fig. 3D). Depletion of EGR2 or EGR3 in SK-MEL-23 melanoma cells reduced not only EGR2 or EGR3 levels but also NAB2 levels.
Taken together these results indicate that in melanoma and carcinoma cells EGR1, EGR2, and EGR3 each activate the NAB2 promoter and lead to mRNA expression. In turn the NAB2 promoter activity induced by EGR1, EGR2, and EGR3 in these cells is inhibited by NAB2 (Fig. 6A).
In addition to the reduction in NAB2 expression, transfection of EGR3 siRNA also led to a decrease in EGR2 levels, whereas EGR1 levels remained unaffected, indicating that EGR2 is a target gene of EGR3. Consistent with this, ectopic expression of EGR3 resulted in an increase of endogenous EGR2 levels (Fig. 2B) as has also been observed in T cells (Collins et al., 2008). However, in contrast to T cells where overexpression of Egr3 leads to a downregulation of Nab2 and Egr1, in carcinoma and melanoma cells EGR3 activated NAB2 mRNA expression and had no influence on EGR1 expression. After transfection of EGR1 the endogenous EGR3 and EGR2 expression in colon carcinoma (Fig. 2B) and Egr3 expression in neuroblastoma cells were increased (Ehrengruber et al., 2000). Derepression of EGR-activity by dominant negative NAB2 led to enhanced endogenous EGR1, EGR2, and EGR3 levels in breast carcinoma cells (Fig. 2C). The increase in EGR2 and EGR3 expression can be explained by the enhanced activity of the highly expressed EGR1 (which induces EGR2 and EGR3) and EGR3 which induces EGR2 (Fig. 2B and summarized in Fig. 7). Neither transcription factor overexpression studies nor siRNA silencing experiments indicated that EGR2 or EGR3 influence EGR1 expression. However, EGR1 has been shown to be recruited to its own promoter in response to growth factors (Langmann et al., 2009; Sakamoto et al., 1994) suggesting that EGR1 can induce its own expression. These observations point to a positive autoregulation within the EGR family which might result in a stronger and maintained NAB2 induction in response to environmental stimuli or a constitutive NAB2 expression as observed in malignant melanomas (Kirsch et al., 1996).
Fig. 7.

Model of the EGR/NAB2 negative feedback system in cells of neuroectodermal and epithelial origin. Arrows represent activation of transcription and barred lines indicate repression of transcriptional activity and expression.
The transient induction of EGR1 in response to environmental stimuli usually occurs after minutes and is followed one to two hours later by an increase of NAB2 expression (Kumbrink et al., 2005; Thiel et al., 2002). However, the expression kinetics and inducibility of the EGR family members are highly variable depending on cell type and stimulus (Collins et al., 2008; Honkaniemi et al., 2000; von der Kammer H. et al., 1998). To date the most extensive study on the expression pattern and functional interactions between the Egr family members and Nab2 has been conducted in CD4 T lymphocytes (Collins et al., 2008). In these cells the maximum Egr1 and Egr3 induction in response to the phorbol ester PMA occurs early and concurrently, while Egr2 and Nab2 expression peaks 2 hours later. In contrast, our studies demonstrate a different kinetic picture in cells of neuroectodermal and epithelial origin (Fig. 5). PMA treatment resulted in an early induction of EGR1 followed by an increase in EGR2, EGR3, and finally NAB2 levels. High and prolonged NAB2 levels were associated with strong EGR2 and EGR3 expression. This suggests that unlike in T cells, where Egr2 and Egr3 inhibit Nab2 expression, in neuroectodermal and epithelial cells EGR2 and EGR3 are necessary for the maximum induction and maintenance of NAB2 levels.
Taken together our data show that EGR1, EGR2, and EGR3 are important cooperative positive regulators of basal as well as inducible NAB2 transcription in melanoma and carcinoma cells. Nevertheless, other transcription factors certainly also play a role. In addition to the large number of EGR/SP1 binding sites, motifs for CREB, ETS family members, NFκB, and AP2 were also identified in the NAB2 promoter or in close vicinity. Recent studies demonstrated a coregulation of NAB2 transcription by two ETS factors, Ets2 and Etv1, and Egr2 in rat Schwann cells (Srinivasan et al., 2007). The inducible ETS proteins and Egr2 seem to be able to act independently but also synergistically on the Nab2 promoter. Although, in contrast to several ETS sites present in the rat Nab2 promoter (Srinivasan et al., 2007), only two putative binding sites for ETS factors were identified in the human NAB2 promoter, these studies suggest the ETS factors may also be important regulators of NAB2 transcription in humans.
Several studies have demonstrated, in contrast to the major definition of NAB2 as a corepressor of the EGR transcription factors (Kumbrink et al., 2005; Lucerna et al., 2003; Silverman et al., 1999; Svaren et al., 1996), that NAB2 can act also as a coactivator of EGR-mediated promoter activation (Collins et al., 2006; Sevetson et al., 2000). However, the studies presented here and previous studies with EGR1 (Kumbrink et al., 2005) showed that EGR1, EGR2, and EGR3-mediated induction of the NAB2 promoter was completely inhibited by NAB2 in melanoma cells (Fig. 6).
In conclusion, our results (as depicted in Fig. 7) indicate that in cells of neuroectodermal and epithelial origin, EGR1, EGR2, and EGR3 autoregulate each other and induce the expression of NAB2 which results in the establishment of a negative feedback loop to limit the activity on the NAB2 promoter and the expression of the EGR family members in response to environmental stimuli. This is further supported by a recent study showing that the Egr transcription factors are required for epidermal growth factor (EGF)-mediated proliferation of astrocytes which is blockable by Nab2 (Mayer et al., 2009). These findings and the results presented here point to a distinct EGR/NAB2 function in neuroectodermal and epithelial cells as compared to hematopoetic cells.
Since a dysregulation of the NAB2/EGR system is associated with several malignancies our studies might open new avenues to develop therapeutic strategies. In malignant melanoma NAB2 is overexpressed (Kirsch et al., 1996) whereas in the majority of prostate carcinomas NAB2 expression is lost (Abdulkadir et al., 2001a) and enhanced EGR1 activity promotes tumorigenesis (Abdulkadir et al., 2001b) and growth under androgen-depleted conditions (Yang et al., 2006). EGR3 was shown to play an important role in estrogen-meditated invasion (Inoue et al., 2004) and was recently identified as an independent prognostic factor in breast carcinoma (Suzuki et al., 2007). NAB2 (Lucerna et al., 2003), EGR1 (Lee et al., 2009), and EGR3 (Liu et al., 2008) are all involved in the regulation of VEGF-mediated angiogenesis and thus targeted modulation of the NAB2/EGR system could be useful in influencing angiogenic activity not only in tumors but also in cardiovascular disease. Furthermore, Egr2-Nab interaction has been shown to be critical for proper peripheral nerve myelination (Baloh et al., 2009; Desmazieres et al., 2008). Thus, understanding the detailed mechanism of the cell type and disease specific NAB2/EGR relationships can have important clinical implications.
Acknowledgments
Contract grant sponsor: Wilhelm Sander Stiftung; Contract grant number: 1997.044.02.
Contract grant sponsor: Friedrich Baur Stiftung; Contract grant number: 0013/2008.
Contract grant sponsor: NIH/NCI; Contract grant number: CA106468.
Footnotes
The abbreviations used are: EGR, early growth response; NGFI-A, nerve growth factor-induced protein A; Nab, NGFI-A binding protein; MADER, melanoma associated delayed early response gene; SP1, specificity protein 1; GAPDH, glyceraldehyde-3-phosphate dehydrogenase; G6PD, glucose-6-phosphate dehydrogenase; AP2, activator protein 2; CREB, cAMP-responsive element binding protein; PDGF, platelet-derived growth factor; bFGF, basic fibroblast growth factor; VEGF, vascular endothelial growth factor; TCR, T cell receptor; siRNA, short-interfering RNA; PMA, phorbol myristate acetate; EMSA, electrophoretic mobility shift assay; PHLDA1, pleckstrin homology-like domain A-1; EGF, epidermal growth factor.
References
- Abdulkadir SA, Carbone JM, Naughton CK, Humphrey PA, Catalona WJ, Milbrandt J. Frequent and early loss of the EGR1 corepressor NAB2 in human prostate carcinoma. Hum Pathol. 2001a;32:935–939. doi: 10.1053/hupa.2001.27102. [DOI] [PubMed] [Google Scholar]
- Abdulkadir SA, Qu Z, Garabedian E, Song SK, Peters TJ, Svaren J, Carbone JM, Naughton CK, Catalona WJ, Ackerman JJ, Gordon JI, Humphrey PA, Milbrandt J. Impaired prostate tumorigenesis in Egr1-deficient mice. Nat Med. 2001b;7:101–107. doi: 10.1038/83231. [DOI] [PubMed] [Google Scholar]
- Baloh RH, Strickland A, Ryu E, Le N, Fahrner T, Yang M, Nagarajan R, Milbrandt J. Congenital hypomyelinating neuropathy with lethal conduction failure in mice carrying the Egr2 I268N mutation. J Neurosci. 2009;29:2312–2321. doi: 10.1523/JNEUROSCI.2168-08.2009. [DOI] [PMC free article] [PubMed] [Google Scholar]
- Beckmann AM, Wilce PA. Egr transcription factors in the nervous system. Neurochem Int. 1997;31:477–510. doi: 10.1016/s0197-0186(96)00136-2. [DOI] [PubMed] [Google Scholar]
- Carter JH, Lefebvre JM, Wiest DL, Tourtellotte WG. Redundant role for early growth response transcriptional regulators in thymocyte differentiation and survival. J Immunol. 2007;178:6796–6805. doi: 10.4049/jimmunol.178.11.6796. [DOI] [PubMed] [Google Scholar]
- Cartharius K, Frech K, Grote K, Klocke B, Haltmeier M, Klingenhoff A, Frisch M, Bayerlein M, Werner T. MatInspector and beyond: promoter analysis based on transcription factor binding sites. Bioinformatics. 2005;21:2933–2942. doi: 10.1093/bioinformatics/bti473. [DOI] [PubMed] [Google Scholar]
- Collins S, Lutz MA, Zarek PE, Anders RA, Kersh GJ, Powell JD. Opposing regulation of T cell function by Egr-1/NAB2 and Egr-2/Egr-3. Eur J Immunol. 2008;38:528–536. doi: 10.1002/eji.200737157. [DOI] [PMC free article] [PubMed] [Google Scholar]
- Collins S, Wolfraim LA, Drake CG, Horton MR, Powell JD. Cutting Edge: TCR-induced NAB2 enhances T cell function by coactivating IL-2 transcription. J Immunol. 2006;177:8301–8305. doi: 10.4049/jimmunol.177.12.8301. [DOI] [PubMed] [Google Scholar]
- Desmazieres A, Decker L, Vallat JM, Charnay P, Gilardi-Hebenstreit P. Disruption of Krox20-Nab interaction in the mouse leads to peripheral neuropathy with biphasic evolution. J Neurosci. 2008;28:5891–5900. doi: 10.1523/JNEUROSCI.5187-07.2008. [DOI] [PMC free article] [PubMed] [Google Scholar]
- Ehrengruber MU, Muhlebach SG, Sohrman S, Leutenegger CM, Lester HA, Davidson N. Modulation of early growth response (EGR) transcription factor-dependent gene expression by using recombinant adenovirus. Gene. 2000;258:63–69. doi: 10.1016/s0378-1119(00)00445-5. [DOI] [PubMed] [Google Scholar]
- Honkaniemi J, Zhang JS, Longo FM, Sharp FR. Stress induces zinc finger immediate early genes in the rat adrenal gland. Brain Res. 2000;877:203–208. doi: 10.1016/s0006-8993(00)02673-1. [DOI] [PubMed] [Google Scholar]
- Inoue A, Omoto Y, Yamaguchi Y, Kiyama R, Hayashi SI. Transcription factor EGR3 is involved in the estrogen-signaling pathway in breast cancer cells. J Mol Endocrinol. 2004;32:649–661. doi: 10.1677/jme.0.0320649. [DOI] [PubMed] [Google Scholar]
- Khachigian LM, Williams AJ, Collins T. Interplay of Sp1 and Egr-1 in the Proximal Platelet-Derived Growth-Factor-A-Chain Promoter in Cultured Vascular Endothelial-Cells. J Biol Chem. 1995;270:27679–27686. doi: 10.1074/jbc.270.46.27679. [DOI] [PubMed] [Google Scholar]
- Kirsch KH, Korradi Y, Johnson JP. Mader: a novel nuclear protein over expressed in human melanomas. Oncogene. 1996;12:963–971. [PubMed] [Google Scholar]
- Kumbrink J, Gerlinger M, Johnson JP. Egr-1 induces the expression of its corepressor nab2 by activation of the nab2 promoter thereby establishing a negative feedback loop. J Biol Chem. 2005;280:42785–42793. doi: 10.1074/jbc.M511079200. [DOI] [PubMed] [Google Scholar]
- Langmann T, Ebert S, Walczak Y, Weigelt K, Ehrengruber MU, Stiewe T, Weber BH. Induction of early growth response-1 mediates microglia activation in vitro but is dispensable in vivo. Neuromolecular Med. 2009;11:87–96. doi: 10.1007/s12017-009-8061-6. [DOI] [PubMed] [Google Scholar]
- Laslo P, Spooner CJ, Warmflash A, Lancki DW, Lee HJ, Sciammas R, Gantner BN, Dinner AR, Singh H. Multilineage transcriptional priming and determination of alternate hematopoietic cell fates. Cell. 2006;126:755–766. doi: 10.1016/j.cell.2006.06.052. [DOI] [PubMed] [Google Scholar]
- Lee KH, Kim JR. Hepatocyte growth factor induced up-regulations of VEGF through Egr-1 in hepatocellular carcinoma cells. Clin Exp Metastasis. 2009;26:685–692. doi: 10.1007/s10585-009-9266-7. [DOI] [PubMed] [Google Scholar]
- Liu D, Evans I, Britton G, Zachary I. The zinc-finger transcription factor, early growth response 3, mediates VEGF-induced angiogenesis. Oncogene. 2008;27:2989–2998. doi: 10.1038/sj.onc.1210959. [DOI] [PubMed] [Google Scholar]
- Liu D, Jia H, Holmes DI, Stannard A, Zachary I. Vascular endothelial growth factor-regulated gene expression in endothelial cells: KDR-mediated induction of Egr3 and the related nuclear receptors Nur77, Nurr1, and Nor1. Arterioscler Thromb Vasc Biol. 2003;23:2002–2007. doi: 10.1161/01.ATV.0000098644.03153.6F. [DOI] [PubMed] [Google Scholar]
- Livak KJ, Schmittgen TD. Analysis of relative gene expression data using real-time quantitative PCR and the 2(−Delta Delta C(T)) Method. Methods. 2001;25:402–408. doi: 10.1006/meth.2001.1262. [DOI] [PubMed] [Google Scholar]
- Lucerna M, Mechtcheriakova D, Kadl A, Schabbauer G, Schafer R, Gruber F, Koshelnick Y, Muller HD, Issbrucker K, Clauss M, Binder BR, Hofer E. NAB2, a corepressor of EGR-1, inhibits vascular endothelial growth factor-mediated gene induction and angiogenic responses of endothelial cells. J Biol Chem. 2003;278:11433–11440. doi: 10.1074/jbc.M204937200. [DOI] [PubMed] [Google Scholar]
- Mager GM, Ward RM, Srinivasan R, Jang SW, Wrabetz L, Svaren J. Active gene repression by the Egr2. NAB complex during peripheral nerve myelination. J Biol Chem. 2008;283:18187–18197. doi: 10.1074/jbc.M803330200. [DOI] [PMC free article] [PubMed] [Google Scholar]
- Mayer SI, Rossler OG, Endo T, Charnay P, Thiel G. Epidermal-growth-factor-induced proliferation of astrocytes requires Egr transcription factors. J Cell Sci. 2009;122:3340–3350. doi: 10.1242/jcs.048272. [DOI] [PubMed] [Google Scholar]
- Nagarajan R, Svaren J, Le N, Araki T, Watson M, Milbrandt J. EGR2 mutations in inherited neuropathies dominant-negatively inhibit myelin gene expression. Neuron. 2001;30:355–368. doi: 10.1016/s0896-6273(01)00282-3. [DOI] [PubMed] [Google Scholar]
- Neef R, Kuske MA, Prols E, Johnson JP. Identification of the human PHLDA1/TDAG51 gene: Down-regulation in metastatic melanoma contributes to apoptosis resistance and growth deregulation. Cancer Res. 2002;62:5920–5929. [PubMed] [Google Scholar]
- Quandt K, Frech K, Karas H, Wingender E, Werner T. MatInd and MatInspector: New fast and versatile tools for detection of consensus matches in nucleotide sequence data. Nucleic Acids Res. 1995;23:4878–4884. doi: 10.1093/nar/23.23.4878. [DOI] [PMC free article] [PubMed] [Google Scholar]
- Russo MW, Sevetson BR, Milbrandt J. Identification of Nab1, A Repressor of Ngfi-A-Mediated and Krox20-Mediated Transcription. Proc Natl Acad Sci U S A. 1995;92:6873–6877. doi: 10.1073/pnas.92.15.6873. [DOI] [PMC free article] [PubMed] [Google Scholar]
- Sakamoto KM, Fraser JK, Lee HJ, Lehman E, Gasson JC. Granulocyte-macrophage colony-stimulating factor and interleukin-3 signaling pathways converge on the CREB-binding site in the human egr-1 promoter. Mol Cell Biol. 1994;14:5975–5985. doi: 10.1128/mcb.14.9.5975. [DOI] [PMC free article] [PubMed] [Google Scholar]
- Sevetson BR, Svaren J, Milbrandt J. A novel activation function for NAB proteins in EGR-dependent transcription of the luteinizing hormone beta gene. J Biol Chem. 2000;275:9749–9757. doi: 10.1074/jbc.275.13.9749. [DOI] [PubMed] [Google Scholar]
- Silverman ES, Khachigian LM, Santiago FS, Williams AJ, Lindner V, Collins T. Vascular smooth muscle cells express the transcriptional corepressor NAB2 in response to injury. Am J Pathol. 1999;155:1311–1317. doi: 10.1016/S0002-9440(10)65233-9. [DOI] [PMC free article] [PubMed] [Google Scholar]
- Skerka C, Decker EL, Zipfel PF. Coordinate expression and distinct DNA-binding characteristics of the four EGR-zinc finger proteins in Jurkat T lymphocytes. Immunobiology. 1997;198:179–191. doi: 10.1016/S0171-2985(97)80039-3. [DOI] [PubMed] [Google Scholar]
- Srinivasan R, Jang SW, Ward RM, Sachdev S, Ezashi T, Svaren J. Differential regulation of NAB corepressor genes in Schwann cells. BMC Mol Biol. 2007;8:117. doi: 10.1186/1471-2199-8-117. [DOI] [PMC free article] [PubMed] [Google Scholar]
- Suzuki T, Inoue A, Miki Y, Moriya T, Akahira J, Ishida T, Hirakawa H, Yamaguchi Y, Hayashi S, Sasano H. Early growth responsive gene 3 in human breast carcinoma: a regulator of estrogen-meditated invasion and a potent prognostic factor. Endocr Relat Cancer. 2007;14:279–292. doi: 10.1677/ERC-06-0005. [DOI] [PubMed] [Google Scholar]
- Svaren J, Sevetson BR, Apel ED, Zimonjic DB, Popescu NC, Milbrandt J. NAB2, a corepressor of NGFI-A (Egr-1) and Krox20, is induced by proliferative and differentiative stimuli. Mol Cell Biol. 1996;16:3545–3553. doi: 10.1128/mcb.16.7.3545. [DOI] [PMC free article] [PubMed] [Google Scholar]
- Svaren J, Sevetson BR, Golda T, Stanton JJ, Swirnoff AH, Milbrandt J. Novel mutants of NAB corepressors enhance activation by Egr transactivators. Embo Journal. 1998;17:6010–6019. doi: 10.1093/emboj/17.20.6010. [DOI] [PMC free article] [PubMed] [Google Scholar]
- Thiel G, Cibelli G. Regulation of life and death by the zinc finger transcription factor Egr-1. J Cell Physiol. 2002;193:287–292. doi: 10.1002/jcp.10178. [DOI] [PubMed] [Google Scholar]
- Unoki M, Nakamura Y. EGR2 induces apoptosis in various cancer cell lines by direct transactivation of BNIP3L and BAK. Oncogene. 2003;22:2172–2185. doi: 10.1038/sj.onc.1206222. [DOI] [PubMed] [Google Scholar]
- von der Kammer H, Mayhaus M, Albrecht C, Enderich J, Wegner M, Nitsch RM. Muscarinic acetylcholine receptors activate expression of the EGR gene family of transcription factors. J Biol Chem. 1998;273:14538–14544. doi: 10.1074/jbc.273.23.14538. [DOI] [PubMed] [Google Scholar]
- Yang SZ, Eltoum IA, Abdulkadir SA. Enhanced EGR1 activity promotes the growth of prostate cancer cells in an androgen-depleted environment. J Cell Biochem. 2006;97:1292–1299. doi: 10.1002/jcb.20736. [DOI] [PubMed] [Google Scholar]