Abstract
We describe an atlas of the C57BL/6 mouse brain based on MRI and conventional Nissl histology. Magnetic resonance microscopy was performed on a total of 14 specimens that were actively stained to enhance tissue contrast. Images were acquired with three different MR protocols yielding contrast dependent on spin lattice relaxation (T1), spin spin relaxation (T2), and magnetic susceptibility (T2*). Spatial resolution was 21.5 microns (isotropic). Conventional histology (Nissl) was performed on a limited set of these same specimens and the Nissl images were registered (3D-to-3D) to the MR data. Probabilistic atlases for 37 structures are provided, along with average atlases. The availability of three different MR protocols, the Nissl data, and the labels provides a rich set of options for registration of other atlases to the same coordinate system, thus facilitating data-sharing. All the data is available for download via the web.
Introduction
The Merriam-Webster online dictionary defines “atlas” as “a bound collection of maps often including illustrations, informative tables, or textual matter” (http://www.merriam-webster.com/dictionary/atlas). In neuroscience, the term has been used to describe an extraordinary range of descriptive material in the human-brain based on post-mortem examination of cryosectioned tissues, diagrams, and more recently, digital imaging of live patients using computed tomography (CT), positron emission tomography (PET), and magnetic resonance imaging (MRI). Several authors have reviewed the utility of and complexity in assembling these neuroanatomical maps (Boline et al., 2008; Mazziotta et al., 1995; Mori et al., 2008). The advent of digital imaging in 1973 triggered the generation of superb three-dimensional (3D) maps based on CT, MRI, and PET. Neuroanatomical atlases based on MR are available for a wide range of species from the mouse (Benveniste et al., 2000; Dhenain et al., 2001; Kovacevic et al., 2005; Ma et al., 2005; MacKenzie-Graham et al., 2004 ; Mackenzie-Graham et al., 2007; Badea et al., 2007; Dorr et al, 2008), the rat (Schwarz et al., 2006), the monkey (Ghosh et al., 1994; Newman et al., 2009), and of course, humans (Schmahmann et al., 1999).
With so many atlases available, is there need for yet another? The earliest written records included maps. For example, maps of Canaan (modern-day Israel) exist back to the 5th century BC (http://israelipalestinian.procon.org/viewresource.asp?resourceID=642). Satellite maps of the very same two-dimensional space can now be readily downloaded from the Internet (http://earth.google.com). The difference is, of course, in the accuracy and in the detail. Improvements in technology will continue to make new atlases relevant. In February of 2007, a group of scientists assembled under the auspices of the International Neuroinformatics Coordinating Facility (INCF Digital Brain Atlasing program http://www.incf.org/) (http://incf.org/core/programs/atlasing/digital-brain-atlasing-1) to discuss methods that might help coordinate research in the mouse brain (Boline et al., 2007). This paper describes the first step in establishing a multimodality reference atlas of the mouse brain to accomplish this goal.
We describe in this paper “Waxholm Space” (WHS)—named in honor of the Swedish city where many of the concepts described here were formulated. Waxholm Space is both conceptual and real. The conceptual goal is to provide a multi-dimensional digital map of (initially) the adult, male C57BL/6 mouse brain. Researchers investigating such things as structure, function, gene expression, and protein expression in the mouse brain will be able to use existing (and probably new) software tools to map their experiments into this common space to facilitate comparisons and data aggregation from laboratories around the world. The data and tools will be supported at multiple sites and be freely available. The expectation is that new data mapped into this space will also be made widely available, along with the requisite tools for submitting, exploring, mining, and annotating.
The most immediate realization of these concepts is described in this paper. We present a multimodality atlas of the mouse brain centered on magnetic resonance histology (MRH) data. Magnetic resonance histology was first suggested in 1993 (Johnson et al., 1993). MR provides several benefits that are particularly relevant to our goals in establishing WHS. MRH is non-destructive. MRH supports isotropic (3D) spatial resolution with low distortion. MRH is particularly well suited for highlighting soft tissue structures in the brain. And finally, MRH is inherently digital, making the data amenable to wide distribution and digital manipulation.
Methods
WHS has been designed to provide multiple entry points to the data—all of which are registered to 3D MRH data. The MR data are acquired at what we believe to be the highest spatial resolution yet published (Johnson et al., 2007). The canonical reference set consists of three different MRH image volumes of a perfusion-fixed mouse brain with the brain in the cranium. The three different MRH sets highlight different cytoarchitecture. The same brain, removed from the skull, has been cryosectioned, stained for Nissl, reconstructed, and registered (3D-to-3D) to the undistorted MRH data, providing a fourth registered volume. Thirty-seven different structures have been manually labeled using all three planes and the contrast provided by the three different acquisitions to produce a fifth label volume. A sixth, average volume has been generated by repeating the MR acquisition process on 13 additional specimens. The additional volumes have also been downsampled to provide lower-resolution multi-dimensional volumes, since the aggregate data for a single specimen acquired in the higher resolution (3 MRH sets + histology + labels) is more than 2 GB. And, a second Nissl dataset has been provided for one of these specimens to provide additional material for validation of alignment. Three types of probabilistic atlases have been derived from systematic alignment and segmentation of the multiple MR datasets. To probe variability in the data, a maximum probability atlas, and a maximum likelihood labeling were generated based on affine transforms, as well as probability density maps for each of the 37 structures. Additionally, the same atlases were generated based on a diffeomorphic alignment to provide local measures of probability. Finally, all of the data is made available in several different formats, along with a flexible application to simultaneously display all the data for one specimen. There is an enormous amount of data, all of which is available to the public. We have distributed the data in a fashion that hopefully will allow the most ready access for users. The canonical set from the single specimen that defines WHS described below is available at (http://software.incf.org/software/waxholm-space/download). An expanded version of WHS, including data derived from 13 additional specimens, is available from the Duke Center for In Vivo Microscopy web site (http://www.civm.duhs.duke.edu/neuro201001/index.html). Finally, we provide a link (http://www.civm.duhs.duke.edu/collaboration/collaboration2.htm) to direct users to email contacts for any other data that is not available at these sites.
All animal procedures were approved by the Duke University Institutional Animal Care and Use Committee. Male C57BL/6J mice aged 66–78 days were actively stained with a mixture of formalin and ProHance (Gadoteridol, Bracco Diagnnostics, Inc., Princeton, NJ). The procedure has been fully described previously (Johnson et al., 2007). Briefly, the animal is brought to a surgical plane of anesthesia via a combination of Nembutal (Ovation Pharmaceuticals, Inc. Lake Forest, IL) and butorphanol. A catheter is inserted at the apex of the left ventricle. Saline is perfused for ~ 4 minutes followed by a flush of 1:10 (by volume) ProHance in 10% buffered formalin. The head is removed from the body and fixed for at least 24 hours in buffered formalin. The specimens were trimmed to fit (still in the cranium) into an acrylic sample holder and surrounded by fomblin, which is a perflorocarbon that minimizes susceptibility artifacts at the interface.
All scans were performed on a 9.4T vertical bore magnet interfaced to a GE console running Epic 12.4X (GE Medical Systems, Milwaukee, WI). The system is equipped with Resonance Research gradients (Resonance Research, Inc. Billerica, MA), which achieve peak gradients of 2000 mT/m. Specimens were scanned in a 12-mm diameter × 25-mm long solenoid radio frequency coil. Data were acquired by filling segmented volumes of Fourier space. The gain of the system was increased for the peripheral volumes of Fourier space to capture the higher-frequency components and reduced toward the center to limit saturation (Johnson et al., 2007). Data were acquired with five protocols, the details of which are included in Table 1. The data were fully (Nyquist) sampled along both phase axes to support the spatial resolution as listed in Table 1. Data were reconstructed in a dedicated offline reconstruction engine designed to handle the large image arrays. The T2 data, acquired with a Carr-Purcell-Meiboom-Gill (CPMG) sequence, resulted in eight separate 3D (512 × 256 × 256) arrays with TE ranging from 7.5 ms to 60 ms. These were post-processed using the multi-echo Fourier encoding method that has been described previously (Ali Sharief and Johnson, 2006; Yang et al., 1999). The subsequent T2-weighted 3D array (43 µm) at 512 × 2562 was interpolated to a 1024 × 5122 array producing a single data collection for each specimen with three registered 1024 × 5122 image arrays. For ease of reference, we refer to the three separate protocols as HiResT1 – at 21.5 µm resolution; HiResT2 – at 43 µm, interpolated to 21.5 µm; and HiResT2* – at 21.5 µm.
Table 1.
Summary of acquisition parameters for MRH data.
| Protocol | Acquisition matrix |
Display matrix |
Resolution | Sequence | TR ms |
TE ms |
|---|---|---|---|---|---|---|
| HiResT1 | 768×512×512 | 1024×512×512 | 21.5 µm3 | SE1 | 50 | 5.1 |
| HiResT2 | 512×256×256 | 1024×512×512 | 43 µm3 | CPMG2 | 300 | 7.5–60 |
| HiResT2* | 768×512×512 | 1024×512×512 | 21.5 µm3 | GE3 | 50 | 4.3 |
| LoResT1 | 512×256×256 | 512×256×256 | 43 µm3 | SE | 50 | 5.1 |
| LoResT2* | 512×256×256 | 512×256×256 | 43 µm | GE | 50 | 4.3 |
RF refocused spin echo (SE).
Carr–Purcell–Meiboom–Gill (CPMG), multi-echo.
Gradient Echo (GE), alpha=45°.
Conventional histology was performed on seven of the specimens. When the MR acquisition was completed, the brains were carefully removed from the skull and transferred to 10%, then 20%, and finally 30% sucrose in fixative. In each case, the tissue was left to sink before transfer. The brains were frozen, with the ventral surface placed on a plate, by immersion in isopentane cooled by a surrounding bath of dry-ice methanol slush. Brains were stored at −80°C until cut.
Brains were cut along the horizontal plane on Leica CM3500 cryostat (Leica Microsystems Inc. Bannockburn, IL). To minimize distortion, a commercial tape support system (Instrumedics, Inc., Richmond, IL) was used (Nissanov et al., 2001). Nominal section thickness was set to 21 µm. All sections were collected. Sections were stained for Nissl substance, as previously described (Nissanov et al., 2001), and were subsequently photographed with a Canon 1ds MkII SLR with a Canon 65MPE 1–5X macro lens to yield a pixel pitch of 9.9 µm.
A previously published approach to tissue reconstruction (Nissanov et al., 2006) was followed. Briefly, blockface images acquired prior to each cutting stroke were targets for moments-based rigid body alignment of each corresponding section. This yields a rough alignment of sectional images. Refinement was then achieved by section-to-section alignment using Automated Image Registration (AIR) software (http://bishopw.loni.ucla.edu/AIR5/) (Woods et al., 1998). Satisfactory results required multiple runs with initial position adjustments. Subsequent brains were registered using section-to-section rigid-body registration using the technique developed by Thévenaz et al. (Thévenaz et al., 1998) and implemented as an ImageJ plugin (http://rsbweb.nih.gov/ij/). Here too, satisfactory results required interactive correction on some sections.
The reconstructed volumes were aligned to their corresponding MR volumes using a two-step approach: 1) The volumes (Nissl) are aligned using a multi-resolution, non-deformable process composed of a quaternion transform followed by an affine transform. This registration step brings both volumes into the same scale and compensate for any possible translations or rotations between them. 2) The registration is refined using a multi-resolution diffeomorphic registration algorithm to align corresponding structures through deformation (Avants et al., 2008). Mutual information is the metric of choice both for the non-deformable and the deformable steps. The routines for this approach are implemented in the National Library of Medicine (NLM)-funded Insight Segmentation and Registration Toolkit (ITK) (http://www.itk.org).
A total of 55 3D datasets are available for download at (http://www.civm.duhs.duke.edu/WHS). A summary of all the data is available in Table 3. A single “canonical (C) set” was chosen as representative of the high-resolution protocol to provide the target volume for the WHS coordinate system. The set consisted of CT1, CT2, and CT2*, i.e. the high-resolution protocols (Table 1) of the same specimen all registered to the same space, since the specimen had not been moved between acquisition of the three different arrays. As noted above, CT2 was interpolated by 2 times in each direction to match the 21.5-micron resolution of the CT1 and CT2* images. CNissl is the Nissl data from the same specimen.
Table 3.
Summary of datasets available online (http://www.civm.duhs.duke.edu/WHS).
| Data | Array | Resolution (µm) |
Description |
|---|---|---|---|
| CT1 | 5122×1024 | 21.5 | Canonical hi-resolution T1-weighted |
| CT2 | 5122×1024 | 43 | Canonical hi-resolution T2-weighted |
| CT2* | 5122×1024 | 21.5 | Canonical hi-resolutionT2*-weighted |
| CNissl | 5122×1024 | 21.5 | Canonical Nissl histology |
| CLabel | 5122×1024 | 21.5 | Canonical 37 labels |
| SSCT1 | 5122×1024 | 21.5 | Skull-stripped hi-resolution T1 |
| SSCT2 | 5122×1024 | 43 | Skull-stripped hi-resolution T2 |
| SST2* | 5122×1024 | 21.5 | Skull-stripped hi-resolution T2* |
| SSLT1 | 2562×512 | 43 | Skull-stripped low-resolution T1 |
| SSLT2 | 2562×512 | 43 | Skull-stripped low-resolution T2 |
| SSLT2* | 2562×512 | 43 | Skull-stripped low-resolution T2* |
| AT1 | 5122×1024 | 21.5 | Average hi-resolution T1-weighted |
| AT2 | 5122×1024 | 43 | Average hi-resolution T2-weighted |
| AT2* | 5122×1024 | 21.5 | Average hi-resolution T2*-weighted |
| MLA | 5122×1024 | 21.5 | Maximum likelihood labels based on affine transform alignment |
| MPALabels | 5122×1024 | 21.5 | Probability (0–100:14) for the MLA label based on affine alignment for the label |
| AP: Amy-Th | 5122×1024 | 21.5 | Probability (0–100:14) that the pixel is the structure based on affine alignment |
| MLD | 5122×1024 | 21.5 | Maximum likelihood labels based on diffeomorphic alignment |
| MPDLabels | 5122×1024 | 21.5 | Probability (0–100:14) for MLD label based on diffeomorphic alignment |
| DP:Amy-Th | 5122×1024 | 21.5 | Probability (0–100:14) that the pixel is the structure based on diffeomorphic alignment |
Thirty-seven structures were manually labeled using the three different MR image sets (CT1, CT2, and CT2*). The data were centered, oriented in a flat skull position to present symmetrical hemispheres. The reconstructed volumes were converted into Neuroimaging Informatics Technology Initiative (NIfTI) format (http://nifti.nimh.nih.gov/nifti-1). The origin has been set with reference to the anterior commissure (AC), at the intersection between the mid-sagittal plane, a coronal plane passing midway (rostro-caudal) through the anterior and posterior branches of AC, and a level where the fornix commissure is clearly visible as an inverted V shape, and a horizontal plane passing midway through the most dorsal and ventral aspect of the AC, visible in the high-resolution MR images as a distinct line.
Manual tracings of 37 structures were performed using Amira software (version 5.2.1) (Mercury Computer Systems, Inc., Chelmsford, MA) in all three cardinal planes to ensure continuity and smoothness of the structures. The structures include components in both the left and right hemispheres where applicable. 3D morphology operations were used to smooth the final contours. The labeling was facilitated by the different contrast in each of the 3D arrays. CT1 was preferred for delineating the ventricular system, most gray matter structures, and in particular, for white matter structures, with additional help from the CT2*. CT2 was useful, especially for the delineation of nuclei such as substantia nigra, anterior pretectal, deep mesencephalic, laterodorsal thalamic, and ventral thalamic.
Also scanned were 13 additional specimens, using the same three MR protocols. Six of these specimens were processed for Nissl histology. A total of 14 specimens (the canonical set plus the additional 13 brains) were used for creating a series of additional atlases. All the data were processed to remove the skull, using an algorithm that we have described previously (Badea et al., 2007). This first step improves the registration processes. The skull-stripped (SS) canonical sets are available as SSCT1, SSCT2, and SSCT2* (see Table 3). All the registrations were performed using the Advanced Normalization Tools (ANTS), (Avants et al., 2008). The first set of atlases was generated by aligning each brain to the canonical templates (SSCT1 and SSCT2) using global (rigid and affine) transforms to maximize mutual information in the two target datasets (SSCT1 and SSCT2). The differential contrast provided by the T1-weighted and T2-weighted images provides complementary information that improves the registration. The inverse transformations were applied to the labels to provide a label set for each of the new (non-canonical) specimens. The labels from all 14 datasets were then used to compute the probability that any given voxel belonged to one of the 37 labeled structures. This probability was mapped to a value between 0 and 100. Since there are 14 specimens, the increment for the distribution was in units of 100/14=7.1. This approach is particularly useful to determine the variability of size and shape for the structures across the collection. A maximum likelihood labeling atlas (MLA; see Table 3), in which each voxel includes the label identifier for which the probability is the maximum is included, as well as a complementary atlas (MPALabels) which includes the maximum probability map for all segmented structures. Additional 37 datasets are derived in which each resulting atlas includes the probability density map for each of the individual structure. The naming convention for this data (see Table 3) is “label abbreviation A,” where the label abbreviations for the structure are given in Table 2 and “A” refers to the fact that the labels were derived using the affine transform.
Table 2.
Summary of color-coded labeled structures and volumes of those structures.
| Structure | Volume (mm3) | Structure | Volume (mm3) |
|---|---|---|---|
 Whole brain Whole brain |
532.00 |
 Interpeduncular nucleus Interpeduncular nucleus |
0.33 |
 Amygdala Amygdala |
13.87 |
 Lateral dorsal nucleus of thalamus Lateral dorsal nucleus of thalamus |
0.68 |
 Anterior commissure Anterior commissure |
0.79 |
 Lateral geniculate Lateral geniculate |
1.49 |
 Anterior pretectal nucleus Anterior pretectal nucleus |
0.94 |
 Lateral lemniscus Lateral lemniscus |
0.81 |
 Aqueduct Aqueduct |
0.18 |
 Lateral septal nuclei Lateral septal nuclei |
5.43 |
 Brainstem (remainder) Brainstem (remainder) |
77.09 |
 Medial geniculate Medial geniculate |
0.97 |
 Cerebellum Cerebellum |
60.10 |
 Nucleus accumbens Nucleus accumbens |
4.10 |
 Cerebral cortex Cerebral cortex |
184.36 |
 Olfactory areas Olfactory areas |
31.39 |
 Cerebral peduncle Cerebral peduncle |
1.48 |
 Optic tract Optic tract |
0.65 |
 Cochlear nuclei Cochlear nuclei |
1.35 |
 Periaqueductal gray Periaqueductal gray |
4.87 |
 Corpus callosum Corpus callosum |
12.70 |
 Pineal gland Pineal gland |
0.09 |
 Deep mesencephalic nuclei Deep mesencephalic nuclei |
3.00 |
 Pontine gray Pontine gray |
1.72 |
 Fimbria Fimbria |
2.51 |
 Spinal trigeminal tract Spinal trigeminal tract |
0.93 |
 Fornix Fornix |
0.40 |
 Striatum Striatum |
27.99 |
 Globus pallidus Globus pallidus |
2.63 |
 Substantia nigra Substantia nigra |
2.01 |
 Hippocampus Hippocampus |
31.44 |
 Superior colliculus Superior colliculus |
10.71 |
 Hypothalamus Hypothalamus |
9.15 |
 Thalamus (remainder) Thalamus (remainder) |
20.04 |
 Inferior colliculus Inferior colliculus |
6.39 |
 Ventral thalamic nuclei Ventral thalamic nuclei |
3.86 |
 Internal capsule Internal capsule |
2.12 |
 Ventricular system Ventricular system |
3.53 |
An additional set of atlases was created by realigning the T1 and T2 arrays for each brain, after affine transform back to the target data (SSCT1 and SSCT2) using diffeomorphic registration, again using multivariate (T1 and T2) maximization of mutual information. The inverse transforms were applied to register the labels from the canonical arrays back onto each of the additional 13 specimens after this diffeomorphic registration. A second maximum likelihood labeling atlas was generated (MLD - see Table 3) in which each voxel represents the label for which the probability was the maximum. The complementary array (MPDLabels) includes the value of the probability for the label. And as before, a complete set of 37 atlases “label abbreviation D” is included, which represents the entire probability distribution (DP) for the label derived from the combined global and diffeomorphic registration.
Finally, the transforms derived from the combined global and diffeomorphic registration have been applied to the three MR images for each dataset. The resulting arrays have been averaged (A) to yield higher contrast-to-noise structural images (AT1, AT2, and AT2*).
Distribution
Distribution of this data is challenging, since each complete dataset (3MR+Nissl+labels) is ~ 2 GB. In addition, duplicates represent useful intermediate stages for processing. For example, we provide, a version of the canonical set, which has been skull-stripped to provide a better starting point for users interested in diffeomorphic mapping. We have provided downsampled versions of the canonical set (at 43-micron isotropic resolution) where the multiple (5 for each specimen) 2562 × 512 arrays can be accommodated in computers with smaller memories. The data is provided in two formats—a NIfTI format that includes the reference headers and calibration data, and data packaged with the Mouse Biomedical Informatics Research Network (MBIRN) atlasing toolkit (MBAT) (http://mbat.loni.ucla.edu/) viewer, a multi-dimensional viewer designed to accommodate just the sort of data shown here. The data is freely available at both the Duke Center for In Vivo Microscopy web site (http://www.civmspace.duke.edu/WHS) and the INCF website (http://www.incf.org/) (search on “Waxholm Space”).
Results
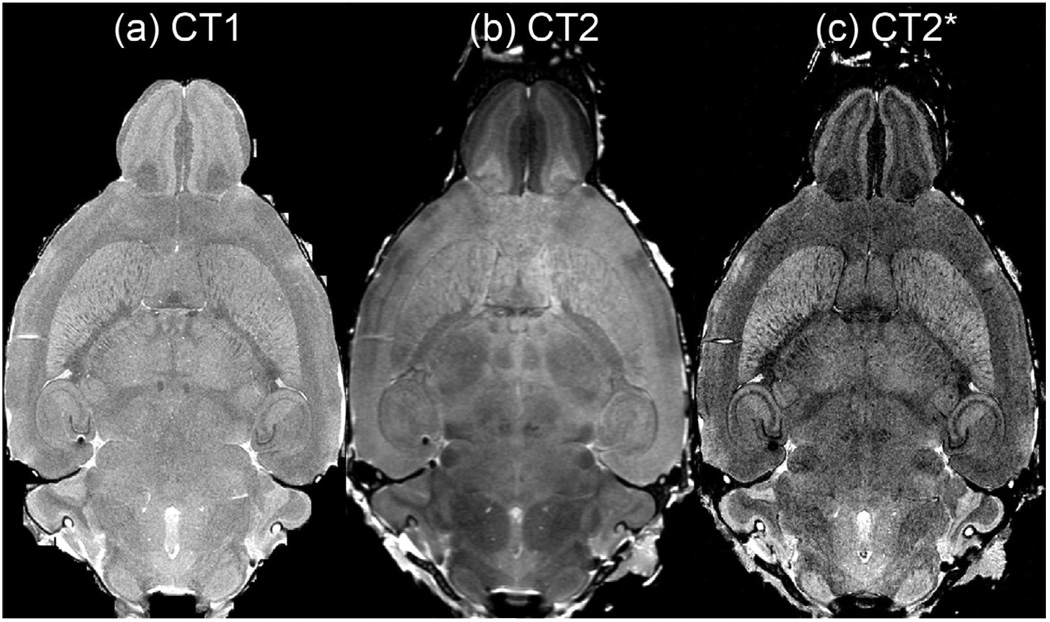
Figure 1 shows corresponding dorsal sections through the three canonical image sets (CT1, CT2, and CT2*). While the T1-weighted and T2*-weighted images can distinguish among cortical layers and large gray mater structures, as well as thin fiber tracts, additional information provided by the T2 scan can help accurately delineate thalamic and brainstem nuclei. The T2* images provide enhanced contrast for white matter fibers, small blood vessels, as well as a number of cytoarchitectonic domains (e.g. entorhinal cortex, pyriform cortex, and individual layers within the allocortex and isocortex).
Figure 1.
The same dorsal plane is shown from (a) CT1, (b) CT2, and (c) CT2* with each different acquisition highlighting different cytoarchitecture.
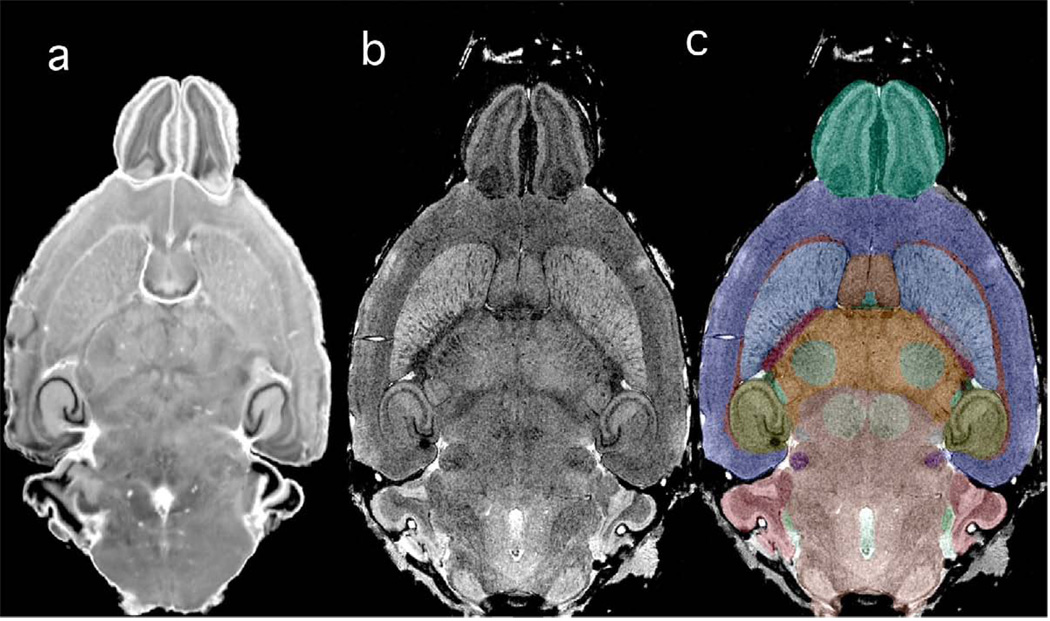
Figure 2 shows the remainder of the canonical set at the same dorsal level: CNissl–the Nissl section, CT2*–the T2* image from Figure 1c for reference. The contrast of the Nissl volume corresponds well with that of the CT2* (Figure 2b) particularly in prominent areas of low signal intensity, e.g. the granular cell layer of the dentate gyrus (GrDG) of the hippocampus, an area of high cellular density, but nearly devoid of myelin. The lower-density areas of pyramidal cells in the cornu ammonis (CA) regions appear more intense in comparison with the granule cell layer. Low signal intensity is seen also in areas of high myelin content, such as layer 4 of the cortex. These findings are in good agreement with human studies (Fatterpekar et al., 2002). Finally, Figure 2c shows the labeled structures (CLabels). The segmented structures are presented using a color-coding scheme, which allows easy distinction between neighboring regions in all three planes. The color scheme is summarized in Table 2.
Figure 2.
The same dorsal plane as shown in Figure 1 is displayed with (a) the matching Nissl volume; (b) CT2*; and (c) CT2* with labels superimposed. There is good correspondence between the Nissl and CT2* image.
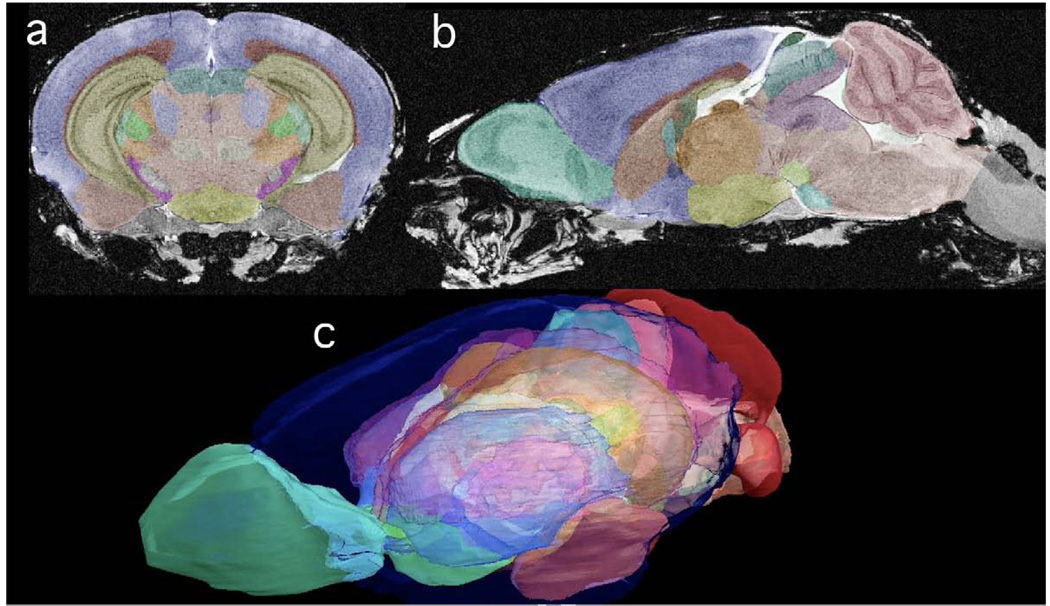
All of the data is isotropic—i.e. the data can be viewed along any arbitrary plane without loss of resolution. Two of the cardinal planes are shown in Figure 3a and 3b, but all three have been used to generate the manual segmentation. These segmented structures range in size from the smallest, of 0.09 mm3 for the pineal gland and 0.33 mm3 for the interpeduncular nucleus, to 1.50 mm3 for the lateral geniculate nuclei; to medium-sized structures such as the periaqueductal gray (4.87 mm3), nucleus accumbens (4.10 mm3); to larger ones such as the hippocampus (31.44 mm3) or cerebellum (60.10 mm3). The 3D surface rendering (Figure 3c) facilitates understanding of the relative spatial positions, size, as well as shape of these structures. The segmentation of white matter structures gives insight into the connectivity among major structures.
Figure 3.
All the MR data are isotropic. Thus, there is no loss of resolution between (a) the coronal plane and (b) the sagittal plane of CT2*. The color labels superimposed in (a) and (b) can be seen as transparent surfaces demonstrating the 3D juxtaposition of structure in the volume rendered image in (c). The key for the labels is included in Table 2.
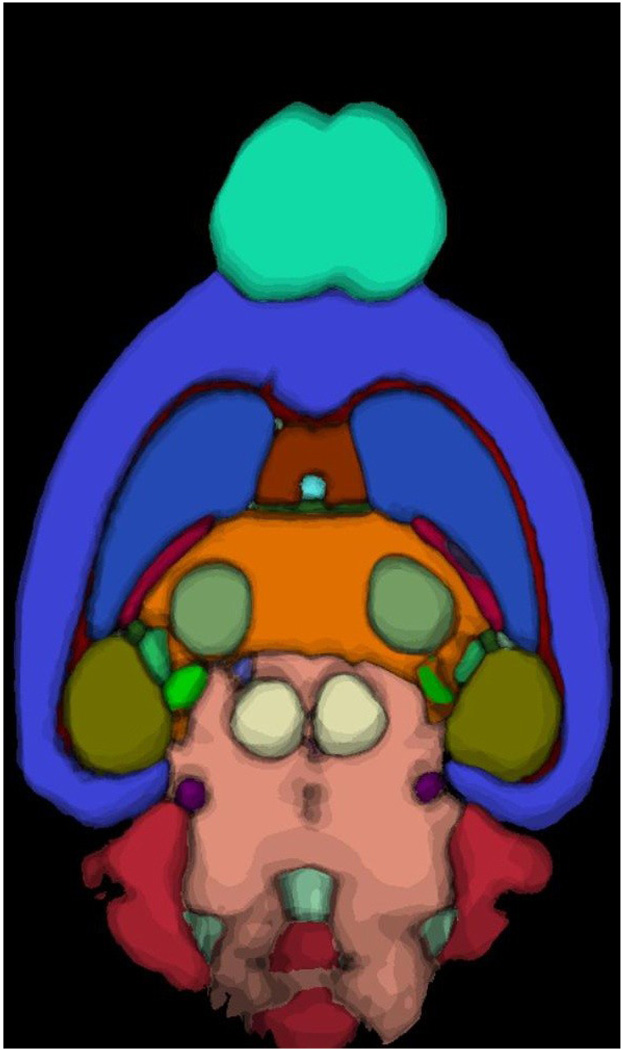
Figure 4 shows an example from the maximum likelihood labeling atlas (MLA) obtained through the global registration process. The shaded contours represent the maximum probability (MPALabels) of the occurrence of the structure of the similar color. The global registration and resulting maximum likelihood map allow one to appreciate the variability in the population. For example, the contours in the darkest (olive) green in the boundary of the hippocampus suggest a fair degree of variation across the population (of the 14 specimens included in the atlas), while the shade of the color gives the probability for the occurrence of the structure at that location. There is very little variation in the dark red/brown of the corpus callosum, so the boundary is well defined.
Figure 4.
A dorsal slice from MLA shows the maximum likelihood labeling for each pixel in the image. Pixels are color-coded, so the color defines the structure for which the pixel has the highest probability. The shading of the colors depicts the fact that the maximum probability at the boundary between structures decreases as one moves across the boundary.
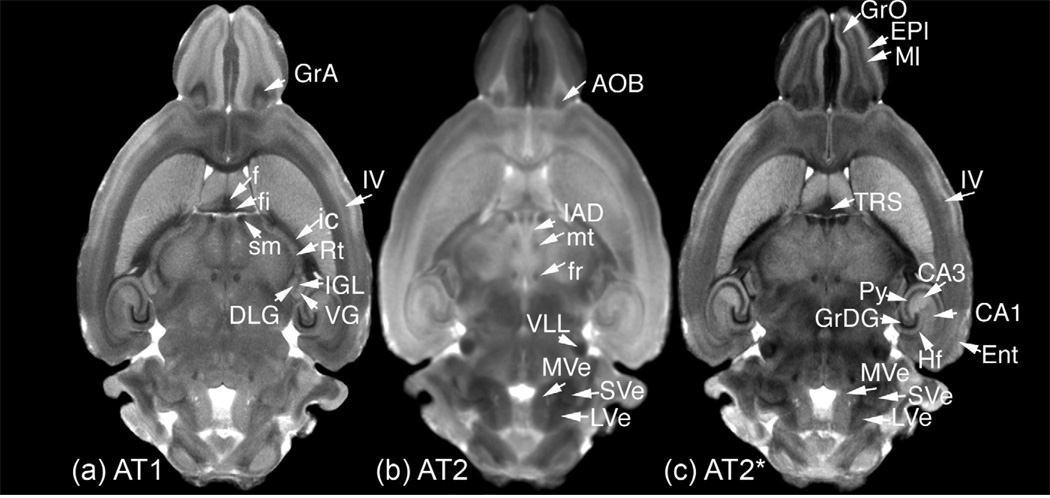
Figure 5 shows corresponding dorsal slices from each of the average volumes (AT1, AT2, and AT2*) and their relative advantages for the detection of detailed anatomical features. From the most-rostral to the most-caudal brain structures, the three types of scans emphasize different features and complement each other. All three images present a clear representation for the concentric layers of fibers and cells in the olfactory bulbs; the cellular layers are best seen in AT2*, and AT1 images, e.g. the mitral cell layer (MI) among the external (EPl) and internal plexiform layers (IPl) in AT1 and AT2*, while the accessory olfactory bulb (AOB) is best seen in the T2-weighted image. From the septofimbrial complex, the triangular septal nucleus (TRS) is identifiable in AT2, but clearly seen in AT2* and AT1, where one can individually discern the fimbria from the rest of the fornix. AT1 and AT2* provide excellent contrast emphasizing cortical layers. For example, Layer IV (Figure 5a, 5c) appears as a hypointense lamina, against the Layer V, which is hyperintense. The same images provide a clear distinction among layers characterized by different cell densities, such as the dark-stained, densely populated, granular layer of the dentate gyrus (GrDG), and the less hypointense, less densely populated, pyramidal layer (Py), which spans across the CA1, CA2, and CA3 hippocampal subfields. A brighter area in the hippocampus can be seen in both AT1 and AT2, corresponding to the CA3 area in the cornus ammonis. This bright area has unmyelinated, Zn-rich, mossy fibers, compared to the partly myelinated fibers of area CA1. In addition, AT2 allows one to identify the hippocampal fissure. The hyperintense nature of the entorhinal cortex (Ent) makes is clearly distinguishable in AT2*.
Figure 5.
The high contrast-to-noise-ratio provided in the average images: (a) AT1, (b) AT2, and (c) AT2* allow identification of a number of structures. Granule cell layers stand out in AT1 and AT2* as dark regions in the olfactory bulb (GrO - granular olfactory bulb, GrA - granular accessory olfactory), and hippocampus (GrDG - granular dentate gyrus). In contrast to GrDG, the pyramidal cell layer (Py) of the hippocampus appears less hypointense. A distinction between the CA1 (hypointense) and CA3 (hyperintense) areas of the hippocampus is most evident in the AT2*, but can also be seen in the AT1. White matter fibers such as fimbria (fi), fornix (f), fasciculus retroflexus (fr), internal capsule (ic), and stria medullaris (sm) are identified easily in the AT1. The mammillary tract is visible in the AT2. Thalamic (IAD - interanterodorsal, Rt - reticular, SG - suprageniculate, VG - ventral geniculate, DLG - dorsal lateral and IGL intrageniculate lamina) and hindbrain (MVE - medial-vestibular and LVE - lateral-vestibular) nuclei are best seen in AT2, as well as the nuclei of the lateral lemniscus (VLL - ventral nuclei of the lateral lemniscus) the accessory olfactory bulb (AOB). TRS - triangular septal nucleus, however, is best seen in the T2s. Differences in cell types, density, and myelination identify distinct areas of the cortex such as ENT- the entorhinal cortex, and individual layers, such as EPl - the external plexiform layer, MI - mitral cell layers in the olfactory areas, or Layer IV in the neocortex.
Within the thalamus, one can identify in both AT1 and AT2* regions as small as the anterodorsal (AD) and subdivisions as the interanterodorsal (IAD); the lateral geniculate and the intergeniculate leaf (IGL), cradled between the ventral (VGL) and dorsal geniculate (DGL). The high contrast in AT2 allows one to discriminate even the thin optic tract lining the lateral aspect of the geniculate nuclei. While it is difficult to determine the boundaries between these regions in (lower-resolution) AT2, one can distinguish in AT2 scan homogenous regions characterized by different gray levels corresponding to various cell types, fibers, and their density. Such an example is the reticular nucleus (Rt) of the thalamus, with evident borders in AT1, but in AT2, appears as a distinct region with homogenous gray values. The high contrast in the AT2 allows a clear demarcation between the Rt and the hypointense internal capsule (ic).
In the midbrain, the ventral nucleus of the lateral lemniscus is best identified in AT2, but is also visible in AT2*, although it can be hardly be identified in AT1. Also, hindbrain nuclei are best shown in AT2, including the vestibular nuclei, with distinct demarcations of the medial (MVE) and lateral vestibular nuclei (VLE).
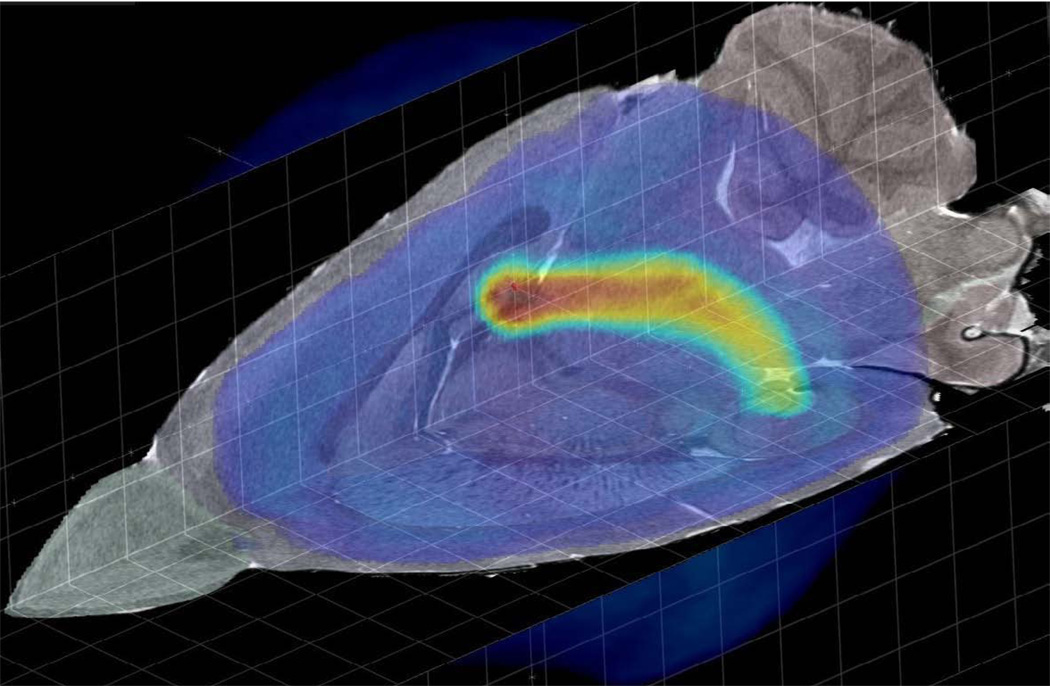
The fundamental goal of WHS is to allow collaboration across data types from multiple sites. Figure 6 shows a representative example in which gene expression data from the Allen Brain Atlas has been mapped to WHS and placed on CT1 to demonstrate the expression pattern relative to the anatomy, as defined by this specific MR (CT1) acquisition.
Figure 6.
CT1 is shown texture-mapped on to orthogonal slicing planes. The light-blue color overlay is the label for the whole brain. The blue-orange-yellow color overlay is an Allen Brain Atlas gene expression correlation map (AGEA: http://mouse.brain-map.org/agea) rendered by maximum intensity projection. The AGEA seed voxel was chosen in Waxholm Space by navigating CT1 to a subfield where the hippocampus is clearly visible. The coordinates were transformed to Allen Brain Atlas (ABA) space, the corresponding correlation volume requested from the ABA web service, and the returned volume transformed back to Waxholm Space for viewing. (Courtesy of Chris Lau, Allen Brain Institute)
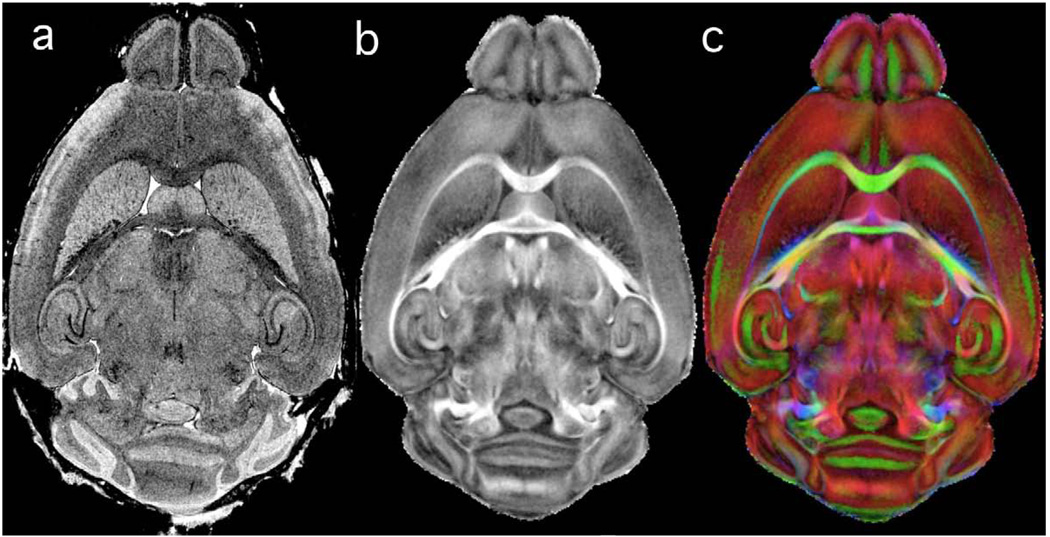
Mapping data from other MR data into WHS can be facilitated through the use of an alignment image. This approach has been taken recently by (Jiang and Johnson, 2010) to produce a diffusion tensor image (DTI) of the mouse aligned to WHS. Computation of the DTI volume (2562 × 512 at 43 µm) requires acquisition of at least 7 different 3D arrays with differing gradient combinations. Jiang acquired an additional image set with the LoResT2* protocol without moving the specimen. Since the contrast matches that of CT2* and AT2*, the alignment derived from maximizing the mutual information is excellent. The transformations were then applied to the DTI arrays. The diffusion images provide insight into quantitative parameters such as fractional anisotropy (FA) (Figure 7b), and also allow differentiation of white matter tracts based on their FA values and their spatial orientation. Color-coding can be used to emphasize the three main directions to which a white mater tract can align (Figure 7c).
Figure 7.
As new types of MR data become available, they can be efficiently mapped into WHS through the use of an alignment protocol, i.e. a dataset acquired with either LoResT1 or LoResT2* (Table 1). The T2*-weighted image in (a) was acquired prior to the acquisition of the multiple scans required for calculating diffusion tensor imaging (DTI)—see (Jiang and Johnson, 2010). The DTI data in (Jiang and Johnson, 2010) was aligned to WHS, thus expanding the space with the inclusion of (b) fractional anisotropy and color-coded eigenvalues. The low-resolution gradient-recalled echo (GRE) protocol (LoResT2* - Table 1) can be acquired in < 1 hour.
Discussion
The human brain project demonstrated the utility of post-mortem MR and CT scans to generate human brain atlases (Mazziotta et al., 2001). Several groups have now developed MR atlases of the mouse using widely varying protocols at widely varying spatial resolution, with brains both in and out of the cranium (Benveniste et al., 2000; Dhenain et al., 2001; Kovacevic et al., 2005; Ma et al., 2005; MacKenzie-Graham et al., 2004 ; Mackenzie-Graham et al., 2007; Badea et al., 2007; Dorr et al, 2008). The resolution in these atlases ranges from 156 µm3 (3 nl) down to 32 µm3 (33 pl). The data presented here at 21.5 µm3 (10 pl) are, to the best of our knowledge, the highest resolution data yet acquired. As noted in the introduction to this paper, WHS is both a real and a conceptual space. A critical differentiator of WHS is our commitment and that of the INCF to maintain WHS as a dynamic repository. The image sets listed in Table 3 are only the start. We have supplied online at the INCF website best practice procedures to allow users to align their MR and optical histology images. As new data (for example, DTI, vascular, gene expression) become available, they will be aligned to WHS and added to the web archive. The definition of regions and their boundaries will most certainly continue to spark discussion among investigators. As others download and explore these data, new structural delineations will be generated, which will also be added to WHS. A sister group to the digital atlasing task force that gave rise to WHS is already active in rationalizing nomenclature. The dimensionality of the space will grow. New tools for examining this rich space will be made available. No single atlas will address the wide range of studies even now under way. The gold standard will continue to change. By using MR histology as a common denominator to define WHS, we hope to be able to accommodate that change.
Acknowledgements
All MR imaging was performed at the Duke Center for In Vivo Microscopy, an NCRR national Biomedical Technology Research Center (P41 RR005959) and NCI Small Animal Imaging Resource Program (U24 CA092656). Additional support was supplied by the Mouse Biomedical Informatics Research Network (MBIRN) (U24 RR021760) and the International Neuroinformatics Coordinating Facility (INCF) (http://www.incf.org). We are grateful to Dr. Brian Avants for his help in tuning the registration process, Sally Gewalt MS for technical assistance, and Sally Zimney MEd for editorial assistance.
Footnotes
Publisher's Disclaimer: This is a PDF file of an unedited manuscript that has been accepted for publication. As a service to our customers we are providing this early version of the manuscript. The manuscript will undergo copyediting, typesetting, and review of the resulting proof before it is published in its final citable form. Please note that during the production process errors may be discovered which could affect the content, and all legal disclaimers that apply to the journal pertain.
References
- Ali Sharief A, Johnson GA. Enhanced T2 contrast for MR histology of the mouse brain. Magnetic Resonance in Medicine. 2006;56:717–725. doi: 10.1002/mrm.21026. [DOI] [PubMed] [Google Scholar]
- Avants BB, Epstein CL, Grossman M, Gee JC. Symmetric diffeomorphic image registration with cross-correlation: evaluating automated labeling of elderly and neurodegenerative brain. Med Image Anal. 2008;12:26–41. doi: 10.1016/j.media.2007.06.004. [DOI] [PMC free article] [PubMed] [Google Scholar]
- Badea A, Ali-Sharief A, Dale AM, Johnson GA. Morphometric analysis of the C57BL/6J mouse brain. Neuroimage. 2007;37:683–693. doi: 10.1016/j.neuroimage.2007.05.046. [DOI] [PMC free article] [PubMed] [Google Scholar]
- Benveniste H, Kim K, Zhang L, Johnson GA. Magnetic resonance microscopy of the C57BL mouse brain. Neuroimage. 2000;11:601–611. doi: 10.1006/nimg.2000.0567. [DOI] [PubMed] [Google Scholar]
- Boline J, Lee EF, Toga AW. Digital atlases as a framework for data sharing. Front Neurosci. 2008;2:100–106. doi: 10.3389/neuro.01.012.2008. [DOI] [PMC free article] [PubMed] [Google Scholar]
- Boline J, Hawrylycz M, Williams R. Workshop report: 1st INCF Workshop on Mouse and Rat Brain Digital Atlasing Systems; 2007. Available from Nature Precedings < http://dx.doi.org/10.1038/npre.2007.1046.1>. [Google Scholar]
- Dhenain M, Ruffins SW, Jacobs RE. Three-dimensional digital mouse atlas using high-resolution MRI. Developmental Biology. 2001;232:458–470. doi: 10.1006/dbio.2001.0189. [DOI] [PubMed] [Google Scholar]
- Dorr AE, Lerch JP, Spring S, Kabani N, Henkelman RM. High resolution three-dimensional brain atlas using an average magnetic resonance image of 40 adult C57Bl/6J mice. Neuroimage. 2008;42:60–69. doi: 10.1016/j.neuroimage.2008.03.037. [DOI] [PubMed] [Google Scholar]
- Fatterpekar GM, Naidich TP, Delman BN, Aguinaldo JG, Gultekin SH, Sherwood CC, Hof PR, Drayer BP, Fayad ZA. Cytoarchitecture of the human cerebral cortex: MR microscopy of excised specimens at 9.4 Tesla. AJNR Am J Neuroradiol. 2002;23:1313–1321. [PMC free article] [PubMed] [Google Scholar]
- Ghosh P, O'Dell M, Narasimhan PT, Fraser SE, Jacobs RE. Mouse lemur microscopic MRI brain atlas. Neuroimage. 1994;1:345–349. doi: 10.1006/nimg.1994.1019. [DOI] [PubMed] [Google Scholar]
- Jiang Y, Johnson GA. Microscopic diffusion tensor imaging of the mouse brain. Neuroimage. 2010;50:465–471. doi: 10.1016/j.neuroimage.2009.12.057. Supplement: www.civm.duhs.duke.edu/neuro200902/index.html. [DOI] [PMC free article] [PubMed] [Google Scholar]
- Johnson GA, Ali-Sharief A, Badea A, Brandenburg J, Cofer G, Fubara B, Gewalt S, Hedlund LW, Upchurch L. High-throughput morphologic phenotyping of the mouse brain with magnetic resonance histology. Neuroimage. 2007;37:82–89. doi: 10.1016/j.neuroimage.2007.05.013. [DOI] [PMC free article] [PubMed] [Google Scholar]
- Johnson GA, Benveniste H, Black RD, Hedlund LW, Maronpot RR, Smith BR. Histology by magnetic resonance microscopy. Magnetic Resonance Quarterly. 1993;9:1–30. [PubMed] [Google Scholar]
- Kovacevic N, Henderson JT, Chan E, Lifshitz N, Bishop J, Evans AC, Henkelman RM, Chen XJ. A three-dimensional MRI atlas of the mouse brain with estimates of the average and variability. Cereb Cortex. 2005;15:639–645. doi: 10.1093/cercor/bhh165. [DOI] [PubMed] [Google Scholar]
- Ma Y, Hof PR, Grant SC, Blackband SJ, Bennett R, Slatest L, McGuigan MD, Benveniste H. A three-dimensional digital atlas database of the adult C57BL/6J mouse brain by magnetic resonance microscopy. Neuroscience. 2005;135:1203–1215. doi: 10.1016/j.neuroscience.2005.07.014. [DOI] [PubMed] [Google Scholar]
- MacKenzie-Graham A, Lee EF, Dinov ID, Bota M, Shattuck DW, Ruffins S, Yuan H, Konstantinidis F, Pitiot A, Ding Y, Hu G, Jacobs RE, Toga AW. A multimodal, multidimensional atlas of the C57BL/6J mouse brain. J Anat. 2004;204:93–102. doi: 10.1111/j.1469-7580.2004.00264.x. [DOI] [PMC free article] [PubMed] [Google Scholar]
- Mackenzie-Graham AJ, Lee EF, Dinov ID, Yuan H, Jacobs RE, Toga AW. Multimodal, multidimensional models of mouse brain. Epilepsia. 2007;48 Suppl 4:75–81. doi: 10.1111/j.1528-1167.2007.01244.x. [DOI] [PMC free article] [PubMed] [Google Scholar]
- Mazziotta J, Toga A, Evans A, Fox P, Lancaster J, Zilles K, Woods R, Paus T, Simpson G, Pike B, Holmes C, Collins L, Thompson P, MacDonald D, Iacoboni M, Schormann T, Amunts K, Palomero-Gallagher N, Geyer S, Parsons L, Narr K, Kabani N, Le Goualher G, Feidler J, Smith K, Boomsma D, Hulshoff Pol H, Cannon T, Kawashima R, Mazoyer B. A four-dimensional probabilistic atlas of the human brain. J Am Med Inform Assoc. 2001;8:401–430. doi: 10.1136/jamia.2001.0080401. [DOI] [PMC free article] [PubMed] [Google Scholar]
- Mazziotta JC, Toga AW, Evans AC, Fox PT, Lancaster JL. Digital brain atlases. Trends Neurosci. 1995;18:210–211. doi: 10.1016/0166-2236(95)93904-c. [DOI] [PubMed] [Google Scholar]
- Mori S, Oishi K, Jiang H, Jiang L, Li X, Akhter K, Hua K, Faria AV, Mahmood A, Woods R, Toga AW, Pike GB, Neto PR, Evans A, Zhang J, Huang H, Miller MI, van Zijl P, Mazziotta J. Stereotaxic white matter atlas based on diffusion tensor imaging in an ICBM template. Neuroimage. 2008;40:570–582. doi: 10.1016/j.neuroimage.2007.12.035. [DOI] [PMC free article] [PubMed] [Google Scholar]
- Newman JD, Kenkel WM, Aronoff EC, Bock NA, Zametkin MR, Silva AC. A combined histological and MRI brain atlas of the common marmoset monkey, Callithrix jacchus. Brain Res Rev. 2009;62:1–18. doi: 10.1016/j.brainresrev.2009.09.001. [DOI] [PMC free article] [PubMed] [Google Scholar]
- Nissanov J, Bertrand L, Tretiak O. Cryosectioning distortion reduction using tape support. Microsc Res Tech. 2001;53:239–240. doi: 10.1002/jemt.1089. [DOI] [PubMed] [Google Scholar]
- Nissanov J, Nertrand L, Geffen S, Bakare P, Kane C, Gross K, Baird D. Cryoplane flouresecence microscopy. Proceedings of the 24th IASTED International Multi-Conference on Biomedical Engineering; Innsbruck, Austria. 2006. pp. 362–366. [Google Scholar]
- Schmahmann JD, Doyon J, McDonald D, Holmes C, Lavoie K, Hurwitz AS, Kabani N, Toga A, Evans A, Petrides M. Three-dimensional MRI atlas of the human cerebellum in proportional stereotaxic space. Neuroimage. 1999;10:233–260. doi: 10.1006/nimg.1999.0459. [DOI] [PubMed] [Google Scholar]
- Schwarz AJ, Danckaert A, Reese T, Gozzi A, Paxinos G, Watson C, Merlo-Pich EV, Bifone A. A stereotaxic MRI template set for the rat brain with tissue class distribution maps and co-registered anatomical atlas: application to pharmacological MRI. Neuroimage. 2006;32:538–550. doi: 10.1016/j.neuroimage.2006.04.214. [DOI] [PubMed] [Google Scholar]
- Thévenaz P, Ruttimann UE, Unser M. A pyramid approach to subpixel registration based on intensity. IEEE Trans Image Process. 1998;7:27–41. doi: 10.1109/83.650848. [DOI] [PubMed] [Google Scholar]
- Woods R, Grafton S, Holmes C, Cherry S, Mazziotta J. Automated image registration: I. general methods and intrasubject, intramodality validation. Journal of Computer Assisted Tomography. 1998;22:139–152. doi: 10.1097/00004728-199801000-00027. [DOI] [PubMed] [Google Scholar]
- Yang QX, Demeure RJ, Dardzinski BJ, Arnold BW, Smith MB. Multiple echo frequency-domain image contrast: improved signal-to-noise ratio and T2(T2*) weighting. Magnetic Resonance in Medicine. 1999;41:423–428. doi: 10.1002/(sici)1522-2594(199902)41:2<423::aid-mrm30>3.0.co;2-m. [DOI] [PubMed] [Google Scholar]


