

Abstract
Lipid-coated metal nanoparticles are developed here as a mimic of low-density lipoprotein (LDL) particles and used to study C-reactive protein (CRP) binding to highly curved lipid membranes. A 12 nm shift in the localized surface plasmon resonance (LSPR) was observed when CRP was added to the lipid-coated gold nanoparticles. Transmission electron microscopy (TEM) revealed that CRP induced a structural change to the lipids, resulting in clusters of nanoparticles. This clustering provides a visualization of how CRP could cause the aggregation of LDL particles, which is a key step in atherosclerosis. The cluster formation and resultant LSPR shift requires the presence of both CRP and calcium. Fluorescence anisotropy, using a CRP-specific, fluorophore-labeled aptamer confirmed that CRP was bound to the lipid-coated nanoparticles. An increase in the fluorescence anisotropy (Δr = +0.261 ± 0.004) of the aptamer probe occurs in the presence of CRP, PC-coated nanoparticles, and calcium. Subsequent sequestration of calcium by EDTA leads to a decrease in the anisotropy (Δr = -0.233 ± 0.011), however, there is no change in the LSPR and no change to the cluster structure observed by TEM. This indicates that CRP binds to the PC membrane on the nanoparticle surface reversibly through a calcium bridging mechanism while changing the underlying membrane structure irreversibly as a result of binding.
Keywords: CRP, gold, LDL, biomimicry, lipid, atherosclerosis
Introduction
An increased level of C-reactive protein (CRP) in serum is an indication of inflammation that has been linked to stroke, death, and myocardial infarction.1 Pentameric CRP has five subunits, each with a lipid recognition site that binds to phosphatidylcholine (PC) through two calcium ions resulting in multivalent binding to lipid membranes.2,3 CRP binds to PC on the surface of low density lipoprotein (LDL) particles, enhancing the uptake of LDL by macrophages and the formation of foam cells.4 Recently it was discovered that CRP specifically recognizes the oxidized form of LDL.5 CRP causes aggregation of LDL,6 is found in most atherosclerotic plaques,7,8 and both the membrane composition as well as lipid structure play a role in CRP binding.9 However, the mechanism of action of CRP and its role in cardiovascular disease (CVD) is not well understood and reports have alternatively shown both pro- and anti-inflammatory effects for different forms of CRP.9
Supported artificial membranes that mimic biological membranes facilitate the study of protein interactions with lipids.10 These are commonly formed by the deposition of liposomes onto solid surfaces. For example, two-dimensional supported bilayer membranes have been prepared on glass and polymer-coated glass surfaces.11 Micron-sized, lipid-coated silica beads have added a third dimension to mimics of cellular structures.12 In addition, we have recently prepared hybrid bilayer nanoparticles that mimic nanoscale features such as the high membrane curvature present in caveolae and lipoprotein particles.13 Nanoparticle mimics of high density lipoprotein drop (HDL) particles based on gold have been reported and used as imaging agents.14,15 The localized surface plasmon resonance (LSPR) of gold nanoparticles is sensitive to interparticle interactions making this a useful platform for studying biomolecular interactions.16
Here, lipid-coated gold nanoparticles were used to study the interactions of CRP with PC membranes by monitoring changes in the nanoparticle LSPR. A red shift and broadening of the LSPR were observed when CRP was introduced to PC-coated gold nanoparticles. The LSPR shift was dependent on both CRP and calcium. Transmission electron microscopy (TEM) and dynamic light scattering (DLS) revealed that clusters of nanoparticles were formed by the addition of CRP. This CRP induced clustering is similar to the aggregating effect that CRP has on LDL particles that leads to macrophage uptake.6 CRP binding to the lipid-coated nanoparticles was independently confirmed through fluorescence anisotropy measurements using a fluorophore labeled RNA aptamer that binds to CRP.17,18 An increase in anisotropy was observed when CRP bound to the PC-coated gold nanoparticles. A decrease in the anisotropy was observed when EDTA was added, indicating that CRP binding to the PC membrane on the gold surface is calcium dependent and reversible. The methods described here will facilitate further study of how lipid structure influences CRP recognition of membranes and will lead to the development of LSPR and anisotropy-based diagnostics for CRP that take advantage of multivalent PC recognition.
Experimental Methods
Reagents and Buffer Solutions
Aqueous solutions of gold nanoparticles (10 nm) were from Ted Pella. Human CRP in 10 mM Tris at pH 8.0 containing 140 mM NaCl, 0.1% NaN3, and 2.22 mM CaCl2 and 95% L-α-phosphatidylcholine (PC) were from Sigma Aldrich. The CRP aptamer, 5′Cy5-GCCUGUAAGGUGGUCGGUGUGGCGAGUGUGUUAGGAGAGAUUGC-3′ (Cy5RNA) was from Integrated DNA Technologies and stored in 0.1 mM tetrasodium EDTA at -15°C. The aptamer was modified with Cy5 linked to the 5′ terminal residue. 1 M HEPES at pH 6.5 with 0.1% NaN3 used to dilute the gold nanoparticle solutions and a 10 mM HEPES binding buffer at pH 6.5 with 0.1% NaN3 were prepared from RNase free water (Ambion) and all glassware was treated with RNaseZap solution (Ambion) to prevent RNA degradation.
Nanoparticle Preparation (Au-SO-PC-HT)
Sodium oleate (2.2 μL of a 9.3 mM solution) was added to 10 nm gold nanoparticles (1 mL, 0.8 OD at λmax = 519 nm in H2O) and stirred for 20 min. A dry, thin film was formed from a solution of PC (1.1 mg, 1.45 μmol, in 125 μL of CHCl3) in a glass scintillation vial by solvent evaporation under N2. The film was additionally dried under vacuum for at least 12 h prior to re-suspension in 3 mL of 10 mM HEPES at pH 6.5 with 0.1% NaN3 followed by 90 min of sonication.19 From this stock, 45 μL (22.4 nmol of PC) was added to the nanoparticle solution and incubated for 40 min. This mixture was then incubated with 9 nmol of hexanethiol (0.9 μL of a 10 mM solution in ethanol) for 30 min. The solution was adjusted to a final buffer concentration of 10 mM HEPES at pH 6.5 with 0.1% NaN3.
Sample Preparation for Binding Studies
The anisotropy of Cy5RNA (9.2 nM, in 0.1 mM EDTA) was monitored for 15 min in the presence of nanoparticles (in 10 mM HEPES at pH 6.5 with 0.1% NaN3 containing 227 μM CaCl2) at room temperature. This was followed by the addition of CRP (12 μL, 4.17 μM in 10 mM Tris at pH 8.0 containing 140 mM NaCl, 0.1% NaN3, and 2.22 mM CaCl2). The final concentrations of Cy5RNA and CRP were 9.1 nM and 45.5 nM, respectively (in 10 mM HEPES at pH 6.5 with 0.1 mM Tris, 1.34 mM NaCl, 0.01% NaN3, and 0.024 mM CaCl2). The change in fluorescence anisotropy was monitored for 30 min prior to addition of EDTA (1.4 μL of 1M EDTA in 10 mM HEPES with 0.1% NaN3).
Optical Measurements
Fluorescence measurements were performed on a PTI spectrophotometer using Felix32 software. Measurements were taken using a quartz cell at an excitation of 648 nm, an emission of 665 nm, and a 6 nm bandpass on both monochromators. The steady-state anisotropy (r) was calculated from equation 1:
| (1) |
where IVV and IVH are the fluorescence intensities measured, the subscripts indicate the orientation of the excitation and emission polarizers, and G (IHV/IHH) is the wavelength dependent sensitivity of the instrument.20 Reported Δr values are the average of 3 independent samples each averaged over 15 min. Extinction measurements were performed with an Ocean Optics USB2000 UV-visible spectrophotometer using a 1.0 cm path length quartz cell. DLS measurements were performed with an LB-550 particle size analyzer (Horiba Co. Ltd., Japan).
Transmission Electron Microscopy (TEM) Measurements
Samples were prepared by drop casting dilute solutions of nanoparticles onto carbon-coated (300 Å) Formvar films on copper grids (Ted Pella). Transmission electron micrographs were acquired on a Tecnai F-20 FEI microscope using a CCD detector at an acceleration voltage of 200 kV. Images were obtained using samples prepared 15-30 minutes before collecting images. Cluster size analysis and interparticle spacing measurements were performed using ImageJ (NIH) after applying a binary filter to each image using a default threshold setting.
Results and Discussion
Preparation of Lipid-Coated Nanoparticles
Recently, methods have been developed for preparing nanoparticles coated with phospholipid ligand shells.13,21,22 Here we describe a technique for coating nanoparticles using a minimal amount of lipid, reducing the amount of free liposomes that could complicate nanoparticle binding studies. In contrast to our previous route,21 nanoparticle synthesis and lipid coating occur in two separate steps allowing the use of uniform size gold nanoparticles and providing precise and independent control of the core size and lipid coating. A minimal amount of PC was added to form a bilayer on the nanoparticle surface resulting in a nanostructured lipid membrane.
To calculate the minimal amount of lipid necessary to cover nanoparticles of a certain diameter (D) we converted the optical density of the stock solutions to a concentration using Beer's Law and equation 2, where k and a are 3.32 and 10.8, respectively, based on a study of similar nanoparticles.23
| (2) |
The number of entities (N) per mL was determined from equation 3 using Avogadro's number, NA, and the concentration of the nanoparticles, C:
| (3) |
An estimated 453 molecules of PC are required to cover each 10 nm nanoparticle with a single inner leaflet (based on a PC head group size of 69.4 Ų).24 The 14 nm diameter outer leaflet requires approximately 887 additional lipids (for a total of 10.5 nmol to coat 1 mL of 0.8 OD of 10 nm gold). This is somewhat of an overestimate due to tessellation of the lipids onto a small sphere and somewhat of an underestimate due to an anticipated 1 nm water cushion that separates the lipids from the surface, as observed with supported bilayers on glass beads.25 To account for this and any inefficiency in transfer of liposomes to the gold surface, we used a total of 22 nmol and found that this provided complete coverage as demonstrated by cyanide stability (vide infra). In comparison, a typical LDL particle is 21 nm in diameter and contains an exterior coating with 825 phospholipids similar to the nanoparticles.26
Hydrophobic alkanethiols can anchor supported bilayers to a gold surface to form stable hybrid bilayer nanoparticles (HBNs).13,27 To anchor the lipids on to the surface, hexanethiol (HT) was added to the PC-coated gold nanoparticles. When minimal PC is available, thiol addition leads to nanoparticle aggregation as evident by a color change from red to purple and a shift in the plasmon band of the gold nanoparticles followed by a decrease in intensity. To avoid this aggregation, sodium oleate (SO) was added to the gold nanoparticle solution prior to the addition of lipids. SO prevents aggregation by providing hydrophobic binding partners on the gold surface avoiding interparticle interactions between the thiol chains. However, oleate alone does not provide the same stability that added thiol does, probably because it is not covalently connected to the gold surface. The nanoparticles were incubated with the lipids for 40 min and then incubated with HT for 30 min prior to use in binding studies. A portion of the oleate is likely displaced from the surface by ligand exchange with the thiol.
To determine if the thiols and lipids form a complete and intact bilayer around the gold, cyanide stability was used as a diagnostic. Cyanide is commonly used to etch gold films, oxidizing Au0 to AuI, and resistance to etch is one indication of a compact ligand shell.28 We previously demonstrated that when thiols with hydrophobic alkyl chains are added to lipid-coated nanoparticles they become resistant to cyanide.13 Cyanide was added to Au-SO-PC-HT nanoparticles (a > 14 fold excess relative to gold atoms in 1 mL of 0.75 OD) and the plasmon band was monitored for 1 h (Figure S1). As evident from the UV-vis spectra, the intensity of the surface plasmon of Au-SO-PC-HT nanoparticles remained unchanged. This indicates that the cyanide ions are unable to penetrate the lipid bilayer to etch the gold surface and that an ion-impermeable bilayer surrounds the gold core. This demonstrates that the lipids are evenly distributed across the nanoparticle surface. In contrast, thiol-stabilized nanoparticles without PC are unstable toward cyanide etch.28 A rapid decrease in the plasmon (within 2 minutes) was observed with bare or SO coated gold nanoparticles in the absence of HT (Figure S1).
CRP Binding to Nanoparticles is Calcium Dependent
UV-vis spectroscopy was used to monitor changes occurring at the nanoparticle surface. Representative UV-vis spectra of the nanoparticles taken after addition of lipids and thiols, in buffer containing calcium, and in the presence of CRP are shown in Figure 1. The LSPR of bare gold nanoparticles was observed at 519 nm in water (Figure 1 (i)). The addition of 20 nmol of SO and 22 nmol of PC leaves the plasmon unchanged (LSPR = 519 nm). Addition of HT causes a minor red shift of 2 nm (LSPR = 521 nm) consistent with the exclusion of water surrounding the gold. Prior to CRP binding studies, the gold nanoparticle solution was mixed with buffer and no change in the surface plasmon was observed (Figure 1(ii)) despite a 227 μM calcium concentration, indicating that the nanoparticles were not aggregated by calcium.
Figure 1.

UV-vis spectra of i) 10 nm bare Au nanoparticles in water, ii) Au-SO-PC-HT nanoparticles in 10 mM HEPES at pH 6.5 with 0.1% NaN3 in 227 μM CaCl2, and iii) Au-SO-PC-HT nanoparticles in the presence of 45.5 nM CRP and 252 μM CaCl2.
A substantial red shift (12 nm) of the plasmon resonance was observed after addition of CRP to Au-SO-PC-HT (Figure 1 (iii)). This reveals that a change in the surroundings of Au-SO-PC-HT has occurred in the presence of CRP and calcium. A slight change in color from red to red-lilac with no observable turbidity was observed after CRP addition, consistent with the 12 nm shift in the LSPR to 533 nm. Addition of the same buffer without CRP does not result in a similar change to the LSPR. Therefore, this red shift establishes that the protein has caused either a coupling between nanoparticles or a change in the refractive index of the surrounding environment of the gold nanoparticles.
CRP binds to calcium with a Kd of 60 μM and CRP binding to PC membranes requires calcium.29 If nanoparticle binding occurs through the PC binding site, calcium dependent binding is expected. To examine the effect of calcium on CRP binding to the nanoparticles, UV-vis studies were conducted with increasing calcium (25 - 252 μM) added to Au-SO-PC-HT in the presence of CRP (45.5 nM). The UV-vis spectra were taken 15-20 min after CRP addition. With increasing calcium concentration there was an increasing red shift of the LSPR (Figure 2a and 2b) in the presence of CRP. A similar red shift was not observed with increasing calcium (up to 800 μM) in the absence of CRP (Figure 2c). This demonstrates that the resultant LSPR shift was due to CRP binding through the PC site on the gold nanoparticles and not due to salt induced nanoparticle aggregation.
Figure 2.

a) UV-vis spectra of Au-SO-PC-HT nanoparticles in 10 mM HEPES at pH 6.5 with 0.1% NaN3 and with increasing concentrations of CaCl2 in the presence of 45.5 nM CRP, b) plot of LSPR red shift with increasing concentration of CaCl2 [25 - 252 μM] in the presence of 45.5 nM CRP, and c) UV-vis spectra of Au-SO-PC-HT with an increasing concentration of CaCl2 [0 – 800 μM] in the absence of CRP.
To better understand the role of CRP's calcium binding site in the interaction with nanoparticles, several control experiments were performed. A 5-fold excess of EDTA (1.24 mM) relative to calcium was added to the CRP bound Au-SO-PC-HT nanoparticles and UV-vis spectra were taken after 15 min (Figure 3a(ii)). A minor blue shift (2 nm) in the plasmon band was observed after the addition of EDTA to the CRP containing sample (Figure 3a(iii)) suggesting that no change occurs to the nanoparticles. However, when the CRP was pre-incubated with EDTA (1.24 mM) for 15 min prior to addition to the Au-SO-PC-HT in the presence of 252 μM of calcium, no red shift in the LSPR was observed after CRP addition (Figure S2). This indicates that calcium chelation by EDTA prevents CRP from interacting with the lipid-coated nanoparticles. However, once CRP has bound to the nanoparticles, EDTA does not undo the red shift, demonstrating that an irreversible change in the nanoparticle surroundings has occurred.
Figure 3.

UV-vis spectra of a) i) Au-SO-PC-HT nanoparticles in 10 mM HEPES at pH 6.5 with 0.1% NaN3 in 227 μM CaCl2, ii) in the presence of 45.5 nM CRP and 252 μM CaCl2, and iii) after addition of 1.24 mM EDTA in 10 mM HEPES at pH 6.5 with 0.1% NaN3. b) KCN stability test of CRP-Au-SO-PC-HT nanoparticles in 10 mM HEPES at pH 6.5 with 0.1% NaN3 in 252 μM CaCl2 with 5.7 mM KCN at i) time = 0 min, and ii) time = 60 min.
The irreversible LSPR shift could be the result of changes in the lipid structure or simply due to CRP cross-linked aggregation of the gold. Aggregation caused by direct protein attachment is not expected to result in an impermeable ion barrier; therefore, cyanide stability was used to confirm that the LSPR red shift was not due to CRP aggregation. Potassium cyanide (5.7 mM) was added to the sample in the absence of EDTA and the plasmon band was monitored for 1 h by UV-vis. A 3% decrease in the intensity of the LSPR, after factoring for dilution, was observed after a 60 min incubation of Au-SO-PC-HT with cyanide (Figure 3b(ii)). A similar small decrease in the plasmon band was observed when cyanide was added after EDTA addition (Figure S3). In contrast, a >90% intensity decrease occurred when bare gold was incubated with cyanide for 2 min (Figure S1). This indicates that the membrane coating remains intact in the presence of CRP. These lines of evidence suggest that the binding is due to CRP-membrane interactions and not due to direct protein interactions with gold.
Transmission Electron Microscopy Reveals CRP Induced Clustering
TEM studies were conducted to investigate the structural changes that cause the CRP-dependent change in the LSPR. TEM images were collected from samples before and after addition of CRP to Au-SO-PC-HT (Figure 4, a and b). Samples were coated onto grids 15-30 minutes prior to image collection to minimize drying effects that could lead to nanoparticle aggregation. In the images obtained of Au-SO-PC-HT in 10 mM HEPES at pH 6.5 with 0.1% NaN3 and 227 μM of CaCl2 the nanoparticles were homogenously distributed across the grid (Figure 4a). This is consistent with the relatively minor (2 nm) red shift in the UV-vis after adding SO, PC, HT, and buffer containing calcium.
Figure 4.

Representative TEM images of Au-SO-PC-HT nanoparticles in a) 10 mM HEPES at pH 6.5 with 0.1% NaN3 and 227 μM CaCl2, b) in the presence of 45.5 nM CRP and 252 μM CaCl2, and c) after addition of 1.24 mM EDTA. Circles indicate the cluster sizes (yellow = 1, orange = 2, blue = 3, green = 4, red = 5, white = 6, and purple ≥ 10). Scale bars = 50 nm.
A considerable decrease in interparticle spacing was observed after addition of CRP in the presence of calcium as evident by formation of discrete clusters of nanoparticles observed in the TEM micrographs (Figure 4b). Single nanoparticles and clusters of 2, 3, and ≥ 10 were predominant over other cluster sizes (Figure 5). Nanoparticles within 7 nm of neighboring nanoparticles were considered part of the same cluster, while objects outside that distance were excluded. The decreased interparticle spacing observed within the clusters indicates that a plasmon coupling effect due to nanoparticle proximity is the cause of the red shift in the UV-vis (Figure 1(iii)). A nearly identical distribution of clusters was observed after the addition of a 5-fold excess of EDTA (Figure 4c and Figure S4) in which clusters of 2, 3 and ≥ 10 were also predominant. In conjunction with the UV-vis results, the TEM data indicates that CRP induces cluster formation. This was further confirmed by DLS analysis in which bare gold had an average size of 9.8 ± 1.2 nm, Au-SO-PC-HT had an average size of 17.5 ± 0.7 nm and exposure to CRP resulted in an average size of 104.4 ± 4.1 nm (Figure S5). Furthermore, after the addition of EDTA, DLS revealed an average size of 28.9 ± 1.2 nm (Figure S5) indicating a decrease in size as CRP is removed from the cluster surface. However, significant clustering remains, as confirmed by TEM and LSPR.
Figure 5.

Histogram analysis of the frequency of nanoparticle cluster sizes formed after the addition of CRP to Au-SO-PC-HT in 10 mM HEPES at pH 6.5 with 0.1% NaN3 and 252 μM CaCl2.
The small interparticle spacing suggests that a structural rearrangement of the lipid bilayer occurs after CRP addition while maintaining an ion-impermeable barrier around the gold. 48% of the nanoparticles within clusters appeared to have a minimal contact area and the median interparticle spacing of the remaining nanoparticles was 2.3 nm. This indicates that the lipids were no longer arranged as a bilayer around each gold core since this distance is smaller than expected for two full bilayers. The interparticle spacing is consistent with the hydrophobic tails of thiols separating nanoparticles. A subset of the nanoparticles appeared as isolated objects in the TEM after CRP addition, indicating that both isolated and clustered nanoparticles exist in solution. Cyanide stability experiments confirm that both the clusters and isolated nanoparticles have intact lipid layers surrounding the metal. In the case of clusters, a single outer leaflet of lipids is thought to surround all of the nanoparticles with a layer of thiol separating nanoparticles within clusters (Scheme 1). The inner leaflet contains HT and any SO that was not lost to exchange. CRP causes fusion of the nanoparticles and is likely to be bound exclusively to the outer leaflet of the clusters and nanoparticles. TEM and SPR analysis after EDTA addition demonstrated that the structural changes induced by CRP are irreversible. That is, the median interparticle spacing of nanoparticles remained the same (2.6 nm) after EDTA addition and a similar proportion of the nanoparticles had an area of minimal contact (49%).
Scheme 1.

Structure of Au-SO-PC-HT clusters.
The physiological function of CRP has not been determined, however, it is known that CRP binds to and causes aggregation of LDL.6 Macrophages selectively take up clustered LDL to become foam cells during atherosclerotic plaque formation.30 When CRP is bound to a surface in vitro, it will cause aggregation of LDL and these aggregated LDL particles are selectively taken up by foam cells while normal LDL are not.6 CRP acts on the nanoparticle mimics of LDL in a similar way, causing clustering in a calcium dependent manner. Here the CRP is not plated on a surface, but is used in a soluble form, demonstrating that soluble CRP can also induce clustering. The process of aggregating nanoparticles observed here involves combining multiple, discrete lipid-coated nanoparticles into a single cluster, suggesting that CRP has a role in membrane fusion.
To more clearly define the role of lipids in this system, a comparison was made to CRP interactions with bare gold nanoparticles. When CRP (45.5 nM) was added to bare gold nanoparticles, the nanoparticles aggregate with many large overlaps and no discernable clusters (Figure S6). A large LSPR shift was observed with bare gold (Figure S7) as was a significant amount of turbidity. When EDTA was added, there was a nearly complete reversal of aggregation as seen by TEM (Figure S6) and UV-vis (Figure S7). Unlike the irreversible LSPR shift observed with Au-SO-PC-HT, addition of EDTA to the CRP-bound bare gold nanoparticles leads to complete reversal and blue shift of the plasmon band. At pH 6.5 the protein is positively charged31 and interacts electrostatically with the negatively charged gold nanoparticle surface. Analogous non-specific cluster formation has also been observed in the presence of CRP with antibody labeled polystyrene nanoparticles via TEM.32 Another difference observed with bare gold nanoparticles is that under physiological NaCl concentrations (130 mM), the nanoparticles without a PC coating aggregate and precipitate. The instability of bare gold is evident by a change in color from red to purple (Δ LSPR = +101 nm) and a significant broadening of the LSPR (Figure S8). In contrast, Au-SO-PC-HT nanoparticles were found to be stable to 130 mM NaCl with little to no change in LSPR (Δ LSPR < 5 nm) or color for weeks (Figure S8). This demonstrates that the nanoparticles are protected by a hybrid bilayer structure and therefore are more stable to physiological conditions.
CRP Binding to Nanoparticles Confirmed by Fluorescence Anisotropy
A fluorescence anisotropy assay was used to confirm that CRP is bound on the exposed surface of the nanoparticles and clusters. To demonstrate that CRP was bound to the outer lipid leaflet, a fluorophore-labeled aptamer, Cy5RNA, was prepared to serve as a reporter of CRP binding. The 44-mer RNA aptamer identified from SELEX has strong binding affinity for CRP (Kd = 125 nM).17 This aptamer was modified at the 5′ end with a Cy5 dye covalently linked to the terminal residue to serve as a fluorescent reporter of binding. Binding was expected to result in an increase in the fluorescence anisotropy of Cy5RNA as the hydrodynamic radius increases on binding to CRP that is bound to the nanoparticles surface (Scheme 2). This approach provides a one step sandwich assay without the need for isolation of the conjugate.
Scheme 2.
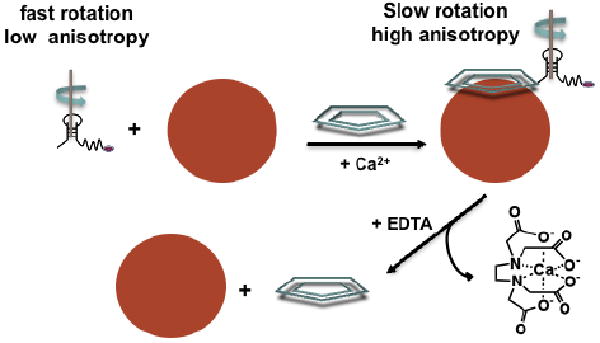
CRP binding assay using Cy5RNA aptamer. Addition of CRP provides a connection between aptamer and the PC-coated nanoparticle.
An increase in aptamer anisotropy was observed after addition of CRP to the nanoparticles (Figure 6). The starting point of the experiment (time = 0) began immediately after Cy5RNA was added to the Au-SO-PC-HT nanoparticles in 10 mM HEPES at pH 6.5 with 0.1% NaN3 in the presence of 227 μM CaCl2. The anisotropy of Cy5RNA alone was 0.296 ± 0.002 in the absence of nanoparticles (Figure S9). The anisotropy of Cy5RNA increased minimally in the presence of Au-SO-PC-HT nanoparticles without CRP (to 0.323 ± 0.010) demonstrating that the aptamer has little affinity for the PC-coated gold nanoparticles. Immediately after CRP addition at 15 min, a prominent increase in anisotropy (Δr = +0.261 ± 0.004) was observed (Figure 6a). The observed change in anisotropy is a function of binding efficiency (% of aptamer bound to CRP and % of CRP bound to the nanoparticle surface) and the relative size of the resulting conjugate. The large size of the clusters makes anisotropy an ideal method for measuring binding. Because the conjugate of CRP with the clusters or nanoparticles is much larger in size than CRP alone, binding causes a large change in the effective hydrodynamic radius of the fluorophore. The observed anisotropy change reflects CRP binding to both isolated, bilayer-coated nanoparticles and to clusters of nanoparticles. The larger clusters significantly slow the rotation of the dye and likely contribute substantially to the observed Δr. In contrast, almost no change in the anisotropy was observed when CRP and aptamer were incubated together (Figure S9).
Figure 6.

a) Fluorescence anisotropy of 9.2 nM Cy5RNA in 10 mM HEPES at pH 6.5 with 0.1% NaN3 after sequential addition of i) 0.8 OD of Au-SO-PC-HT in 227 μM CaCl2 (0 - 15 min), ii) in the presence of 45.5 nM CRP with 252 μM CaCl2 (15 - 30 min), and iii) in the presence of 5× EDTA (30 - 45 min) (blue trace). b) 9.1 nM Cy5RNA in 10 mM HEPES at pH 6.5 with 0.1% NaN3 after sequential addition of i) 0.8 OD of 10 nm Au in 227 μM CaCl2 (0 - 15 min), and ii) in the presence of 45.5 nM CRP with 252 μM CaCl2 (15 - 30 min) that was pre-incubated with 5× EDTA for 15 min (orange trace).
Effect of EDTA on CRP Binding to Lipids
Anisotropy was used to confirm that CRP was no longer attached to the clusters after addition of EDTA, demonstrating that CRP causes an irreversible change to the lipid packing around the gold core. The binding constant of EDTA for calcium is 59 nM in HEPES buffer at pH 8 ensuring that calcium can be fully sequestered by addition of EDTA.33 UV-vis spectra and TEM images collected after CRP and EDTA addition suggested that CRP binding to the nanoparticles could be irreversible as evident by the irreversible LSPR shift and cluster formation. Both TEM and LSPR were unchanged after calcium was sequestered using EDTA. To further probe the mechanism of CRP binding to the nanoparticles and to investigate the role of calcium, the effect of EDTA on anisotropy was investigated. A drop in the fluorescence anisotropy was observed (Δr = -0.233 ± 0.011) within minutes of adding a 5-fold excess of EDTA (Figure 6a (iii)). The decreased anisotropy is a 90% return to the original aptamer value and suggests a nearly complete dissociation of CRP from the nanoparticle surface. DLS reveals a decrease in size to 28.9 ± 1.2 nm (Figure S5) consistent with loss of protein and still shows evidence of multiple-particle clusters with a larger size than Au-SO-PC-HT prior to addition of CRP. This is consistent with EDTA sequestration of calcium ions leading to dissociation of CRP from the PC-coated nanoparticles and clusters and supports a reversible calcium bridging mechanism between the PC and CRP. When no calcium was added and the stock solution of CRP was incubated with EDTA (1.24 mM) for 15 min to sequester the calcium from the stock solution prior to addition to Au-SO-PC-HT there was minimal change in the fluorescence anisotropy (Figure 6,b) of the aptamer. In addition, no change in the LSPR band of the gold nanoparticles (Figure S2) was observed. This demonstrates that EDTA sequestration of calcium prevents CRP interaction with the nanoparticle bilayer. We interpret these results to indicate that CRP binds reversibly to PC-coated nanoparticles in a calcium dependent manner that induces irreversible changes to the lipid structure.
Conclusions
This study demonstrates that CRP can recognize lipids coated on gold nanoparticles through a reversible calcium bridging mechanism. This is an important first step towards designing biomimetic models that accurately represent the nanoscale structure of biological lipid membranes such as those found on lipoprotein particles. Accurate mimics are needed for the design of contrast agents, sensors, and to improve our understanding of protein interactions with LDL. In this study, nanostructured lipid membranes similar in size to LDL (21 nm)34 were prepared by coating minimal lipid on gold nanoparticles with alkanethiol added to form hybrid bilayer nanoparticles.
Interestingly, CRP binding to the lipid membranes on the highly curved nanoparticle surface induces a structural rearrangement of the lipid membrane around the gold core. As a result, clusters of nanoparticles are observed in the presence of calcium after adding CRP. The structural rearrangement observed when CRP binds to lipid membranes on the nanoparticle surface could provide insight into lipid rearrangements occurring on LDL prior to or during their uptake at atherosclerotic lesions. This system will aid studies that lead to an understanding of CRP's role in CVD. It has been suggested that CRP specifically causes clustering of damaged LDL, increasing its uptake by macrophages in the arterial intima.4 This clustering behavior has been seen with plated CRP inducing LDL aggregates.6 Here we report the first example of soluble CRP causing similar clustering.
Supplementary Material
Figure S1. KCN stability of Au-SO-PC-HT, Au-SO-PC, and Au-SO nanoparticles. Figure S2. UV-vis spectra of Au-SO-PC-HT nanoparticles before and after addition of 45.5 nM CRP with 252 µM CaCl2 pre-incubated with 1.24 mM EDTA for 15 min. Figure S3. KCN stability of Au-SO-PC-HT with CRP and EDTA. Figure S4. Histogram analysis of the frequency of nanoparticle cluster sizes after the addition of EDTA to CRP-bound Au-SO-PC-HT. Figure S5. DLS of nanoparticles before and after addition of CRP and EDTA. Figure S6. TEM images of bare Au nanoparticles after addition of CRP and EDTA. Figure S7. UV-vis spectra of bare nanoparticles with CRP and EDTA. Figure S8. UV-vis flocculation assay of Au-SO-PC-HT nanoparticles and bare gold nanoparticles. Figure S9. Fluorescence anisotropy of Cy5RNA with CRP.
Acknowledgments
This material is based on research sponsored by Air Force Research Laboratory under agreement number FA8650-05-1-5041, the Office of Naval Research under agreement number 00014-07-1-0457, and the NIH under 1R15GM088960. We thank Andrea M. Goforth for access to DLS equipment and Anna L. Brown for assistance collecting fluorescence spectra.
Footnotes
SUPPORTING INFORMATION. This information is available free of charge via the Internet at http://pubs.acs.org.
References
- 1.Ridker PM, Hennekens CH, Buring JE, Rifai N. N Engl J Med. 2000;342:836–843. doi: 10.1056/NEJM200003233421202. [DOI] [PubMed] [Google Scholar]
- 2.Shrive AK, Gheetham GMT, Holden D, Myles DAA, Turnell WG, Volanakis JE, Pepys MB, Bloomer AC, Greenhough TJ. Nat Struct Bio. 1996;3:346–354. doi: 10.1038/nsb0496-346. [DOI] [PubMed] [Google Scholar]
- 3.Pepys MB, Hirschfield GM. J Clin Invest. 2003;111:1805–1812. doi: 10.1172/JCI18921. [DOI] [PMC free article] [PubMed] [Google Scholar]
- 4.Fu T, Borensztajn J. Biochem J. 2002;366:195–201. doi: 10.1042/BJ20020045. [DOI] [PMC free article] [PubMed] [Google Scholar]
- 5.Chang MK, Binder CJ, Torzewski M, Witztum JL. Proc Natl Acad Sci USA. 2002;99:13043–13048. doi: 10.1073/pnas.192399699. [DOI] [PMC free article] [PubMed] [Google Scholar]
- 6.Pentikäinen MO, Oörni K, Ala-Korpela M, Kovanen PT. J Intern Med. 2000;247:359–370. doi: 10.1046/j.1365-2796.2000.00655.x. [DOI] [PubMed] [Google Scholar]
- 7.Torzewski J, Torzewski M, Bowyer DE, Fröhlich M, Koenig W, Waltenberger J, Fitzsimmons C, Hombach V. Arterioscler Thromb Vasc Biol. 1998;18:1386–1392. doi: 10.1161/01.atv.18.9.1386. [DOI] [PubMed] [Google Scholar]
- 8.Zhang YX, Cliff WJ, Schoefl GI, Higgins G. Atherosclerosis. 1999;145:375–379. doi: 10.1016/s0021-9150(99)00105-7. [DOI] [PubMed] [Google Scholar]
- 9.a) Khreiss T, Jozsef L, Potempa LA, Filep JG. Circulation. 2004;110:2713–2730. doi: 10.1161/01.CIR.0000146846.00816.DD. [DOI] [PubMed] [Google Scholar]; b) Khreiss T, Jozsef L, Potempa LA, Filep JG. Circulation. 2004;109:2016–2022. doi: 10.1161/01.CIR.0000125527.41598.68. [DOI] [PubMed] [Google Scholar]; c) Potempa LA, Zeller JM, Fiedel BA, Kinoshita CM, Gewurz H. Inflammation. 1988;12:391–405. doi: 10.1007/BF00915774. [DOI] [PubMed] [Google Scholar]; d) Schwedler SB, Amann K, Wernicke K, Krebs A, Nauck M, Wanner C, Potempa LA, Galle J. Circulation. 2005;112:1016–1023. doi: 10.1161/CIRCULATIONAHA.105.556530. [DOI] [PubMed] [Google Scholar]
- 10.Tanaka M, Sackman E. Nature. 2005;437:656–663. doi: 10.1038/nature04164. [DOI] [PubMed] [Google Scholar]
- 11.Groves JT, Boxer SG. Acc Chem Res. 2002;35:149–157. doi: 10.1021/ar950039m. [DOI] [PubMed] [Google Scholar]
- 12.Baksh MM, Jaros M, Groves JT. Nature. 2004;427:139–141. doi: 10.1038/nature02209. [DOI] [PubMed] [Google Scholar]
- 13.Sitaula S, Mackiewicz MR, Reed SM. Chem Comm. 2008;26:3013–3015. doi: 10.1039/b801525b. [DOI] [PubMed] [Google Scholar]
- 14.Cormode DP, et al. Nano Lett. 2008;8:3715–3723. doi: 10.1021/nl801958b. [DOI] [PMC free article] [PubMed] [Google Scholar]
- 15.Thaxton CS, Daniel WL, Giljohann DA, Thomas AD, Mirkin CA. J Am Chem Soc. 2009;131:1384–1385. doi: 10.1021/ja808856z. [DOI] [PMC free article] [PubMed] [Google Scholar]
- 16.Sepúlveda B, Angelomé PC, Lechuga LM, Liz-Marzán LM. Nano Today. 2009;4:244–251. [Google Scholar]
- 17.Kim SD, Ryu JS, Yi HK, Kim SC, Zhang BT. Preliminary Proceedings of the Tenth International Meeting on DNA Computing (DNA10) 2004:334–343. [Google Scholar]
- 18.Bini A, Centi S, Tombelli S, Minunni M, Mascini M. Anal Bioanal Chem. 2008;390:1077–1086. doi: 10.1007/s00216-007-1736-7. [DOI] [PubMed] [Google Scholar]
- 19.Szoka F, Papahadjopoulos D. Annu Rev Biophys Bioeng. 1980;9:467–508. doi: 10.1146/annurev.bb.09.060180.002343. [DOI] [PubMed] [Google Scholar]
- 20.Lakowicz JR. Principles of Fluorescence Spectroscopy. 2nd. Kluwer, Academic Press/Plenum Publishers; New York: 1999. [Google Scholar]
- 21.Mackiewicz MR, Ayres BR, Reed SM. Nanotechnology. 2008;19:115607. doi: 10.1088/0957-4484/19/11/115607. [DOI] [PubMed] [Google Scholar]
- 22.a) Hong K, Friend DS, Glabe CG, Papahadjopoulos D. Biochim Biophys Acta. 1983;732:320–323. doi: 10.1016/0005-2736(83)90220-1. [DOI] [PubMed] [Google Scholar]; b) Meldrum FC, Heywood BR, Mann S. J Colloid Interface Sci. 1993;161:66–71. [Google Scholar]; c) He P, Urban MW. Biomacromolecules. 2005;6:1224–1225. doi: 10.1021/bm0501961. [DOI] [PubMed] [Google Scholar]; d) Markowitz MA, Dunn DN, Chow GM, Zhang J. J Colloid Interface Sci. 1999;210:73–85. doi: 10.1006/jcis.1998.5932. [DOI] [PubMed] [Google Scholar]; e) Meyre M, Lambert O, Desbat B, Faure C. Nanotechnology. 2006;17:1193–1201. [Google Scholar]; f) Roberston D, Tiersch B, Kosmella S, Koetz J. J Colloid Interface Sci. 2007;305:345–351. doi: 10.1016/j.jcis.2006.09.079. [DOI] [PubMed] [Google Scholar]; g) He P, Zhu X. Mater Res Bull. 2007;42:1310–1351. [Google Scholar]; h) Debin H, Xiaohua Z, Zengrong L. Chinese Sci Bull. 1998;43:789. [Google Scholar]; i) Takahashi H, Niidome Y, Niidome T, Kaneko K, Kawasaki H, Yamada S. Langmuir. 2006;22:2–5. doi: 10.1021/la0520029. [DOI] [PubMed] [Google Scholar]; j) Regev O, Backov R, Faure C. Chem Mater. 2004;16:5280–5285. [Google Scholar]
- 23.Liu X, Atwater M, Wang J, Huo Q. Colloids and Surfaces B: Biointerfaces. 2007;58:3–7. doi: 10.1016/j.colsurfb.2006.08.005. [DOI] [PubMed] [Google Scholar]
- 24.Nagle JF, Tristram-Nagle S. Biochim Biophys Acta. 2000;1469:159–195. doi: 10.1016/s0304-4157(00)00016-2. [DOI] [PMC free article] [PubMed] [Google Scholar]
- 25.Bayerl TM, Bloom M. Biophys J. 1990;58:357–362. doi: 10.1016/S0006-3495(90)82382-1. [DOI] [PMC free article] [PubMed] [Google Scholar]
- 26.Teerlink T, Scheffer PG, Bakker SJL, Heine RJ. J Lipid Res. 2004;45:954–966. doi: 10.1194/jlr.M300521-JLR200. [DOI] [PubMed] [Google Scholar]
- 27.Kundu J, Levin CS, Halas NJ. Nanoscale. 2009;1:114–117. doi: 10.1039/b9nr00063a. [DOI] [PubMed] [Google Scholar]
- 28.Templeton AC, Hostetler MJ, Kraft CT, Murray RW. J Am Chem Soc. 1998;120:1906–1911. [Google Scholar]
- 29.a) Volanakis JE, Wirtz KWA. Nature. 1979;281:155–157. doi: 10.1038/281155a0. [DOI] [PubMed] [Google Scholar]; b) Pepys MB, Rowe IF, Baltz ML. Int Rev Exp Path. 1985;27:83–111. [PubMed] [Google Scholar]; c) Kinoshita CM, Ying SC, Hugli TE, Siegel JN, Potempa LA, Jiang H, Houghten RA, Gewurz H. Biochemistry. 1989;28:9840–9848. doi: 10.1021/bi00451a044. [DOI] [PubMed] [Google Scholar]
- 30.Hoff HF, O'Neil J. Arterioscler Thromb Vasc Biol. 1991;11:1209–1222. doi: 10.1161/01.atv.11.5.1209. [DOI] [PubMed] [Google Scholar]
- 31.Tsujimoto M, Inoue K, Nojima S. J Biochem. 1983;94:1367–1373. doi: 10.1093/oxfordjournals.jbchem.a134483. [DOI] [PubMed] [Google Scholar]
- 32.Cölfen H, Volkel A, Eda S, Kobold U, Kaufmann J, Puhlmann A, Göltner C, Wachernig H. Langmuir. 2002;18:7623–7628. [Google Scholar]
- 33.Christensen T, Gooden DM, Kung JE, Toone EJ. J Am Chem Soc. 2003;125:7357–7366. doi: 10.1021/ja021240c. [DOI] [PubMed] [Google Scholar]
- 34.Lima ES, Maranhao RC. Clin Chem. 2004;50:1086–1088. doi: 10.1373/clinchem.2004.032383. [DOI] [PubMed] [Google Scholar]
Associated Data
This section collects any data citations, data availability statements, or supplementary materials included in this article.
Supplementary Materials
Figure S1. KCN stability of Au-SO-PC-HT, Au-SO-PC, and Au-SO nanoparticles. Figure S2. UV-vis spectra of Au-SO-PC-HT nanoparticles before and after addition of 45.5 nM CRP with 252 µM CaCl2 pre-incubated with 1.24 mM EDTA for 15 min. Figure S3. KCN stability of Au-SO-PC-HT with CRP and EDTA. Figure S4. Histogram analysis of the frequency of nanoparticle cluster sizes after the addition of EDTA to CRP-bound Au-SO-PC-HT. Figure S5. DLS of nanoparticles before and after addition of CRP and EDTA. Figure S6. TEM images of bare Au nanoparticles after addition of CRP and EDTA. Figure S7. UV-vis spectra of bare nanoparticles with CRP and EDTA. Figure S8. UV-vis flocculation assay of Au-SO-PC-HT nanoparticles and bare gold nanoparticles. Figure S9. Fluorescence anisotropy of Cy5RNA with CRP.