

Abstract
Phospholipid transfer protein (PLTP), which associates with apolipoprotein A-I (the major HDL protein) plays a key role in lipoprotein remodeling. Because its level in plasma increases during acute inflammation, it may also play previously unsuspected roles in the innate immune system. To gain further insight into its potential physiological functions, we isolated complexes containing PLTP from plasma by immunoaffinity chromatography, and determined their composition. Shotgun proteomics revealed that only 6 of the 24 proteins detected in the complexes were apolipoproteins. The most abundant proteins were clusterin (apoJ), PLTP itself, coagulation factors, complement factors, and apoA-I. Remarkably, 20 of the 24 proteins had known protein–protein interactions. Biochemical studies confirmed two previously established interactions and identified 5 new ones between PLTP and proteins. Moreover, clusterin, apoA-I, and apoE preserved the lipid-transfer activity of recombinant PLTP in the absence of lipid, indicating that these interactions may have functional significance. Unexpectedly, lipids accounted for only 3% of the mass of the PLTP complexes. Collectively, our observations indicate that PLTP in human plasma resides on lipid-poor complexes dominated by clusterin and proteins implicated in host defense and inflammation. They further suggest that protein–protein interactions drive the formation of PLTP complexes in plasma.
Phospholipid transfer protein (PLTP) is an 80-kDa glycoprotein that binds phospholipids and facilitates their transfer between lipoproteins in plasma. It is expressed by macrophages and many other tissues (1,2). PLTP associates with apoA-I and apoE (3,4), as well as with several unidentified proteins (4). Two forms of PLTP have been detected in human plasma: an “active” form that transfers phosphatidylcholine from phospholipid vesicles to high density lipoproteins (HDL), and an “inactive” form that lacks this capability (4-6). The apparent molecular weight of the “active” form is similar to that of small HDL particles (~160 kDa), while the inactive complexes appear to be much larger (apparent MW ~520 kDa) (4-6). However, the plasma fraction showing the greatest PLTP activity has a density of 1.24g/ml, which is significantly greater than that of HDL (1.063-1.21g/ml). Thus, PLTP complexes appear to be poorly lipidated (7).
PLTP was initially identified by its ability to transport phospholipid between lipoproteins in vitro (8-10), and studies using genetically engineered mice confirmed this function in vivo (11). PLTP can also bind and transfer free cholesterol (12) and vitamin E (13) among lipoproteins and between lipoproteins and cells. Like apoA-I, PLTP facilitates cholesterol efflux from cells (14) by interacting with the ATP-binding cassette transporter A1 (ABCA1) (15). Consequently, it is an important modulator of the level and composition of circulating lipoproteins (11,16). It can also modify the anti-oxidative potentials of lipoproteins and tissues (13).
PLTP is a member of the lipid transfer/lipopolysaccharide binding protein family, which includes cholesteryl ester transfer protein (CETP), bactericidal permeability-increasing protein (BPI), and lipopolysaccharide-binding protein (LBP) (17). Both PLTP and CETP transport lipids between lipoprotein classes. However PLTP, like BPI and LBP, binds the lipid A component of lipopolysaccharide (LPS) (18), the biochemical hallmark of Gram-negative bacteria, suggesting that PLTP might be involved in host defense mechanisms and inflammation. Indeed, PLTP levels increase during acute inflammation (19-21), and PLTP activity associates with inflammatory markers in patients with type 2 diabetes (22) and cardiovascular disease (23), two disorders linked to systemic inflammation. Moreover, because PLTP binds LPS but does not transfer it to CD14, it neutralizes the polysaccharide’s inflammatory effects (18). Importantly, PLTP deficiency increases mortality in a mouse model of endotoxemia (24).
To test the hypothesis that PLTP interacts with proteins implicated in the inflammatory response, we isolated PLTP complexes from plasma by immunoaffinity chromatography and analyzed their lipid and protein composition (25,26). We found that PLTP resides in lipid-poor complexes rich in proteins implicated in the acute phase response and coagulation/complement pathways. Thus, PLTP might participate in innate immunity and inflammation. Importantly, because PLTP complexes are lipid-poor and the majority of the proteins identified have known protein–protein interactions, our data suggest that such interactions are the driving force for the assembly of these complexes.
EXPERIMENTAL PROCEDURES
Human Studies
All studies involving human material were approved by the Human Studies Committee at the University of Washington. Blood was obtained from 8 healthy young adults (4 male and 4 female, ages 20–30 years) after an overnight fast, using Vacutainer tubes (Becton-Dickinson) containing disodium EDTA. Plasma prepared by low speed centrifugation for 30 min at 4°C was promptly supplemented with a protease inhibitor cocktail (Calbiochem) (final concentrations: 500 μM 4-(2-aminoethyl)-benzenesulfonyl fluoride hydrochloride, 150 nM aprotinin, 0.5 mM EDTA, 1 μM leupeptin hemisulfate, and 1 μM E-64), and PLTP complexes were immediately isolated.
Antibodies and Immunoadsorbents
Polyclonal antibodies against PLTP were produced by immunizing chickens with purified full-length recombinant PLTP (rPLTP). The rPLTP was produced in BHK-570 cells transfected with human PLTP-His tag cDNA, and purified from the serum-free conditioned medium of these cells with Ni-NTA agarose (Qiagen) (1). Specific chicken anti-PLTP antibodies were isolated from egg yolk IgY by affinity chromatography, using rPLTP covalently coupled to CNBr-activated Sepharose 4B according to the manufacturer’s protocol (GE Life Sciences). Affinity-isolated anti-PLTP antibodies reacted with a single band of material in human plasma (~80 kDa) that co-migrated with rPLTP subjected to SDS gel electrophoresis. These antibodies completely inhibited rPLTP’s phospholipid transfer activity and >95% of human plasma phospholipid transfer activity. Chicken anti-PLTP immunoadsorbent was prepared by conjugating 12 mg of the antibody to 2 g of CNBr-activated Sepharose 4B. Identical amounts of IgY obtained from the same chickens prior to immunization (“pre-immune IgY”) were similarly conjugated to 2g of CNBr-activated Sepharose 4B to create a control immunoadsorbent.
We also prepared Mab4, a monoclonal antibody to PLTP that recognizes a population of plasma PLTP that is unable to transfer phospholipid from liposomes to HDL (6). Mab4 was produced by injecting pristine primed Balb/c mice with the Mab4 hybridoma cells, and the antibody was purified from the ascites with Fast Flow Protein A Sepharose (GE Life Sciences). Purified Mab4 (27 mg) was conjugated to 2.5g CNBr-activated Sepharose 4B to generate the Mab4 immunoadsorbent. All affinity gels were packed into columns and stored in 0.01M Tris buffer, pH 7.4, containing 0.15 M NaCl, 1 mM EDTA, and 0.01% sodium azide (Tris buffer).
Isolation of PLTP-Containing Complexes by Immunoaffinity Chromatography
PLTP complexes were isolated from plasma (45-60 mL) using two immunoaffinity columns in sequence; first Mab4 column (8 mL) to remove an inactive PLTP population, followed by chicken anti-PLTP column (7 ml). Plasma was applied to the columns at 8 mL/h, and the columns were subsequently washed with Tris buffer, initially at 8 mL/h then at a flow rate up to 90mL/h, until the 280 nm absorbance of the wash fell to zero. PLTP complexes bound to the chicken anti-PLTP immunoadsorbent were eluted with 0.1 M glycine (pH 2.8) at 90 mL/h. The pH of the eluted material was immediately adjusted to 7 with 1 M Tris (pH 8.6), and assays for PLTP activity were preformed. All active fractions were combined and concentrated under vacuum, using a membrane filter that excluded molecules with MWs <10,000 (Spectrum Laboratories). Contaminating immunoglobulins were removed by exposing concentrated PLTP complexes to Protein A and Protein G coupled to Sepharose beads (GE Life Sciences). Recovery of PLTP from the columns after concentration and Protein A and Protein G adsorption was 64 ± 9%.
To assess nonspecific protein binding to the immunoaffinity column, the flow-through plasma of the chicken anti-PLTP immunoadsorbent column was applied to the pre-immune IgY immunoadsorbent at 8ml/hr and the column was washed with Tris buffer until the 280nm absorbance of the wash fell to zero. Material bound to the pre-immune column was eluted with 0.1 M glycine (pH 2.8) and immediately neutralized with IM Tris, pH 8.6. Eluted materials were monitored with absorption spectroscopy. All materials with 280 nm absorption > 0 were pooled, concentrated, and exposed to Protein A and Protein G coupled to Sepharose beads as described above for anti-PLTP column.
Protein Digestion
Isolated complexes (10 μg protein) were adjusted to a final concentration of 100 μg/ml with digestion buffer (0.1% Rapigest; Waters, 50 mM Tris buffer, pH 8.0). Samples were reduced, alkylated, and digested at 37°C with two aliquots of trypsin (1:50, w/w, trypsin/protein; Promega), first for 2 h and then overnight. Proteolysis was stopped by adding HCl (final conc. 50 mM). The samples were incubated for 45 min at 37°C to hydrolyze the Rapigest detergent, and then clarified by centrifugation. The supernatants were dried under vacuum, and resuspended in 5% acetonitrile (0.3% acetic acid) for mass spectrometric analysis.
LC-ESI-MS/MS
Tryptic digests (2 μg protein) were injected onto a trap column (Paradigm Platinum Peptide Nanotrap, 0.15 × 50 mm; Michrom Bioresources, Inc.), desalted for 5 min with 1% acetonitrile/0.1% formic acid (50 μL/min), eluted onto an analytical reverse-phase column (0.15 × 150 mm, Magic C18AQ, 5 μm, 200 A; Michrom Bioresources, Inc.), and separated at a flow rate of 1 μL/min over 180 min, using a linear gradient of 5% to 35% buffer B (90% acetonitrile, 0.1% formic acid) in buffer A (5% acetonitrile, 0.1% formic acid). Mass spectra were acquired in the positive ion mode, using electrospray ionization in a linear ion trap mass spectrometer (LTQ, Thermo Electron Corp., San Jose, CA) with data-dependent acquisition (one MS survey scan followed by MS/MS scans of the 8 most abundant peaks in the survey scan). Samples from 4 subjects from the PLTP affinity column and from 3 subjects from the control IgY column were analyzed in duplicate.
Protein Identification by LC-ESI-MS/MS
MS/MS spectra were matched against the human International Protein Index (IPI) database v.3.4 (12/1/2006) (27), using the SEQUEST (v 2.7) search engine with fixed Cys carbamidomethylation and variable Met oxidation modifications. The mass tolerance for precursor ions was 2.5 Da, and the SEQUEST default tolerance was accepted for product ions (28). SEQUEST results were further validated with PeptideProphet and ProteinProphet (29,30), using an adjusted probability of ≥0.90 for peptides and ≥0.95 for proteins. Each charge state of a peptide was considered a unique identification.
Protein Quantification
For LC-ESI-MS/MS analysis, proteins were quantified by spectral counting (31-33). To account for proteins that bound nonspecifically to the pre-immune IgY column, spectral counts were normalized to the albumin content of material isolated from the anti-PLTP and pre-immune IgY columns, respectively. The spectral counts for each protein detected in the pre-immune material were then subtracted from those detected in the PLTP complexes. Corrected spectral counts were normalized to the molecular weight of each protein (34). Total protein was quantified by light absorption at 280 nm. ELISAs were used to quantify PLTP (35), apoA-I (AlerCHEK), and clusterin (BioVendor).
Protein Identification by MALDI-TOF/TOF
Proteins separated by SDS-PAGE were digested in the gel with trypsin and analyzed by matrix-assisted laser desorption ionization–time of flight–time of flight (MALDI-TOF/TOF) MS/MS. The proteins were identified by their MS and MS/MS spectra, using the MASCOT search engine (Matrix Science v2.0) (36) and SwissProt protein database (v. 10/25/2004). Database searches were restricted to human proteins (with fixed Cys carbamidomethylation, variable Met oxidation, 50 ppm precursor, and 0.1 Da fragment ion accuracy). Protein identification required a ≥98% confidence based on the MOWSE score.
High Resolution Size-Exclusion Chromatography
Isolated PLTP complexes were subjected to size-exclusion chromatography by FPLC on a Superose 6 column that was eluted at 0.5 mL/min with phosphate-buffered saline (PBS). Fractions (0.5 mL) were collected and assayed for PLTP activity and for PLTP and clusterin mass. Reference and calibration proteins were HDL, LDL, blue dextran, thyroglobulin, ferritin, catalase and aldolase.
PLTP binding and functional studies
Binding of PLTP to proteins identified in the PLTP complexes was quantified by a solid-phase binding assay. Purified protein (100 μL of 5 μg protein/mL in 100mM carbonate buffer, pH 9.6) was incubated in 96-well microtiter plates (MaxiSorpTM, Nunc) at 4°C overnight. Protein-coated wells were washed 3 times with PBS buffer containing 0.05% Tween 20 (PBS-T) (Sigma-Aldrich), and blocked with Starting Block (Pierce Biotechnology) at room temperature for 2 h. Wells were washed 3 times with PBS-T, and then incubated at 37°C with 100 μL of recombinant PLTP (rPLTP; 0.5-5 μg/mL in PBS-T) for 2 h. After 3 washes with PBS-T, PLTP bound to the wells was detected with affinity-isolated polyclonal anti-PLTP antibodies labeled with horseradish peroxidase, with o-phenylenediamine dihydrochloride as substrate. The reaction product was monitored by absorbance at 490 nm. Results were corrected for nonspecific rPLTP binding, using wells lacking protein that were blocked with Starting Block. Standard curves were generated by coating wells with affinity-purified anti-PLTP antibodies, and then incubated with 100μl of rPLTP at concentrations between 25 and 200 ng/mL as described (35).
To determine the effect of protein binding on PLTP function, rPLTP stored at -70°C was thawed and diluted to 20 μg/ml in Tris buffer. PLTP alone, with a test protein (1:2, mol/mol, PLTP:protein), or with phospholipid liposomes containing phosphatidylcholine (PC) and phosphatidylserine (PS) (4:1, mol/mol, PC:PS) was incubated for 1 h at 37°C, and phospholipid transfer activity was determined immediately by measuring the transfer of [14C]phosphatidylcholine from phospholipid liposomes to HDL as described. Briefly, each assay tube contained 50 μl HDL3 with 150 nmol phospholipids, 50 μl 14C-PC-labeled liposomes containing 50 nmol PC, 5 μl test samples, and Tris buffered saline to bring the total assay volume to 400 μl. All samples were incubated at 37°C for 15 min. Donor and acceptor particles were separated by precipitation with dextran sulfate and magnesium chloride (37).
ApoA-I used in these experiments was isolated from delipidated human plasma HDL by ion exchange chromatography (38). The sources of other proteins were: plasma apoE (rPeptide), recombinant clusterin (BioVendor), plasma vitronectin (R & D Systems), plasma protein S, serum two-chain complement C1r and plasma transthyretin (Calbiochem), plasma gluplasminogen and fibrinogen (plasminogen depleted) (Enzyme Research Laboratories), essentially fatty acid-free serum albumin and serum immunoglobulin G (Sigma-Aldrich).
Immunoblot Analysis
Proteins in PLTP complexes were reduced and separated in SDS on either 4%–20% Tris-HCl polyacrylamide gels (BioRad) or 4%–12% polyacrylamide gels in MES buffer (NuPAGE, Invitrogen), transferred to 0.2 μm nitrocellulose or PVDF membranes, and probed with antibodies. PLTP was detected with affinity-purified chicken anti-PLTP antibodies and horseradish peroxidase (HRP)-conjugated goat anti-chicken IgY (Kirkegaard and Perry) with a chemiluminescent substrate (Pierce). Other primary and secondary antibodies were: purified mouse anti-human clusterin monoclonal antibody (BD Pharmingen), murine monoclonal anti-human vitronectin (Quidel), affinity-purified goat anti-human protein S antibody (R&D Systems), affinity-purified goat anti-human complement C1r antibody (R&D Systems), HRP-conjugated goat anti-mouse immunoglobulin specific antibody (BD Pharmingen), and rabbit anti-goat IgG, Fc fragment-specific HRP conjugate (Calbiochem).
Quantitation of Lipids
Phosphatidylcholine (PC), sphingomyelin (SM), triacylglycerol (TAG), total cholesterol, and free cholesterol (FC) were quantified in PLTP complexes using a triple-quadrupole mass spectrometer equipped with an electrospray ion source (39, 40) Cholesteryl ester (CE) was calculated as the difference between total and FC. Molecular weights used to convert the mole contents of these lipids to weight were: PC and SM (710), TAG (850), cholesterol (387), CE (650).
Gene Ontology and Protein-Protein Interaction Analysis
Functional annotation of proteins detected in PLTP complexes was obtained from the Gene Ontology database (http://www.geneontology.org; Gene Ontology Consortium), using the DAVID Bioinformatics Resource (NIAID, NIH v.2007) (41) and BINGO plugin (42) in Cytoscape (43). We also searched PubMed for each protein and the following key words: acute phase response, lipid metabolism, apoptosis, complement and coagulation.
Protein-protein interaction networks were constructed with Cytoscape, using the MiMI plugin interrogating the Michigan Molecular Interactions database (44). Protein identifications (IPIs) were cross-referenced to Uniprot accession numbers.
RESULTS
LC-ESI-MS/MS Reveals that Immunoaffinity-Isolated PLTP Complexes Carry a Diverse Protein Cargo
We used shotgun proteomics to identify the proteins associated with PLTP complexes isolated by immunoaffinity chromatography from the plasma of 8 healthy subjects. After digesting the complexes with trypsin, we analyzed the resulting peptide mixture by LC-MS/MS and matched the peptide tandem mass spectra with spectra derived from sequences in a protein database.
We used two complementary criteria to determine whether a protein was associated with PLTP. First, we applied rigorous criteria for protein identification: (a) detection of at least three unique peptides with a peptide probability of >0.90 by PeptideProphet; (b) a protein probability of >0.95 by ProteinProphet; and (c) detection of the protein in ≥4 independent preparations of PLTP complexes. The ProteinProphet estimated protein false discovery rate with these criteria at <5%. Second, we corrected the protein composition of affinity-isolated PLTP complexes for proteins detected in material eluted from a pre-immune IgY column. To consider an identified protein as a component of the PLTP complexes, we required that the level of spectral counts in the material isolated from the immune column be significantly greater than that of material from pre-immune columns, as assessed by the Mann-Whitney non-parametric U test.
Based on these stringent criteria, our mass spectrometric analysis identified 28 unique proteins (including 3 forms of MASP1 and 3 chains of fibrinogen) in immunoaffinity-isolated PLTP complexes (Table 1). Isoform 1 of PLTP (full length) was identified in all samples. In contrast, isoform 2 (a highly homologous truncated form of PLTP with an F/L variant at residue 109 and deletion of residues 110–141) was not detected. However, because only 1 unique tryptic peptide distinguishes the two isoforms and because detection of individual peptides by MS/MS is probabilistic, the presence of isoform 2 cannot be excluded. Twenty six of the 28 proteins were detected in PLTP complexes isolated from all 8 subjects; carnosine dipeptidase and apoA-II were detected in 7 of the 8 subjects. We identified all 3 chains of fibrinogen and 3 isoforms of mannose-binding lectin-associated serine protease 1 (MASP1). For simplicity, we refer to these as fibrinogen and MASP1, respectively. Thus, we detected 24 proteins in the PLTP complexes (Table 1).
Table 1.
Proteins identified in immunoaffinity-isolated PLTP complexes.
| IPI | Protein | Gene | Spectral counts1 | Moles per complex2 | Mole fraction3 |
|---|---|---|---|---|---|
| IPI00291262 | Clusterin | CLU | 286.3 | 4.1 | 24.4 |
| IPI00298497 | Fibrinogen beta chain | FGB | 100.1 | 1.4 | 8.5 |
| IPI00021891 | Fibrinogen gamma chain | FGG | 94.1 | 1.4 | 8.2 |
| IPI00021885 | Fibrinogen alpha chain | FGA | 93.3 | 0.8 | 4.4 |
| IPI00022432 | Transthyretin | TTR | 24.6 | 1.2 | 7.1 |
| IPI00022733 | PLTP | PLTP | 81.4 | 1.0 | 6.1 |
| IPI00019580 | Plasminogen | PLG | 88.8 | 0.7 | 4.2 |
| IPI00021841 | Apolipoprotein A-I | APOA1 | 28.8 | 0.7 | 3.9 |
| IPI00294004 | Vitamin K-dependent protein S | PROS1 | 52.4 | 0.5 | 3.2 |
| IPI00296165 | Complement C1r subcomponent | C1R | 40.4 | 0.5 | 2.9 |
| IPI00303482 | Fibrinogen-like protein 1 | FGL1 | 23.8 | 0.5 | 2.7 |
| IPI00218732 | Serum paraoxonase/arylesterase 1 | PON1 | 19.2 | 0.4 | 2.6 |
| IPI00298971 | Vitronectin | VTN | 31.3 | 0.4 | 2.6 |
| IPI00022371 | Histidine-rich glycoprotein | HRG | 29.4 | 0.3 | 2.0 |
| IPI00006662 | Apolipoprotein D | APOD | 10.4 | 0.3 | 2.0 |
| IPI00216882 | Mannan-binding lectin serine protease 1 isoform 3 | MASP1 | 19.7 | 0.3 | 2.0 |
| IPI00299307 | Mannan-binding lectin serine protease 1 isoform 1 | MASP1 | 6.5 | 0.1 | 0.3 |
| IPI00290283 | Mannan-binding lectin serine protease 1 isoform 2 | MASP1 | 9.6 | 0.1 | 0.5 |
| IPI00021854 | Apolipoprotein A-II | APOA2 | 10.7 | 0.3 | 1.9 |
| IPI00021842 | Apolipoprotein E | APOE | 16.4 | 0.3 | 1.8 |
| IPI00029061 | Selenoprotein P | SEPP1 | 16.2 | 0.3 | 1.5 |
| IPI00017530 | Ficolin-2 | FCN2 | 12.5 | 0.3 | 1.5 |
| IPI00477597 | Haptoglobin-related protein | HPR | 5.2 | 0.1 | 0.8 |
| IPI00186903 | Apolipoprotein-L1 | APOL1 | 7.8 | 0.1 | 0.8 |
| IPI00044369 | Plexin domain-containing protein 2 | PLXD C2 | 9.2 | 0.1 | 0.6 |
| IPI00024284 | Perlecan | HSPG2 | 65.2 | 0.1 | 0.6 |
| IPI00064667 | Carnosine dipeptidase 1 | CNDP1 | 6.0 | 0.1 | 0.5 |
| IPI00021727 | C4b-binding protein alpha chain | C4BPA | 5.9 | 0.1 | 0.4 |
PLTP complexes (N=8) and non-specifically adsorbed material (N=3) were prepared from fresh human plasma, using affinity-purified chicken anti-PLTP antibodies and pre-immune IgY, respectively. All protein identifications required the detection of at least 3 unique peptides from at least 4 individuals.
Spectral counts. Mean spectral counts detected for each protein in PLTP complexes corrected for spectral counts detected for each protein in non-specifically adsorbed material.
Moles per complex. Based on corrected spectral counts normalized to the albumin content of material isolated from the anti-PLTP and pre-immune columns and the molecular weight of each protein, using the following relationship: Normalized SC = f*[(SCP/SCAlb)PLTP – (SCP/SCAlb)Pre-Immune)]/MWP, where SCP and SCAlb are spectral counts for a given protein and albumin, respectively in either PLTP complex or non-specifically adsorbed material, MWP is the molecular weight of the protein, and f is a scaling factor (106). Details are provided in (34).
Mole fraction. The sum of all proteins detected in the particles was assumed to equal 100%.
Of these 24 proteins, 6 (vitamin K-dependent protein S, perlecan, fibrinogen-like protein 1, ficolin-2, plexin domain-containing protein 2, and mannan-binding lectin serine protease) were not previously known to reside in HDL (25,26,45).
Clusterin and ApoA-I are Major Apolipoproteins in the PLTP Complexes
Studies of model systems strongly support the proposal that spectral counting—summing all the peptide identifications derived from a single protein in an LC-ESI-MS/MS analysis—can quantify proteins in complex mixtures (31-33). To assess the relative abundance of proteins in the PLTP complexes, we therefore used the following strategy. First, we optimized chromatographic conditions to provide extensive data-dependent MS/MS sampling, which is critical for obtaining enough spectral counts to estimate relative protein abundance. Second, after correcting the spectral counts of proteins detected in PLTP complexes for proteins detected in material isolated from a pre-immune IgY column, we normalized the corrected spectral counts to the molecular weight of each protein. Normalization adjusts for the probability that smaller proteins are less likely to yield proteotypic peptides (34,46).
This approach demonstrated that clusterin (apoJ) was the most abundant protein; it accounted for ~25% of the mole fraction in PLTP complexes. The mole fractions of PLTP and apoA-I were ~6% and ~4% (Table 1), respectively, suggesting that the molar ratio of clusterin, PLTP, and apoA-I in PLTP complexes was ~4:1:1.The mole fractions of fibrinogen, transthyretin, and plasminogen ranged from 4%–8%, which were similar to that of PLTP and apoA-I. It is important to note that these results are semi-quantitative, because many factors affect peptide detection by LC-ESI-MS/MS.
We also used externally calibrated ELISAs to quantify the amounts of clusterin, PLTP, and apoA-I in the PLTP complexes. This independent approach indicated a mean molar ratio of ~5:1:1, which is in excellent agreement with the MS results.
SDS-PAGE and MALDI-TOF/TOF Analysis Confirm that Clusterin, Complement C1r, and Fibrinogen Are Major Components of PLTP Complexes
We used SDS-PAGE and MALDI-TOF/TOF to further probe the protein composition of affinity-isolated PLTP complexes. Imperial Blue (Pierce) staining revealed multiple bands of material when the proteins in the complexes were reduced and separated under denaturing conditions (Fig. 1A). We obtained a similar pattern of protein staining with the PLTP complexes isolated from all 8 study subjects. Major protein bands were detected in apparent MW regions around 30, 40, and 80 kDa. Several bands with MWs between 50 and 70kDa were also detected.
Figure 1. Protein composition of PLTP Complexes.
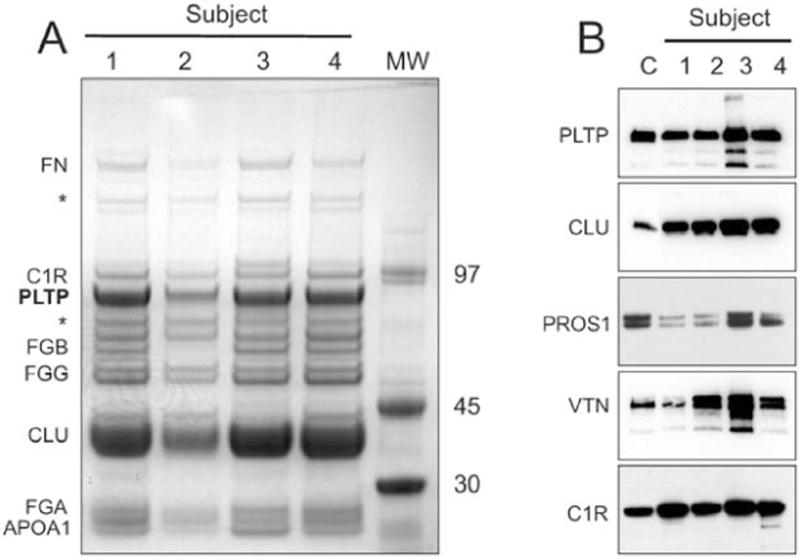
(A) ApoA-I, clusterin, and PLTP in PLTP complexes were identified by SDS-PAGE and MALDI-TOF/TOF. PLTP complexes (2 μg) isolated from 4 plasma samples (lanes 1–4) were reduced, separated on 4%–12% SDS gel, and stained with Imperial Blue stain (Pierce). ApoA-I, clusterin, and PLTP were identified in prominent bands around the 30kDa, 40kDa, and 80 kDa positions by in-gel digestion and mass spectrometry. The apparent MWs of the proteins were deduced from the electrophoretic mobilities of a standard protein mixture. Fibronectin (FN) was shown by proteomics to be a non-specific contaminant. (* - various forms of immunoglobulin identified in the bands) (B) Immunoreactive protein S, vitronectin, and complement factor C1r were identified in PLTP particle. Immunoblot detection of PLTP, clusterin (CLU), protein S (PROS1), vitronectin (VTN), and complement C1r (C1R) in PLTP complexes subjected to SDS-PAGE. Lane C is either purified protein standard (PLTP, CLU, PROS1, VTN) or human plasma (C1R). Lanes 1-4 are PLTP complexes isolated from the plasma of 4 subjects.
To identify the proteins, we excised the stained bands, digested them with trypsin, eluted the peptides, and subjected them to MS/MS analysis by MALDI-TOF/TOF. The major proteins in the 30, 40, and 80 kDa bands were apoA-I, clusterin, and PLTP, respectively. The major proteins within the 50–70 kDa region were identified as different subunits of fibrinogen (FG). The 80 kDa band also contained substantial amounts of the Ig mu-C-chain, presumably derived from immunoglobulins not removed by adsorption to protein A and protein G. Furthermore, a band with an apparent MW of 90 kDa was identified as complement C1r. Each protein migrated with an apparent MW anticipated for the intact protein, indicating that full-length proteins rather than proteolytic fragments associate with PLTP (47). Other major proteins identified by shotgun proteomics but not identified by this approach were plasminogen (expected at ~90 kDa) and transthyretin (expected at ~14 kDa). Their apparent absence most likely resulted from the low resolution of SDS-PAGE (unresolved multiple bands in the 90kDa region) and the limit of detection of Imperial Blue stain.
Immunoblotting Detects Clusterin, Protein S, Vitronectin, and Complement C1r in PLTP Complexes
Immunoblot analysis of proteins separated by SDS-PAGE confirmed that the clusterin, protein S, vitronectin, and C1r that we identified in the proteomic analysis were indeed associated with PLTP complexes. The apparent MWs of the immunoreactive material were consistent with those expected for the full-length proteins (Fig. 1B). Additionally, precipitation of plasma with anti-clusterin yielded a precipitate that contained PLTP by immunoblot (data not shown).
SDS-PAGE and immunoblotting with affinity-isolated anti-PLTP antibody demonstrated that most of the PLTP in the complexes had the expected MW of 80 kDa. In addition, some immunoreactive material was also detected with apparent MWs of 50, 60, and 170 kDa (Fig. 1B). The smaller forms likely represented PLTP fragments or truncated isoform 2, while the larger form presumably was a PLTP dimer.
PLTP Complexes are Heterogeneous in Molecular Size
PLTP complexes isolated from the plasma of 3 subjects were analyzed by high resolution size-exclusion chromatography to determine their molecular sizes and the distribution of clusterin and PLTP. PLTP activity and mass were detected in fractions spanning the entire HDL size range as well as in fractions approaching the size of LDL (Fig. 2). Peak PLTP activity was located in fractions 16–20, with estimated MWs of 400 to 600 kDa, while peak PLTP mass was detected in fractions 13–16, with estimated MWs of 500 to >670 kDa. Of particular importance is that clusterin was present in most of the fractions containing PLTP. Thus, PLTP complexes appear to be heterogeneous, both in size and in lipid transfer activity.
Figure 2. PLTP and clusterin co-elute on size-exclusion chromatography (SEC).
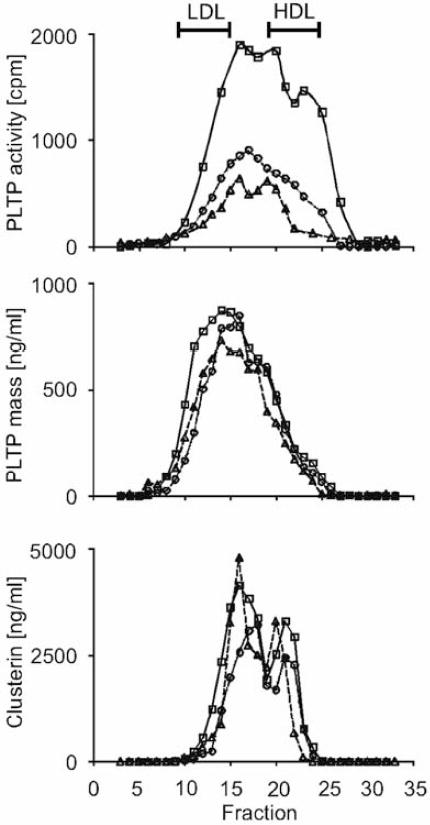
Immunoaffinity isolated PLTP complexes were separated by FPLC, using a Superose 6 10/30 column. Column fractions were assayed for PLTP activity, PLTP mass, and clusterin. The panels, from top to bottom, show the distribution of PLTP activity, PLTP mass, and clusterin mass, respectively, of PLTP complexes isolated from 3 individuals. (Bars at the top indicate where LDL and HDL elute on this SEC column).
PLTP Complexes are Lipid-Poor
Pooled PLTP complexes were analyzed for lipid by isotope dilution MS. Lipids represented ~3% of the mass of apoA-I, PLTP, and clusterin in the complexes, as monitored by ELISA. Thus, PLTP complexes are clearly lipid-poor. The approximate molar ratios of PC, SM, FC, CE, and TAG were 28:11:6:12:22, indicating that core lipids (CE, TAG) accounted for ~35% of the lipid moiety and surface lipids accounted for 65%.
Clusterin and ApoA-I Bind to rPLTP and Stabilize Its Activity
We used two complementary approaches to determine whether PLTP binds to any of the proteins we detected in the PLTP complexes and whether such interactions might be functionally significant. First, we determined whether 9 of the complexes’ abundant proteins can interact with rPLTP in a solid-phase binding assay. For comparison, we included 2 highly abundant plasma proteins, albumin and immunoglobulin G.
Clusterin, apoA-I, apoE, plasminogen, fibrinogen, transthyretin, and complement C1r all bound to rPLTP in this assay (Fig. 3). In contrast, the two control proteins—albumin and immunoglobulin G—failed to interact with rPLTP. We also observed little detectable binding of rPLTP to protein S or vitronectin (data not shown).
Figure 3. PLTP specifically binds to major proteins identified in PLTP complexes.
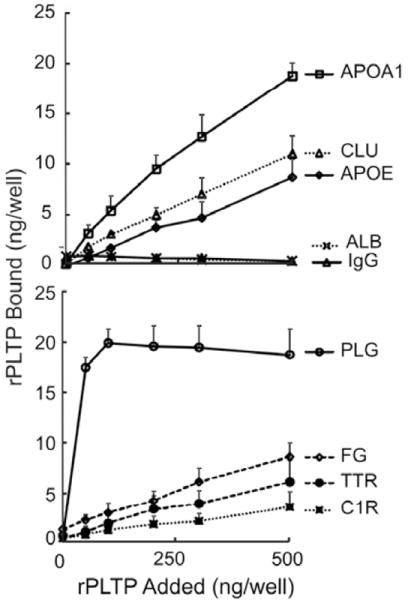
Purified proteins immobilized on microtiter plates were reacted with rPLTP. After extensive washing, PLTP bound to the proteins was detected with anti-PLTP antibodies labeled with horseradish peroxidase; o-phenylenediamine dihydrochloride was used as the substrate. Data represent the mean and standard deviation of 3 experiments for apoA-I (APOA1), apoE (APOE), clusterin (CLU), fibrinogen (FG), plasminogen (PLG), transthyretin (TTR), and complement C1r (C1R) and 2 experiments for human albumin (ALB) and immunoglobulin G (IgG).
To determine if the association of proteins detected in the PLTP complexes might be functionally significant, we took advantage of the fact that rPLTP rapidly loses its lipid transfer activity unless stabilized with phospholipid liposomes. When rPLTP was incubated without liposomes for 1 h at 37°C, it lost ~80% of its activity. Importantly, in the absence of liposomes, apoA-I, clusterin, apoE, and to a lesser extent, C1r, were each able to significantly stabilize PLTP’s lipid transfer activity (Fig. 4). In contrast, fibrinogen, transthyretin, albumin, or immunoglobulins failed to do so, and PLTP activity was significantly lower (p<0.05) in the presence of plasminogen.
Figure 4. ApoA-I, clusterin, and apoE stabilize PLTP’s lipid-transfer activity.
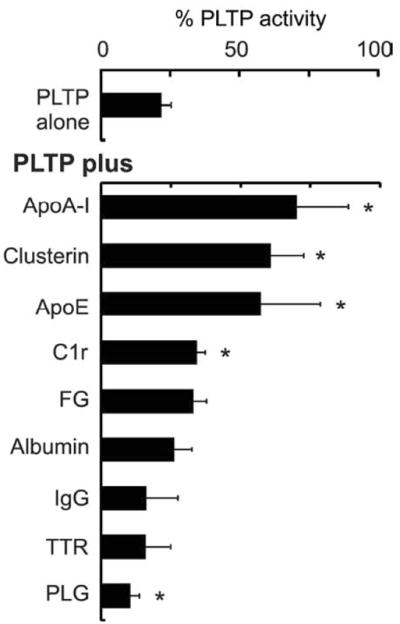
rPLTP was incubated alone or with apoA-I, clusterin, apoE, complement C1r (C1r), fibrinogen (FG), plasminogen (PLG), transthyretin (TTR), albumin, or immunoglobulin G (IgG) at a molar ratio of 1:2 (PLTP:protein) for 1 h at 37°C. The PLTP activity of each incubation mixture was immediately measured and compared with that of rPLTP diluted in phospholipid liposomes and incubated under the same conditions. The data represent the mean and standard deviation of 3 or 4 experiments, and are expressed as the % of the activity of the PLTP sample incubated in liposomes for 1 hr at 37°C. * denotes significantly different from PLTP incubated alone.
Together with the results of the solid-phase binding studies, these data strongly suggest that clusterin, apoA-I, and apoE can bind directly to PLTP and that this interaction stabilizes PLTP’s lipid-transfer activity. In contrast, binding of plasminogen to PLTP may destabilize the protein or inhibit its ability to transfer phospholipids.
DISCUSSION
Proteins and Lipids in PLTP Complexes
PLTP associates with apoA-I and apoE (3,4), and PLTP in plasma co-elutes with HDL on size exclusion chromatography (3,5). However, our observations indicate that PLTP isolated from human plasma associates with an array of proteins that are distinct from those of HDL. We also found that lipid accounts for only 3% of the mass of PLTP complexes. The latter observation, though surprising, is consistent with earlier reports that most plasma PLTP activity resides in a lipoprotein-deficient fraction of density >1.21 g/ml (5,7). Using shotgun proteomics, a global protein identification approach, we identified 24 proteins associated with PLTP, including apoA-I, clusterin, fibrinogen, plasminogen, and C1r. Strikingly, this protein repertoire differed markedly from that of HDL particles isolated by ultracentrifugation and affinity chromatography (25,26,45,48). While apoA-I and apoA-II are the dominant proteins in HDL, clusterin was the major protein identified in the PLTP complexes. Moreover, we detected a number of proteins not known to reside in the HDL fraction, including vitamin K-dependent protein S, perlecan, fibrinogen-like protein 1, ficolin-2, plexin domain-containing protein 2, and mannan-binding lectin serine protease. The observation that 90% of plasma paraoxonase associates with a species of apoA-I particles that also contains clusterin (49) is consistent with our identification of clusterin, paraoxonase, and apoA-I in PLTP complexes.
Molecular Size of PLTP Complexes
The apparent MW of affinity-isolated PLTP complexes (as assessed by both mass and activity) ranged from ~160 to 670 kDa, which is consistent with the size distribution of PLTP in whole plasma (5). Significantly, the clusterin identified in the affinity-isolated PLTP complexes co-eluted with PLTP in size-exclusion chromatography. Together with our finding that PLTP can directly bind clusterin, these observations strongly suggest that PLTP and clusterin directly associate through protein–protein interactions. Both proteomics and biochemical analyses (ELISA) revealed that clusterin, PLTP, and apoA-I accounted for ~25%, 6%, and 4%, respectively, of the mole fraction of proteins in immunoaffinity-isolated PLTP complexes. Previous studies have shown that clusterin and apoA-I associate in the same population of particles, with an estimated molar ratio of ~5:1 (50). Interestingly, we observed a similar mole fraction in our affinity-isolated PLTP complexes. The molar ratio of PLTP to apoA-I in the PLTP complexes was ~1:1. Assuming that each PLTP complex carries one PLTP, one apoA-I, and 4–5 clusterin molecules, the range of apparent MWs would be ~400 to 600 kDa, which is consistent with the particle masses we estimated from size-exclusion chromatography.
Protein–Protein Interactions in the PLTP Complexes
Lipid–protein interactions are thought to play a major role in the formation of lipoprotein particles that contain >30% (by mass) of lipid. Because lipids account for only ~3% of the mass of PLTP complexes, it is likely that protein–protein interactions, rather than protein–lipid interactions, are more important in assembling PLTP complexes. Indeed, 20 of the 24 proteins have experimentally documented protein–protein interactions according to protein–protein interaction databases (Fig.5). Our solid-phase binding studies confirmed that PLTP interacts directly with apoA-I and apoE, as well as with 5 additional major proteins in the complexes, including clusterin, C1r, transthyretin, fibrinogen, and plasminogen (Fig. 3). Significantly, when rPLTP was incubated in lipid-free buffer, its lipid-transfer activity was maintained by including apoA-I, clusterin, or apoE (and partially by complement C1r) in the buffer, suggesting that such interactions are functionally important. Collectively, these observations indicate that protein–protein interactions are likely to determine which proteins reside in PLTP complexes.
Figure 5. Most proteins in PLTP complexes have established protein–protein interactions.
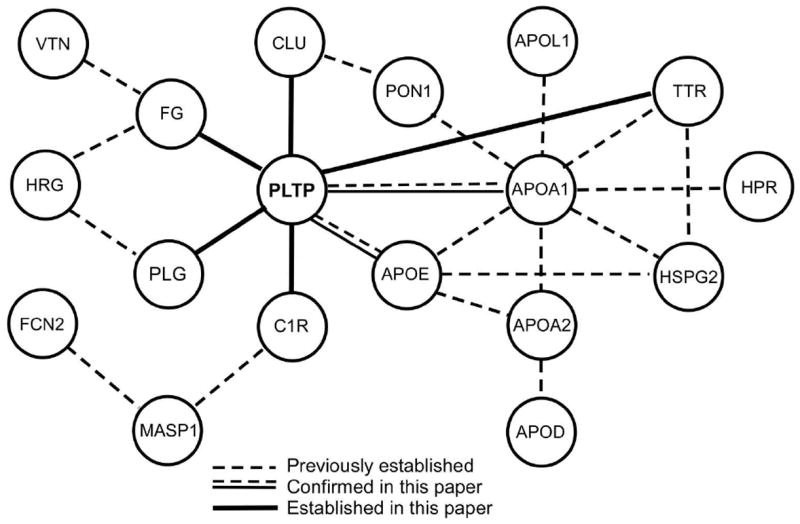
A protein interaction network for the proteins detected in PLTP complexes was constructed, using the MiMI plugin in Cytoscape and the Michigan Molecular Interactions database.
PLTP Complexes Carry Distinct Families of Proteins Related to Inflammation and Immunity
To gain further insight into the possible biological functions of PLTP complexes, we used Gene Ontology analysis and PubMed searches to connect the array of proteins to biological processes. Remarkably, 14 of the 24 proteins were acute-phase-response proteins (p<1 × 10⁻⁴) whose plasma concentrations are altered markedly by both acute and chronic inflammation (Fig. 6). Twelve were involved in innate immunity (p=2 × 10⁻⁵), 8 in complement activation/regulation (p=1 × 10⁻⁵), and only 8 in lipid metabolism (p=4 × 10⁻⁵). Six proteins were also associated with coagulation and thrombosis (p=6 × 10⁻⁷). It is therefore interesting that PLTP, as a member of the lipid transfer/lipopolysaccharide binding protein gene family, is related to LBP and BPI, which play key roles in host responses to Gram-negative bacteria. Studies by Barlage and colleagues (19) have shown that in patients with a bacterial infection with or without severe sepsis, PLTP activity is increased and this increase is paralleled by a redistribution of PLTP into a population of small (120 - 200 kDa) particles. Our earlier studies have shown that PLTP extracts LPS from bacterial membranes (51) and transfers LPS to HDL (18) while other have shown that PLTP can mediate the transfer of LPS from HDL to LDL (52). Also, Oslakovic et al.(53), has recently shown that PLTP mediates the transfer of procoagulant anionic phospholipids to HDL and LDL, thereby neutralizing the effect of the procoagulant liposomes. It is clear that PLTP is an LPS binding protein and PLTP transfers LPS. The increase in PLTP-mediated phospholipid transfer activity in inflammation may represent 1) a protective mechanism against the deleterious effects of LPS in endotoxemia by facilitating the transfer of LPS to HDL and thereby neutralizing it’s activity (24), and 2) the facilitation of the transfer of phospholipid and alpha tocopherol to tissues needed for the protection or regeneration of cellular membranes such as those from vascular endothelial cells, that may be targets of the activated components of the complement and coagulation systems during inflammation (13, 19, 54). The ability of PLTP to transfer phospholipids appears to depend, in part, on the size of the PLTP complexes as large PLTP complexes (520 ±120 kDa; 12 to >17 nm) contain an inactive form of PLTP, while complexes associated with an active form of PLTP are smaller (160 ± 40 kDa) (7.6 – 12 nm) (5, 6). It is not known if the larger inactive PLTP complexes have more lipids than the smaller active PLTP complexes as would be expected if these complexes possess a structure similar to HDL particles. However, as these complexes appear to possess as little as 3% lipid, their structure presumably differs from bulk HDL particles. The fact that these PLTP complexes contain little lipid may actually enhance their ability to shuttle phospholipids to and from cell surfaces and thereby modulate inflammation and the host defense response. Collectively, these observations strongly suggest that PLTP may play previously unsuspected roles in modulating innate immunity, and may also regulate the complement and coagulation cascades, other key components of the host response to infection and tissue damage.
Figure 6. The proteome of PLTP complexes associates with components of the immune system.
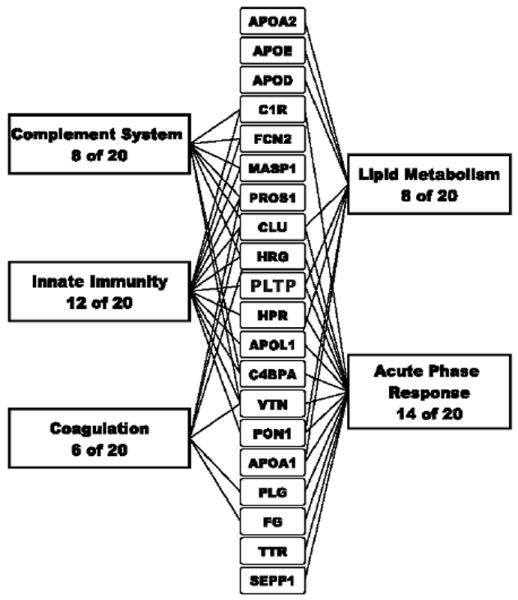
Using Gene Ontology annotation analysis and PubMed searches, we assigned major functional categories to the proteins that associated specifically with PLTP in plasma.
Summary
PLTP is expressed in many tissues with various functions (1). Significantly, it is also expressed by macrophages (2), key cells of the innate immune system, and macrophage PLTP contributes significantly to plasma PLTP levels in mouse models (55). The wide array of functionally distinct proteins detected in our affinity-isolated PLTP complexes and the size heterogeneity of those complexes may reflect multiple origins and functions of plasma PLTP. Interestingly, most of the proteins we found associated with PLTP have established functions in inflammation and immunity. Thus besides participating in lipid transport, PLTP may play previously unsuspected roles in immune responses and inflammatory pathways. Furthermore, our results indicate that affinity-isolated PLTP complexes, while lipid-poor, are dominated by clusterin and that most of their proteins are known to interact directly with each other. Therefore, protein–protein interactions—rather than lipid–protein interactions—likely drive the assembly of plasma PLTP complexes.
Acknowledgments
We thank Dr. Judy Harmony for providing highly purified clusterin isolated from human plasma, Hal Kennedy for preparing the figures, and Ilona Babenko for technical assistance.
Abbreviations and Textual Footnotes
- BPI
bactericidal permeability-increasing protein
- HDL
high density lipoproteins
- LBP
lipopolysaccharide-binding protein
- LDL
low density lipoprotein
- PC
phosphatidylcholine
- PLTP
phospholipid transfer protein
- PS
phosphatidylserine
- rPLTP
recombinant PLTP
for other proteins and corresponding gene names see Table 1
Footnotes
This study was supported by grants (H030086, HL086798) from the National Institutes of Health. TV was supported by a Pilot and Feasibility Award from the Diabetes and Endocrinology Research Center (NIH 5 P30 DK17047), and Scientist Development Grant Award from American Heart Association 0830231N. Mass spectrometry experiments were supported by the Mass Spectrometry Resource, Department of Medicine, and the Mass Spectrometry Core, Diabetes and Endocrinology Research Center, University of Washington.
References
- 1.Albers JJ, Wolfbauer G, Cheung MC, Day JR, Ching AF, Lok S, Tu AY. Functional expression of human and mouse plasma phospholipid transfer protein: effect of recombinant and plasma PLTP on HDL subspecies. Biochim Biophys Acta. 1995;1258:27–34. doi: 10.1016/0005-2760(95)00091-p. [DOI] [PubMed] [Google Scholar]
- 2.Desrumaux CM, Mak PA, Boisvert WA, Masson D, Stupack D, Jauhiainen M, Ehnholm C, Curtiss LK. Phospholipid transfer protein is present in human atherosclerotic lesions and is expressed by macrophages and foam cells. J Lipid Res. 2003;44:1453–1461. doi: 10.1194/jlr.M200281-JLR200. [DOI] [PubMed] [Google Scholar]
- 3.Cheung MC, Albers JJ. Active plasma phospholipid transfer protein is associated with apoA-I- but not apoE-containing lipoproteins. J Lipid Res. 2006;47:1315–1321. doi: 10.1194/jlr.M600042-JLR200. [DOI] [PubMed] [Google Scholar]
- 4.Karkkainen M, Oka T, Olkkonen VM, Metso J, Hattori H, Jauhiainen M, Ehnholm C. Isolation and partial characterization of the inactive and active forms of human plasma phospholipid transfer protein (PLTP) J Biol Chem. 2002;277:15413–15418. doi: 10.1074/jbc.M112247200. [DOI] [PubMed] [Google Scholar]
- 5.Oka T, Kujiraoka T, Ito M, Egashira T, Takahashi S, Nanjee MN, Miller NE, Metso J, Olkkonen VM, Ehnholm C, Jauhiainen M, Hattori H. Distribution of phospholipid transfer protein in human plasma: presence of two forms of phospholipid transfer protein, one catalytically active and the other inactive. J Lipid Res. 2000;41:1651–1657. [PubMed] [Google Scholar]
- 6.Murdoch SJ, Wolfbauer G, Kennedy H, Marcovina SM, Carr MC, Albers JJ. Differences in reactivity of antibodies to active versus inactive PLTP significantly impacts PLTP measurement. J Lipid Res. 2002;43:281–289. [PubMed] [Google Scholar]
- 7.Tall AR, Forester LR, Bongiovanni GL. Facilitation of phosphatidylcholine transfer into high density lipoproteins by an apolipoprotein in the density 1.20-1.26 g/ml fraction of plasma. J Lipid Res. 1983;24:277–289. [PubMed] [Google Scholar]
- 8.Tall AR, Krumholz S, Olivecrona T, Deckelbaum RJ. Plasma phospholipid transfer protein enhances transfer and exchange of phospholipids between very low density lipoproteins and high density lipoproteins during lipolysis. J Lipid Res. 1985;26:842–851. [PubMed] [Google Scholar]
- 9.Tollefson JH, Ravnik S, Albers JJ. Isolation and characterization of a phospholipid transfer protein (LTP-II) from human plasma. J Lipid Res. 1988;29:1593–1602. [PubMed] [Google Scholar]
- 10.Albers JJ, Cheung MC. Emerging roles for phospholipid transfer protein in lipid and lipoprotein metabolism. Curr Opin Lipidol. 2004;15:255–260. doi: 10.1097/00041433-200406000-00004. [DOI] [PubMed] [Google Scholar]
- 11.Van Tol A, Jauhiainen M, De Crom R, Ehnholm C. Role of phospholipid transfer protein in high-density lipoprotein metabolism: insights from studies in transgenic mice. Int J Tissue React. 2000;22:79–84. [PubMed] [Google Scholar]
- 12.Nishida HI, Nishida T. Phospholipid transfer protein mediates transfer of not only phosphatidylcholine but also cholesterol from phosphatidylcholine-cholesterol vesicles to high density lipoproteins. J Biol Chem. 1997;272:6959–6964. doi: 10.1074/jbc.272.11.6959. [DOI] [PubMed] [Google Scholar]
- 13.Desrumaux C, Deckert V, Athias A, Masson D, Lizard G, Palleau V, Gambert P, Lagrost L. Plasma phospholipid transfer protein prevents vascular endothelium dysfunction by delivering alpha-tocopherol to endothelial cells. FASEB J. 1999;13:883–892. doi: 10.1096/fasebj.13.8.883. [DOI] [PubMed] [Google Scholar]
- 14.Wolfbauer G, Albers JJ, Oram JF. Phospholipid transfer protein enhances removal of cellular cholesterol and phospholipids by high-density lipoprotein apolipoproteins. Biochim Biophys Acta. 1999;1439:65–76. doi: 10.1016/s1388-1981(99)00077-3. [DOI] [PubMed] [Google Scholar]
- 15.Oram JF, Wolfbauer G, Vaughan AM, Tang C, Albers JJ. Phospholipid transfer protein interacts with and stabilizes ATP-binding cassette transporter A1 and enhances cholesterol efflux from cells. J Biol Chem. 2003;278:52379–52385. doi: 10.1074/jbc.M310695200. [DOI] [PubMed] [Google Scholar]
- 16.Huuskonen J, Olkkonen VM, Jauhiainen M, Ehnholm C. The impact of phospholipid transfer protein (PLTP) on HDL metabolism. Atherosclerosis. 2001;155:269–281. doi: 10.1016/s0021-9150(01)00447-6. [DOI] [PubMed] [Google Scholar]
- 17.Albers JJ, Tu AY, Wolfbauer G, Cheung MC, Marcovina SM. Molecular biology of phospholipid transfer protein. Curr Opin Lipidol. 1996;7:88–93. doi: 10.1097/00041433-199604000-00007. [DOI] [PubMed] [Google Scholar]
- 18.Hailman E, Albers JJ, Wolfbauer G, Tu AY, Wright SD. Neutralization and transfer of lipopolysaccharide by phospholipid transfer protein. J Biol Chem. 1996;271:12172–12178. doi: 10.1074/jbc.271.21.12172. [DOI] [PubMed] [Google Scholar]
- 19.Barlage S, Frohlich D, Bottcher A, Jauhiainen M, Muller HP, Noetzel F, Rothe G, Schutt C, Linke RP, Lackner KJ, Ehnholm C, Schmitz G. ApoE-containing high density lipoproteins and phospholipid transfer protein activity increase in patients with a systemic inflammatory response. J Lipid Res. 2001;42:281–290. [PubMed] [Google Scholar]
- 20.Pussinen PJ, Metso J, Malle E, Barlage S, Palosuo T, Sattler W, Schmitz G, Jauhiainen M. The role of plasma phospholipid transfer protein (PLTP) in HDL remodeling in acute-phase patients. Biochim Biophys Acta. 2001;1533:153–163. doi: 10.1016/s1388-1981(01)00153-6. [DOI] [PubMed] [Google Scholar]
- 21.Levels JHM, Pajkrt D, Schultz M, Hoek FJ, van Tol A, Meijers JCM, van Deventer SJH. Alterations in lipoprotein homeostasis during human experimental endotoxemia and clinical sepsis. Biochim Biophys Acta. 2007;1771:1429–1438. doi: 10.1016/j.bbalip.2007.10.001. [DOI] [PubMed] [Google Scholar]
- 22.Tan KC, Shiu SW, Wong Y, Tam S. Plasma phospholipid transfer protein activity and subclinical inflammation in type 2 diabetes mellitus. Atherosclerosis. 2005;178:365–370. doi: 10.1016/j.atherosclerosis.2004.09.005. [DOI] [PubMed] [Google Scholar]
- 23.Cheung MC, Brown BG, Marino Larsen EK, Frutkin AD, O’Brien KD, Albers JJ. Phospholipid transfer protein activity is associated with inflammatory markers in patients with cardiovascular disease. Biochim Biophys Acta. 2006;1762:131–137. doi: 10.1016/j.bbadis.2005.09.002. [DOI] [PubMed] [Google Scholar]
- 24.Gautier T, Klein A, Deckert V, Desrumaux C, Ogier N, Sberna AL, Paul C, Le Guern N, Athias A, Montange T, Monier S, Piard F, Jiang XC, Masson D, Lagrost L. Effect of plasma phospholipid transfer protein deficiency on lethal endotoxemia in mice. J Biol Chem. 2008;283:18702–18710. doi: 10.1074/jbc.M802802200. [DOI] [PubMed] [Google Scholar]
- 25.Vaisar T, Pennathur S, Green PS, Gharib SA, Hoofnagle AN, Cheung MC, Byun J, Vuletic S, Kassim S, Singh P, Chea H, Knopp RH, Brunzell J, Geary R, Chait A, Zhao XQ, Elkon K, Marcovina S, Ridker P, Oram JF, Heinecke JW. Shotgun proteomics implicates protease inhibition and complement activation in the antiinflammatory properties of HDL. J Clin Invest. 2007;117:746–756. doi: 10.1172/JCI26206. [DOI] [PMC free article] [PubMed] [Google Scholar]
- 26.Heller M, Schlappritzi E, Stalder D, Nuoffer JM, Haeberli A. Compositional protein analysis of high density lipoproteins in hypercholesterolemia by shotgun LC-MS/MS and probabilistic peptide scoring. Mol Cell Proteomics. 2007;6:1059–1072. doi: 10.1074/mcp.M600326-MCP200. [DOI] [PubMed] [Google Scholar]
- 27.Kersey PJ, Duarte J, Williams A, Karavidopoulou Y, Birney E, Apweiler R. The International Protein Index: An integrated database for proteomics experiments. Proteomics. 2004;4:1985–1988. doi: 10.1002/pmic.200300721. [DOI] [PubMed] [Google Scholar]
- 28.Eng JK, McCormack AL, Yates JR. An approach to correlate tandem mass spectral data of peptides with amino acid sequences in a protein database. J Am Soc Mass Spectrom. 1994;5:976–989. doi: 10.1016/1044-0305(94)80016-2. [DOI] [PubMed] [Google Scholar]
- 29.Keller A, Nesvizhskii AI, Kolker E, Aebersold R. Empirical statistical model to estimate the accuracy of peptide identifications made by MS/MS and database search. Anal Chem. 2002;74:5383–5392. doi: 10.1021/ac025747h. [DOI] [PubMed] [Google Scholar]
- 30.Nesvizhskii AI, Keller A, Kolker E, Aebersold R. A statistical model for identifying proteins by tandem mass spectrometry. Anal Chem. 2003;75:4646–4658. doi: 10.1021/ac0341261. [DOI] [PubMed] [Google Scholar]
- 31.Liu H, Sadygov RG, Yates JR., 3rd A model for random sampling and estimation of relative protein abundance in shotgun proteomics. Anal Chem. 2004;76:4193–4201. doi: 10.1021/ac0498563. [DOI] [PubMed] [Google Scholar]
- 32.Old WM, Meyer-Arendt K, Aveline-Wolf L, Pierce KG, Mendoza A, Sevinsky JR, Resing KA, Ahn NG. Comparison of label-free methods for quantifying human proteins by shotgun proteomics. Mol Cell Proteomics. 2005;4:1487–1502. doi: 10.1074/mcp.M500084-MCP200. [DOI] [PubMed] [Google Scholar]
- 33.Fu X, Gharib SA, Green PS, Aitken ML, Frazer DA, Park DR, Vaisar T, Heinecke JW. Spectral index for assessment of differential protein expression in shotgun proteomics. J Proteome Res. 2008;7:845–854. doi: 10.1021/pr070271+. [DOI] [PubMed] [Google Scholar]
- 34.Zybailov B, Coleman MK, Florens L, Washburn MP. Correlation of relative abundance ratios derived from peptide ion chromatograms and spectrum counting for quantitative proteomic analysis using stable isotope labeling. Anal Chem. 2005;77:6218–6224. doi: 10.1021/ac050846r. [DOI] [PubMed] [Google Scholar]
- 35.Cheung MC, Wolfbauer G, Deguchi H, Fernandez JA, Griffin JH, Albers JJ. Human plasma phospholipid transfer protein specific activity is correlated with HDL size: Implications for lipoprotein physiology. Biochim Biophys Acta. 2009;1791:206–211. doi: 10.1016/j.bbalip.2008.12.010. [DOI] [PMC free article] [PubMed] [Google Scholar]
- 36.Perkins DN, Pappin DJ, Creasy DM, Cottrell JS. Probability-based protein identification by searching sequence databases using mass spectrometry data. Electrophoresis. 1999;20:3551–3567. doi: 10.1002/(SICI)1522-2683(19991201)20:18<3551::AID-ELPS3551>3.0.CO;2-2. [DOI] [PubMed] [Google Scholar]
- 37.Cheung MC, Wolfbauer G, Albers JJ. Plasma phospholipid mass transfer rate: relationship to plasma phospholipid and cholesteryl ester transfer activities and lipid parameters. Biochim Biophys Acta. 1996;1303:103–110. doi: 10.1016/0005-2760(96)00082-3. [DOI] [PubMed] [Google Scholar]
- 38.Cheung MC, Albers JJ. The measurement of apolipoprotein A-I and A-II levels in men and women by immunoassay. J Clin Invest. 1977;60:43–50. doi: 10.1172/JCI108767. [DOI] [PMC free article] [PubMed] [Google Scholar]
- 39.Cheng H, Jiang X, Han X. Alterations in lipid homeostasis of mouse dorsal root ganglia induced by apolipoprotein E deficiency: a shotgun lipidomics study. J Neurochem. 2007;101:57–76. doi: 10.1111/j.1471-4159.2006.04342.x. [DOI] [PMC free article] [PubMed] [Google Scholar]
- 40.Yang K, Cheng H, Gross RW, Han X. Automated lipid identification and quantification by multidimensional mass spectrometry-based shotgun lipidomics. Anal Chem. 2009;81:4356–4368. doi: 10.1021/ac900241u. [DOI] [PMC free article] [PubMed] [Google Scholar]
- 41.Dennis G, Jr, Sherman BT, Hosack DA, Yang J, Gao W, Lane HC, Lempicki RA. DAVID: Database for Annotation, Visualization, and Integrated Discovery. Genome Biol. 2003;4:P3. [PubMed] [Google Scholar]
- 42.Maere S, Heymans K, Kuiper M. BiNGO: a Cytoscape plugin to assess overrepresentation of gene ontology categories in biological networks. Bioinformatics. 2005;21:3448–3449. doi: 10.1093/bioinformatics/bti551. [DOI] [PubMed] [Google Scholar]
- 43.Shannon P, Markiel A, Ozier O, Baliga NS, Wang JT, Ramage D, Amin N, Schwikowski B, Ideker T. Cytoscape: a software environment for integrated models of biomolecular interaction networks. Genome Res. 2003;13:2498–2504. doi: 10.1101/gr.1239303. [DOI] [PMC free article] [PubMed] [Google Scholar]
- 44.Gao J, Ade AS, Tarcea VG, Weymouth TE, Mirel BR, Jagadish HV, States DJ. Integrating and annotating the interactome using the MiMI plugin for cytoscape. Bioinformatics. 2009;25:137–138. doi: 10.1093/bioinformatics/btn501. [DOI] [PMC free article] [PubMed] [Google Scholar]
- 45.Rezaee F, Casetta B, Levels JH, Speijer D, Meijers JC. Proteomic analysis of high-density lipoproteins. Proteomics. 2006;6:721–730. doi: 10.1002/pmic.200500191. [DOI] [PubMed] [Google Scholar]
- 46.Paoletti AC, Parmely TJ, Tomomori-Sato C, Sato S, Zhu D, Conaway RC, Conaway JW, Florens L, Washburn MP. Quantitative proteomic analysis of distinct mammalian Mediator complexes using normalized spectral abundance factors. Proc Natl Acad Sci U S A. 2006;103:18928–18933. doi: 10.1073/pnas.0606379103. [DOI] [PMC free article] [PubMed] [Google Scholar]
- 47.Hortin GL, Shen RF, Martin BM, Remaley AT. Diverse range of small peptides associated with high-density lipoprotein. Biochem Biophys Res Commun. 2006;340:909–915. doi: 10.1016/j.bbrc.2005.12.098. [DOI] [PMC free article] [PubMed] [Google Scholar]
- 48.Davidson WS, Silva RA, Chantepie S, Lagor WR, Chapman MJ, Kontush A. Proteomic analysis of defined HDL subpopulations reveals particle-specific protein clusters: relevance to antioxidative function. Arterioscler Thromb Vasc Biol. 2009;29:870–876. doi: 10.1161/ATVBAHA.109.186031. [DOI] [PMC free article] [PubMed] [Google Scholar]
- 49.Blatter MC, James RW, Messmer S, Barja F, Pometta D. Identification of a distinct human high-density lipoprotein subspecies defined by a lipoprotein-associated protein, K-45. Identity of K-45 with paraoxonase. Eur J Biochem. 1993;211:871–879. doi: 10.1111/j.1432-1033.1993.tb17620.x. [DOI] [PubMed] [Google Scholar]
- 50.Stuart WD, Krol B, Jenkins SH, Harmony JAK. Structure and stability of apolipoprotein J-containing high-density lipoproteins. Biochemistry. 1992;31:8552–8559. doi: 10.1021/bi00151a024. [DOI] [PubMed] [Google Scholar]
- 51.Vesy CJ, Kitchens RL, Wolfbauer G, Albers JJ, Munford RS. Lipopolysaccharide-binding protein and phospholipid transfer protein release lipopolysaccharides from gram-negative bacterial membranes. Infect Immun. 2000;68:2410–2417. doi: 10.1128/iai.68.5.2410-2417.2000. [DOI] [PMC free article] [PubMed] [Google Scholar]
- 52.Levels JHM, Marquart JA, Abraham PR, van den Ende AE, Molhuizen HOF, van Deventer SJH, Meijers JC. Lipopolysaccharide is transferred from high-density to low-density lipoproteins by lipopolysaccharide-binding protein and phospholipid transfer protein. Infect Immun. 2005;73:2321–2326. doi: 10.1128/IAI.73.4.2321-2326.2005. [DOI] [PMC free article] [PubMed] [Google Scholar]
- 53.Oslakovic C, Jauhiainen M, Ehnholm C, Dahlbäck B. The role of phospholipid transfer protein in lipoprotein-mediated neutralization of the procoagulant effect of anionic liposomes. J Thromb Haemost. 2010;8:766–772. doi: 10.1111/j.1538-7836.2010.03744.x. [DOI] [PubMed] [Google Scholar]
- 54.Pownall HJ, Hickson-Bick D, Massey JB. Effects of hydrophobicity on turnover of plasma high density lipoproteins labeled with phosphatidylcholine ethers in the rat. J Lipid Res. 1991;32:793–800. [PubMed] [Google Scholar]
- 55.Vikstedt R, Ye D, Metso J, Hildebrand RB, Van Berkel TJ, Ehnholm C, Jauhiainen M, Van Eck M. Macrophage phospholipid transfer protein contributes significantly to total plasma phospholipid transfer activity and its deficiency leads to diminished atherosclerotic lesion development. Arterioscler Thromb Vasc Biol. 2007;27:5785–5786. doi: 10.1161/01.ATV.0000254815.49414.be. [DOI] [PubMed] [Google Scholar]