Abstract
Effects of previous strength training can be long-lived, even after prolonged subsequent inactivity, and retraining is facilitated by a previous training episode. Traditionally, such “muscle memory” has been attributed to neural factors in the absence of any identified local memory mechanism in the muscle tissue. We have used in vivo imaging techniques to study live myonuclei belonging to distinct muscle fibers and observe that new myonuclei are added before any major increase in size during overload. The old and newly acquired nuclei are retained during severe atrophy caused by subsequent denervation lasting for a considerable period of the animal’s lifespan. The myonuclei seem to be protected from the high apoptotic activity found in inactive muscle tissue. A hypertrophy episode leading to a lasting elevated number of myonuclei retarded disuse atrophy, and the nuclei could serve as a cell biological substrate for such memory. Because the ability to create myonuclei is impaired in the elderly, individuals may benefit from strength training at an early age, and because anabolic steroids facilitate more myonuclei, nuclear permanency may also have implications for exclusion periods after a doping offense.
Keywords: muscle memory, muscle nuclei, muscle atrophy, muscle hypertrophy, apoptosis
Individuals with a history of previous training acquire force quickly on retraining (1, 2), and this commonly observed phenomenon has been dubbed “muscle memory.” There is no known mechanism for memory in muscle cells, and, to date, the long-lasting effects of previous training have been attributed to motor learning in the central nervous system (3). However, it has been reported that muscles can remain hypertrophic after several months of detraining (1, 4–8). In one study on elderly individuals who had strength-trained, force was still 9–14% higher even after 2 y of detraining (7). During 30–32 wk of detraining, a group of women lost a considerable part of the extra strength obtained by 20 wk of previous training but regained the strength after only 6 wk of retraining (1). This suggests the possible presence of a local memory mechanism in the muscle. The present data may provide such a mechanism in that there is a lasting change of cytoarchitectural features after an episode of overload hypertrophy, even after subsequent prolonged disuse.
It has been suggested for more than 100 y that a nucleus can only support a certain volume of cytoplasm (9–19). Muscle cells can be five orders of magnitude larger than mononucleated cells, and muscle fibers are one of the very few multinuclear cell types in vertebrates (18). When the muscle fibers increase in size, it has been believed that nuclei are added by mitosis and subsequent fusion of muscle stem cells to the muscle fibers and that the “excess” myonuclei are removed by selective apoptosis of some of the nuclei during atrophy (20, 21). Such mechanisms would serve to keep the cytoplasmic nuclear domain size constant.
Recent evidence with time-lapse in vivo imaging techniques has challenged this simple model, because it has been shown that normal levels of myonuclei are preserved during atrophy (22). This might, however, be different in hypertrophic muscles, because nuclei within the muscle tissue that have undergone mitosis during development of hypertrophy are particularly prone to apoptosis during subsequent disuse (23). The present data show that myonuclei newly recruited by overload are kept for at least 3 mo after subsequent denervation. This lasting change in the number of myonuclei might provide a substrate for a type of “memory” in muscle cells.
Results
Newly Acquired Myonuclei Precede Hypertrophy.
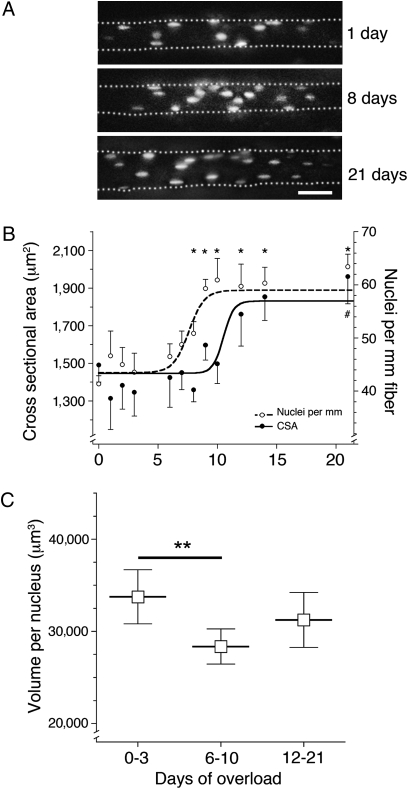
Extensor digitorum longus (EDL) muscles were overloaded by partially ablating their major synergist (day 0), and nuclei of single muscle fibers were visualized in the intact animal by injection of labeled nucleotides 1–21 days after ablation (Fig. 1A). The number of nuclei and the cross-sectional area (CSA) were determined from observing the distal half of each fiber in the microscope. During the 21-day period, CSA increased 35% from 1,474 ± 93 μm2 to 1,991 ± 150 μm2, whereas the number of myonuclei increased 54% from 41 ± 1.5 nuclei per millimeter of fiber length to 63 ± 2.3 nuclei per millimeter of fiber length (Fig. 1A). The number of nuclei started to rise after 6 days and seemed to stabilize after 11 days. This preceded the rise in CSA, which was increased only after 9 days and stabilized after 14 days (Fig. 1B). This time sequence was confirmed in individual fibers by calculating the cytoplasmic volume per nucleus for each fiber. This volume decreased 16% from 33,749 ± 1,457 μm3 at 0–3 days after overload to 28,360 ± 956 μm3 at 6–10 days after overload (P ≤ 0.01). The average volume (31,235 ± 1,476 μm3) remained lower but was not statistically different from that of the controls 12–21 days after overload.
Fig. 1.
Effect of overload on fiber size and number of myonuclei studied in vivo. (A) Micrographs of fibers after overload. Nuclei are labeled with fluorescent oligonucleotides. Illustrations represent merged stacks of images from different focal planes. (Scale bar: 50 μm.) (B) Number of nuclei per millimeter and CSA. Each data point represents 5–24 fibers from a total of 36 animals. Symbols represent the mean ± SEM. A nonlinear fit using a Sigmoid dose–response curve was used for the increase in CSA and nuclei per millimeter, resulting in R2 = 0.13 and R2 = 0.29, respectively. *Nuclei per millimeter; #CSA significantly different from day 0 (P < 0.05). (C) Nuclear domains. Each symbol represents the binned time groups calculated from the dataset in B. **Statistical differences between the indicated time groups (P < 0.01).
Elevated Number of Nuclei Persisted During Subsequent Disuse.
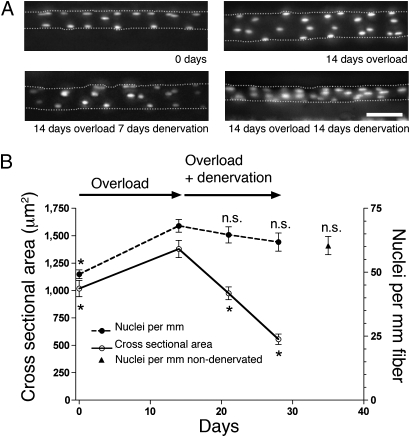
In a separate series of experiments, overload was introduced for 14 days. The number of nuclei increased by 37% from 49 ± 1.8 nuclei per millimeter to 67 ± 2.4 nuclei per millimeter, and CSA was increased by 35% from 1,018 ± 73 μm2 to 1,379 ± 78 μm2 (Fig. 2). In a parallel group of animals, the muscle was subsequently denervated for 14 days. During this period, CSA decreased to 555 ± 48 μm2, which is 40% of the top value. Despite the atrophy, the number of nuclei was not significantly reduced (Fig. 2). The small nonsignificant reduction in nuclear number was similar in muscles that were not denervated but just synergist-ablated for 35 days (Fig. 2B, ▲).
Fig. 2.
Effect of denervation on overloaded muscles studied in vivo. (A) Micrographs of fibers after overload and subsequent denervation. Nuclei are labeled with fluorescent oligonucleotides. Illustrations represent merged stacks of images from different focal planes. (Scale bar: 50 μm.) (B) Quantification of nuclei per millimeter of fiber length and CSA of single fibers after denervation of hypertrophied muscle. Each data point represents the mean ± SEM (n = 23–35 fibers from six to eight animals). Muscles were synergist-ablated and not denervated for 35 days (▲). *Statistical significance difference (P < 0.05). n.s., Nonsignificant difference from 14 days of overload.
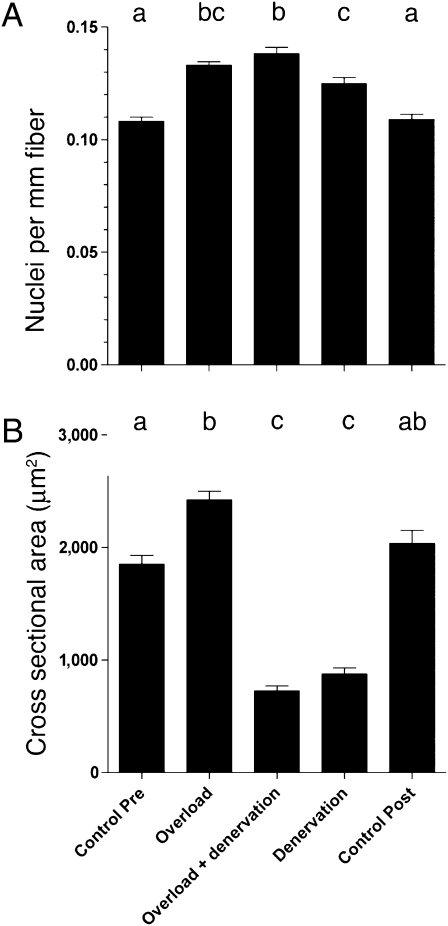
The small diameter of fibers that had been denervated for the long term precluded intracellular injection, and we had to resort to an ex vivo model in a third series of experiments. Muscles were similarly overloaded for 14 days and then denervated for 3 mo. The muscles were fixed in situ, and nuclei were counted in fibers that had been mechanically and chemically isolated. Similar to the in vivo studies, overload led to an increase in the number of nuclei (Fig. 3A) and in CSA (Fig. 3B). The number of nuclei observed after 3 mo of subsequent denervation was not significantly different from that in the overloaded muscles before denervation, but it was significantly higher than that in denervated muscles with no previous history of overload (P ≤ 0.001). The nuclei were maintained in spite of the median CSA being reduced to 23% of the values after overload. Thus, we conclude that overload leads to a lasting increased number of nuclei that are not lost, in spite of subsequent disuse extending over a large part of the mouse lifespan of ≈2 y. There appeared to be a small increase in the number of nuclei by denervation alone, but this could be attributable to reduced fiber length after the long denervation.
Fig. 3.
The effect of long-term denervation on overloaded muscles studied ex vivo. Number of nuclei counted (A) and CSA measured on isolated EDL muscle fibers (B) taken from muscle before the onset of overload (Control Pre), after 14 days of overload (Overload), after 14 days of overload and the subsequent 2 mo of denervation (Overload + Denervation), after 3 mo of denervation (Denervation), and from normal muscles from the same batch of animals that had not been exposed to experimental treatment (Control Post). Each column represents the mean ± SEM of 134–378 fibers. Columns that were statistically indistinguishable (P > 0.05) are marked with the same letter.
Denervation Induces Muscle Apoptosis but Not That of Old or Newly Acquired Myonuclei.
It has previously been suggested that newly acquired nuclei in hypertrophic muscles are particularly prone to apoptosis (23). We therefore investigated apoptosis on sections of denervated muscle using stringent criteria for identification of myonuclei. We stained muscle sections for dystrophin, and only nuclei that had their geometrical center inside the dystrophin-stained ring at the fiber cortex were defined as myonuclei.
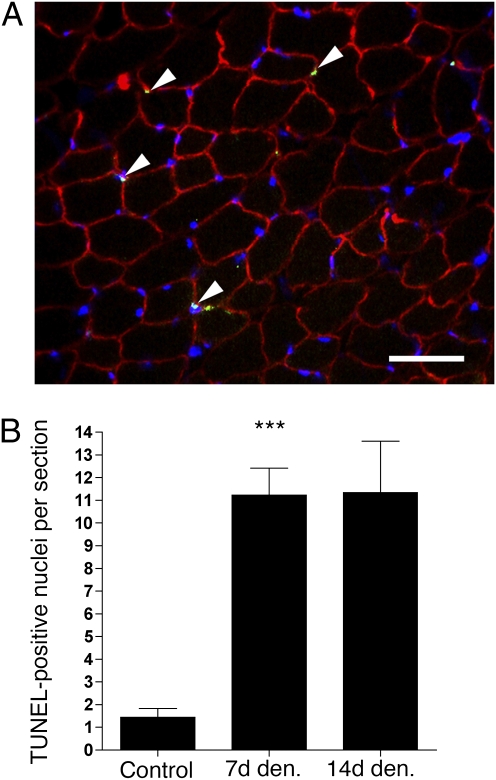
On sections, there was an 8-fold increase in the number of TUNEL-positive nuclei by 14 days of denervation (from 1.3 ± 0.4 to 11.8 ± 2.7 nuclei per section; Fig. 4). However, although about 15,000 myonuclei were screened at 7 and 14 days of denervation, only 1 fulfilled the criterion of being an apoptotic myonucleus. Thus, although there was a dramatic increase in apoptosis by denervation in these muscles, old and newly acquired myonuclei seemed to be excluded from this process. This fits with our observation that myonuclei acquired during hypertrophy are not lost by subsequent disuse.
Fig. 4.
Apoptosis in hypertrophied muscle after denervation (Den.). (A) Triple staining with Hoechst 33342 (blue), TUNEL (green), and antibodies against dystrophin (red). Note that all apoptotic nuclei (arrows) are outside the muscle cells; hence, they are either satellite or stroma cells. (Scale bar: 50 μm.) (B) Number of TUNEL-positive nuclei per section. Each column point represents the mean ± SEM (n = 5–8 sections from four muscles). ***Statistical significance (P < 0.0001).
In evaluating TUNEL staining, one should keep in mind that the time window within which a given nucleus might be identified could be as short as 2 h (24). Thus, in apoptotic tissue, at any given time point, only a few nuclei might be in the correct apoptotic stage to be labeled by TUNEL. If 1 (0.007%) of 15,000 apoptotic myonuclei is accepted as bona fide, this would imply that even when accumulated over a period of 14 days, only about 1% of the myonuclei would be lost as a result of apoptosis (calculation method described in ref. 22).
Previous Hypertrophy Episode Counteracts Disuse Atrophy.
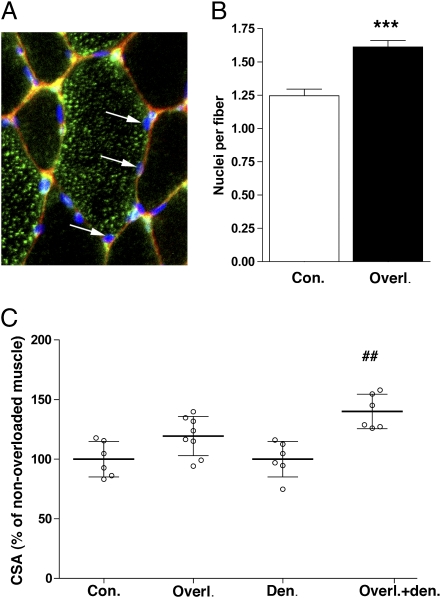
If a hypertrophic episode leads to a lasting higher number of myonuclei, this might provide a long-term advantage even if the stimulus for hypertrophy subsides. The advantage could manifest itself as resistance toward detraining-related atrophy and a more efficient response to retraining. We have taken advantage of the rat overload model in which irradiation studies suggest that satellite cell activation is a prerequisite for the hypertrophy (25) and the hypertrophy develops rather slowly, such that addition of nuclei and subsequent fiber enlargement would be easier to separate (25, 26). To exclude fiber type-related heterogeneity, the analysis concentrated on IIb fibers (Fig. 5A). After 14 days of overload, the number of myonuclei per fiber was increased by 30% (P < 0.0001; Fig. 5B), whereas, on average, the fibers displayed a nonsignificant increase of 16% in CSA (Fig. 5C). Subsequently, both control and overloaded muscles were denervated. After 2 wk under such disuse conditions, both groups atrophied but less so in the previously overloaded group, which ended up being 33% larger than muscles without an overload history (Fig. 5C).
Fig. 5.
Previous hypertrophy episode retards denervation atrophy. (A) Micrograph of a fiber stained for IIb myosin heavy chain (green), dystrophin (red), and nuclei (blue). Arrows indicate myonuclei, defined by having the mass center of the Hoechst stain within the dystrophin ring. (B) Number of nuclei per IIb fiber in normal (Con.) and overloaded (Overl.) muscle. ***Statistical significance (P < 0.0001). (C) Muscle fiber size in muscles overloaded for 14 d (Overl.) relative to nonoverloaded normal muscles (Con.); and muscles overloaded for 14 d and then denervated for 14 d (Overl.+den.) relative to muscles denervated for 14 d (Den.). ##Statistical significance from denervated muscles (P < 0.001).
Discussion
We show that the increase in fiber size during overload hypertrophy is preceded by addition of nuclei; thus, the increase in size could be causally related to the higher total protein synthesis capacity of the larger number of myonuclei. The increase in nuclei seems to be lasting and not dependent on maintaining hypertrophy, because severely atrophied fibers maintain an elevated number of nuclei even after 3 mo of subsequent denervation.
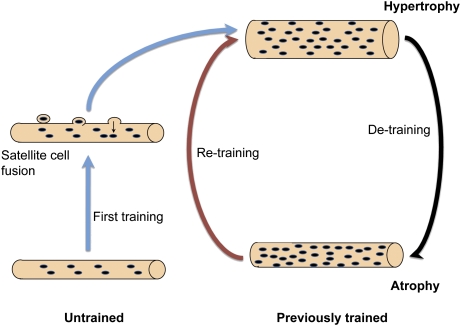
Our data do not support the simple paradigm of a constant myonuclear domain volume in which nuclei are acquired during hypertrophy and then lost during atrophy; thus, we would suggest a different model (Fig. 6) in which previously untrained fibers acquire new nuclei through a “first training route.” These newly acquired nuclei are causally related to the subsequent fiber enlargement, for example, because limitations in the synthetic capacity for each nucleus might be too limited to support the larger domain without increasing the number. On subsequent detraining, the fibers maintain an elevated number of nuclei that might provide resistance to atrophy; on retraining, a gain in size can be obtained by a moderate increase in the protein synthesis rate of each of these many nuclei, skipping the step of adding newly formed nuclei. This shortcut may contribute to the relative ease of retraining compared with the first training of individuals with no previous training history.
Fig. 6.
A model for the connection between muscle size and number of myonuclei. In this model, myonuclei are permanent. Previously untrained muscles acquire newly formed nuclei by fusion of satellite cells preceding the hypertrophy. Subsequent detraining leads to atrophy but no loss of myonuclei. The elevated number of nuclei in muscle fibers that had experienced a hypertrophic episode would provide a mechanism for muscle memory, explaining the long-lasting effects of training and the ease with which previously trained individuals are more easily retrained.
The idea of a persistently increased level of myonuclei after an episode of strength training might have implications for when during the lifespan strength exercise should be administered to the population. Muscle weakness in the elderly is a major health problem (27, 28), and hypertrophy induced by overload is greatly attenuated in older animals (29, 30). The number of myonuclei might be a limiting factor (19). It has been shown that satellite cell activation is impaired in the elderly (31), probably related to reduced Notch signaling between cells (32, 33). Our findings suggest that it may be beneficial to “fill up” muscle fibers with nuclei by exercise before senescence. Anabolic steroids have been shown to increase the number of nuclei (34, 35); thus, the benefits of using steroids might be permanent and should have consequences for the exclusion time after a doping offense.
The source of the newly acquired nuclei during “first training” is most probably satellite cells (36–38). Our approach allowed for a detailed time course analysis and demonstrated that addition of nuclei appeared to be most intense 6–9 days after the introduction of overload; this fits previous observations that hypertrophic stimuli initiate satellite cell mitosis before this time period (39–41). An increase in total protein synthesis (but also in degradation) has already been detected within hours after introducing a hypertrophy stimulus (42–45), including by hypertrophy models similar to ours (46, 47). This has led to speculation that enlargement caused by an increase in synthetic capacity per nucleus precedes addition of nuclei and that nuclei might not be obligatory for hypertrophy. In our experiments, nuclear domain size was decreased during the growth phase and remained lowered for at least 12 days, suggesting that even if protein synthesis per nucleus is boosted during early hypertrophy, this mechanism is not a main factor in increasing the size. Our findings suggest that the increased number of nuclei is a major cause of hypertrophy. They do, however, not preclude that at least some hypertrophy can occur without adding newly formed nuclei, for example, under experimental conditions in which satellite cells are eliminated, such as was discussed recently (48–59).
Alway and colleagues (23) performed an experiment similar to ours when they studied the effect of unloading previously overloaded quail muscles. By combining BrdU staining and TUNEL staining, they showed that nuclei in the muscle tissue that had undergone mitosis during the hypertrophy phase were particularly prone to apoptosis; based on this observation, they suggested that hypertrophy induces a different and less stable population of myonuclei. This conclusion appears to be in contradiction to our findings, but in most of their experiments, no distinction was made between myonuclei and other nuclei in the muscle tissue. Only one example of an apoptotic nucleus inside the dystrophin cortical layer was shown, and the frequency of apoptosis of such positively identified myonuclei was not reported.
In addition to the present detraining study, several studies on atrophy have now failed to demonstrate loss of nuclei or myonuclear apoptosis (22, 60, 61). Given the methodological limitations of results obtained with conventional histology (61), there is currently no compelling evidence that nuclei are ever lost from intact muscle fibers.
Materials and Methods
Animal Experiments.
Female Naval Medical Research Institute (NMRI) mice weighing 20–30 g were used, except for the experiments reported in Fig. 5, in which male Wistar rats weighing 270–370 g were used. The animal experiments were approved by the Norwegian Animal Research Authority and were conducted in accordance with the Norwegian Animal Welfare Act of December 20, 1975. The Norwegian Animal Research Authority provided governance to ensure that facilities and experiments were in accordance with the Animal Welfare Act; National Regulations of January 15, 1996; and European Convention for the Protection of Vertebrate Animals, Use for Experimental and Other Scientific Purposes, of March 18, 1986.
Inhalation gas anesthesia with 2% (vol/vol) isoflurane in air was used for all nonterminal experiments. For terminal experiments, i.p. injections of Equithesin (42.5 mg/mL chloral hydrate and 9.7 mg/mL pentobarbitone; Ullevål Sykehus) at a rate of 5 μL/g body weight were used. All imaging and surgery were performed under deep anesthesia. The depth of anesthesia was checked regularly by pinching the metatarsus region of the limb, and additional doses were given if necessary.
To overload the EDL, approximately two thirds of the distal end of the tibialis anterior muscle was excised.
Denervation was performed by surgically exposing the sciatic nerve in the thigh and then removing a 1-cm-long section of the nerve or by reflecting the nerve and suturing it under the skin to prevent reinnervation. Long-term denervated muscles were checked for reinnervation by stimulating the nerve, and reinnervated muscles were rejected.
In Vivo Myonuclear Imaging.
For staining of nuclei, single EDL fibers were injected with 5′-Oregon Green–labeled phosphorothioate oligonucleotides (5.0 × 10⁻⁴ M; Biognostik) and 2 mg/mL Cascade Blue dextran (Molecular Probes) in an injection buffer [10 mM NaCl, 10 mM Tris (pH 7.5), 0.1 mM EDTA, and 100 mM potassium gluconate], as described previously (18). Satellite cells are not labeled because the oligonucleotides are water-soluble and there are no gap junctions between satellite cells and the muscle fibers (discussion in ref. 18). Unlike satellite cells, stroma cells are outside the basal lamina, and on the rare occasions when the pipette tip was inside such cells, the stroma cells were easily distinguished from the myonuclei.
In vivo imaging was performed essentially as described previously (18, 62, 63). Fiber segments of 250–1,000 μm were analyzed by acquiring images in different focal planes 5 μm apart on an Olympus BX-50WI compound microscope with a 20× 0.3-N.A. working distance water immersion objective. All images were taken with a SIT camera (Hamamatsu C2400-08) coupled to an image processor (Hamamatsu ARGUS-20). By importing the images to a Macintosh computer running Adobe Photoshop (Adobe Systems Incorporated) and ImageJ software (National Institutes of Health), a stack was generated and used to count all the nuclei in the segment. The counting of nuclei was performed by evaluating all the images in each stack.
Ex Vivo Myonuclear Staining
Single myofibers were isolated essentially as described previously (60, 64). Mice were perfused transcardially with 20 mL of 4% (wt/vol) paraformaldehyde diluted in relaxing solution [137 mM NaCl, 5.4 mM KCl, 5 mM MgCl2, 4 mM EGTA, 5 mM Hepes (pH 7)]. The EDL muscles were immediately excised and postfixed in 4% (wt/vol) paraformaldehyde at 4 °C overnight. The muscles were subsequently incubated in a 40% (wt/vol) NaOH solution for 3 h at room temperature, followed by shaking for 8 min in 20% (wt/vol) NaOH and 3× washing in PBS (pH 7.4). Watchmaker’s forceps and a binocular microscope were used to mount single myofibers on a gelatin-coated glass. For visualizing fibers and nuclei, the mounted fibers were stained with hematoxylin and observed through a 20× 0.3-N.A. objective with a measuring ocular for determining distances. Cross-striations were readily visible, and the number of nuclei is expressed per sarcomere to correct for differences in fiber stretch.
Immunohistochemistry
Muscles were excised and embedded in OCT Tissue-Tek (Sakura Finetek Europe B.V.), frozen slightly stretched in melting isopentane, and stored at −80 °C before being cryosectioned at 10 μm. DNA fragmentation associated with apoptosis was detected by TUNEL using a TdT-FragEL detection kit (EMD Biosciences) according to the manufacturer’s instructions. The sections were subsequently blocked in 1% BSA and costained with either antidystrophin or antilaminin monoclonal antibodies (Sigma) at 1:200 and 1:50 dilutions, respectively. Nuclei were finally costained using Hoechst dye 33342 (Invitrogen) at 5 mg/mL in PBS. Nuclei were counted as TUNEL-positive only if colocalization of the Hoechst dye and TUNEL staining was observed. Slides were observed in an Olympus fluorescence microscope with a 60× 0.9-N.A. water immersion objective.
The number of nuclei after overload in rats (Fig. 5) was counted after staining sections with primary antibodies against myosin heavy chain type IIb (BF-F3), dystrophin (Sigma), and Hoechst 33442 (Invitrogen).
Statistics
Effects of inactivity on populations of nuclei were tested by ANOVA and Bonferroni’s post hoc test for multiple comparisons. Numbers are given as mean ± SEM unless stated otherwise.
Acknowledgments
We are grateful to members of our group for valuable comments on the manuscript and to Tove K. Larsen for technical assistance. This study was supported by Norwegian Research Council Grants 191730 and 182717 and by Anti-Doping Norway.
Footnotes
The authors declare no conflict of interest.
This article is a PNAS Direct Submission.
References
- 1.Staron RS, et al. Strength and skeletal muscle adaptations in heavy-resistance-trained women after detraining and retraining. J Appl Physiol. 1991;70:631–640. doi: 10.1152/jappl.1991.70.2.631. [DOI] [PubMed] [Google Scholar]
- 2.Taaffe DR, Marcus R. Dynamic muscle strength alterations to detraining and retraining in elderly men. Clin Physiol. 1997;17:311–324. doi: 10.1111/j.1365-2281.1997.tb00010.x. [DOI] [PubMed] [Google Scholar]
- 3.Rutherford OM, Jones DA. The role of learning and coordination in strength training. Eur J Appl Physiol Occup Physiol. 1986;55:100–105. doi: 10.1007/BF00422902. [DOI] [PubMed] [Google Scholar]
- 4.MacDougall JD, Elder GC, Sale DG, Moroz JR, Sutton JR. Effects of strength training and immobilization on human muscle fibres. Eur J Appl Physiol Occup Physiol. 1980;43:25–34. doi: 10.1007/BF00421352. [DOI] [PubMed] [Google Scholar]
- 5.Houston ME, Froese EA, Valeriote SP, Green HJ, Ranney DA. Muscle performance, morphology and metabolic capacity during strength training and detraining: A one leg model. Eur J Appl Physiol Occup Physiol. 1983;51:25–35. doi: 10.1007/BF00952534. [DOI] [PubMed] [Google Scholar]
- 6.Ivey FM, et al. Effects of strength training and detraining on muscle quality: Age and gender comparisons. J Gerontol A Biol Sci Med Sci. 2000;55:B152–B157. doi: 10.1093/gerona/55.3.b152. discussion B158–B159. [DOI] [PubMed] [Google Scholar]
- 7.Smith K, Winegard K, Hicks AL, McCartney N. Two years of resistance training in older men and women: The effects of three years of detraining on the retention of dynamic strength. Can J Appl Physiol. 2003;28:462–474. doi: 10.1139/h03-034. [DOI] [PubMed] [Google Scholar]
- 8.Harris C, DeBeliso M, Adams KJ, Irmischer BS, Spitzer Gibson TA. Detraining in the older adult: Effects of prior training intensity on strength retention. J Strength Cond Res. 2007;21:813–818. doi: 10.1519/R-15654.1. [DOI] [PubMed] [Google Scholar]
- 9.Strassburger E. Ûber die Wirkungssphäre der kerne und die zellgrösse. Histologische Beiträge. 1893;5:97–124. [Google Scholar]
- 10.Cavalier-Smith T. Nuclear volume control by nucleoskeletal DNA, selection for cell volume and cell growth rate, and the solution of the DNA C-value paradox. J Cell Sci. 1978;34:247–278. doi: 10.1242/jcs.34.1.247. [DOI] [PubMed] [Google Scholar]
- 11.Cavalier-Smith T. How selfish is DNA? Nature. 1980;285:617–618. doi: 10.1038/285617a0. [DOI] [PubMed] [Google Scholar]
- 12.Merlie JP, Sanes JR. Concentration of acetylcholine receptor mRNA in synaptic regions of adult muscle fibres. Nature. 1985;317:66–68. doi: 10.1038/317066a0. [DOI] [PubMed] [Google Scholar]
- 13.Hall ZW, Ralston E. Nuclear domains in muscle cells. Cell. 1989;59:771–772. doi: 10.1016/0092-8674(89)90597-7. [DOI] [PubMed] [Google Scholar]
- 14.Sanes JR, et al. Selective expression of an acetylcholine receptor-lacZ transgene in synaptic nuclei of adult muscle fibres. Development. 1991;113:1181–1191. doi: 10.1242/dev.113.4.1181. [DOI] [PubMed] [Google Scholar]
- 15.Ralston E, Hall ZW. Restricted distribution of mRNA produced from a single nucleus in hybrid myotubes. J Cell Biol. 1992;119:1063–1068. doi: 10.1083/jcb.119.5.1063. [DOI] [PMC free article] [PubMed] [Google Scholar]
- 16.Gundersen K, Sanes JR, Merlie JP. Neural regulation of muscle acetylcholine receptor epsilon- and alpha-subunit gene promoters in transgenic mice. J Cell Biol. 1993;123:1535–1544. doi: 10.1083/jcb.123.6.1535. [DOI] [PMC free article] [PubMed] [Google Scholar]
- 17.Gregory TR. Coincidence, coevolution, or causation? DNA content, cell size, and the C-value enigma. Biol Rev Camb Philos Soc. 2001;76:65–101. doi: 10.1017/s1464793100005595. [DOI] [PubMed] [Google Scholar]
- 18.Bruusgaard JC, Liestøl K, Ekmark M, Kollstad K, Gundersen K. Number and spatial distribution of nuclei in the muscle fibres of normal mice studied in vivo. J Physiol. 2003;551:467–478. doi: 10.1113/jphysiol.2003.045328. [DOI] [PMC free article] [PubMed] [Google Scholar]
- 19.Bruusgaard JC, Liestøl K, Gundersen K. Distribution of myonuclei and microtubules in live muscle fibers of young, middle-aged, and old mice. J Appl Physiol. 2006;100:2024–2030. doi: 10.1152/japplphysiol.00913.2005. [DOI] [PubMed] [Google Scholar]
- 20.Alway SE, Siu PM. Nuclear apoptosis contributes to sarcopenia. Exerc Sport Sci Rev. 2008;36:51–57. doi: 10.1097/JES.0b013e318168e9dc. [DOI] [PMC free article] [PubMed] [Google Scholar]
- 21.Siu PM, Alway SE. Response and adaptation of skeletal muscle to denervation stress: The role of apoptosis in muscle loss. Front Biosci. 2009;14:432–452. doi: 10.2741/3253. [DOI] [PMC free article] [PubMed] [Google Scholar]
- 22.Bruusgaard JC, Gundersen K. In vivo time-lapse microscopy reveals no loss of murine myonuclei during weeks of muscle atrophy. J Clin Invest. 2008;118:1450–1457. doi: 10.1172/JCI34022. [DOI] [PMC free article] [PubMed] [Google Scholar]
- 23.Siu PM, Pistilli EE, Butler DC, Alway SE. Aging influences cellular and molecular responses of apoptosis to skeletal muscle unloading. Am J Physiol Cell Physiol. 2005;288:C338–C349. doi: 10.1152/ajpcell.00239.2004. [DOI] [PubMed] [Google Scholar]
- 24.Saraste A, Pulkki K. Morphologic and biochemical hallmarks of apoptosis. Cardiovasc Res. 2000;45:528–537. doi: 10.1016/s0008-6363(99)00384-3. [DOI] [PubMed] [Google Scholar]
- 25.Rosenblatt JD, Parry DJ. Gamma irradiation prevents compensatory hypertrophy of overloaded mouse extensor digitorum longus muscle. J Appl Physiol. 1992;73:2538–2543. doi: 10.1152/jappl.1992.73.6.2538. [DOI] [PubMed] [Google Scholar]
- 26.Seiden D. Quantitative analysis of muscle cell changes in compensatory hypertrophy and work-induced hypertrophy. Am J Anat. 1976;145:459–465. doi: 10.1002/aja.1001450405. [DOI] [PubMed] [Google Scholar]
- 27.Hughes SM, Schiaffino S. Control of muscle fibre size: A crucial factor in ageing. Acta Physiol Scand. 1999;167:307–312. doi: 10.1046/j.1365-201x.1999.00622.x. [DOI] [PubMed] [Google Scholar]
- 28.Dutta C, Hadley EC. The significance of sarcopenia in old age. J Gerontol A Biol Sci Med Sci. 1995;50(Spec No):1–4. doi: 10.1093/gerona/50a.special_issue.1. [DOI] [PubMed] [Google Scholar]
- 29.Carson JA, Yamaguchi M, Alway SE. Hypertrophy and proliferation of skeletal muscle fibers from aged quail. J Appl Physiol. 1995;78:293–299. doi: 10.1152/jappl.1995.78.1.293. [DOI] [PubMed] [Google Scholar]
- 30.Alway SE, Degens H, Krishnamurthy G, Smith CA. Potential role for Id myogenic repressors in apoptosis and attenuation of hypertrophy in muscles of aged rats. Am J Physiol Cell Physiol. 2002;283:C66–C76. doi: 10.1152/ajpcell.00598.2001. [DOI] [PubMed] [Google Scholar]
- 31.Schultz E, Lipton BH. Skeletal muscle satellite cells: Changes in proliferation potential as a function of age. Mech Ageing Dev. 1982;20:377–383. doi: 10.1016/0047-6374(82)90105-1. [DOI] [PubMed] [Google Scholar]
- 32.Conboy IM, Conboy MJ, Smythe GM, Rando TA. Notch-mediated restoration of regenerative potential to aged muscle. Science. 2003;302:1575–1577. doi: 10.1126/science.1087573. [DOI] [PubMed] [Google Scholar]
- 33.Conboy IM, Rando TA. Aging, stem cells and tissue regeneration: Lessons from muscle. Cell Cycle. 2005;4:407–410. doi: 10.4161/cc.4.3.1518. [DOI] [PubMed] [Google Scholar]
- 34.Kadi F, Eriksson A, Holmner S, Thornell LE. Effects of anabolic steroids on the muscle cells of strength-trained athletes. Med Sci Sports Exerc. 1999;31:1528–1534. doi: 10.1097/00005768-199911000-00006. [DOI] [PubMed] [Google Scholar]
- 35.Sinha-Hikim I, et al. Testosterone-induced increase in muscle size in healthy young men is associated with muscle fiber hypertrophy. Am J Physiol Endocrinol Metab. 2002;283:E154–E164. doi: 10.1152/ajpendo.00502.2001. [DOI] [PubMed] [Google Scholar]
- 36.Moss FP, Leblond CP. Nature of dividing nuclei in skeletal muscle of growing rats. J Cell Biol. 1970;44:459–462. doi: 10.1083/jcb.44.2.459. [DOI] [PMC free article] [PubMed] [Google Scholar]
- 37.Lipton BH, Schultz E. Developmental fate of skeletal muscle satellite cells. Science. 1979;205:1292–1294. doi: 10.1126/science.472747. [DOI] [PubMed] [Google Scholar]
- 38.Schiaffino S, Bormioli SP, Aloisi M. The fate of newly formed satellite cells during compensatory muscle hypertrophy. Virchows Arch B Cell Pathol Incl Mol Pathol. 1976;21:113–118. doi: 10.1007/BF02899148. [DOI] [PubMed] [Google Scholar]
- 39.Schiaffino S, Bormioli SP, Aloisi M. Cell proliferation in rat skeletal muscle during early stages of compensatory hypertrophy. Virchows Arch B Cell Pathol Incl Mol Pathol. 1972;11:268–273. doi: 10.1007/BF02889406. [DOI] [PubMed] [Google Scholar]
- 40.Winchester PK, Davis ME, Alway SE, Gonyea WJ. Satellite cell activation in the stretch-enlarged anterior latissimus dorsi muscle of the adult quail. Am J Physiol. 1991;260:C206–C212. doi: 10.1152/ajpcell.1991.260.2.C206. [DOI] [PubMed] [Google Scholar]
- 41.Snow MH. Satellite cell response in rat soleus muscle undergoing hypertrophy due to surgical ablation of synergists. Anat Rec. 1990;227:437–446. doi: 10.1002/ar.1092270407. [DOI] [PubMed] [Google Scholar]
- 42.Smith RH, Palmer RM, Reeds PJ. Protein synthesis in isolated rabbit forelimb muscles. The possible role of metabolites of arachidonic acid in the response to intermittent stretching. Biochem J. 1983;214:153–161. doi: 10.1042/bj2140153. [DOI] [PMC free article] [PubMed] [Google Scholar]
- 43.MacDougall JD, et al. The time course for elevated muscle protein synthesis following heavy resistance exercise. Can J Appl Physiol. 1995;20:480–486. doi: 10.1139/h95-038. [DOI] [PubMed] [Google Scholar]
- 44.Goldspink DF, et al. Muscle growth in response to mechanical stimuli. Am J Physiol. 1995;268:E288–E297. doi: 10.1152/ajpendo.1995.268.2.E288. [DOI] [PubMed] [Google Scholar]
- 45.Chen YW, et al. Response of rat muscle to acute resistance exercise defined by transcriptional and translational profiling. J Physiol. 2002;545:27–41. doi: 10.1113/jphysiol.2002.021220. [DOI] [PMC free article] [PubMed] [Google Scholar]
- 46.Laurent GJ, Sparrow MP, Millward DJ. Turnover of muscle protein in the fowl. Changes in rates of protein synthesis and breakdown during hypertrophy of the anterior and posterior latissimus dorsi muscles. Biochem J. 1978;176:407–417. doi: 10.1042/bj1760407. [DOI] [PMC free article] [PubMed] [Google Scholar]
- 47.Goldspink DF, Garlick PJ, McNurlan MA. Protein turnover measured in vivo and in vitro in muscles undergoing compensatory growth and subsequent denervation atrophy. Biochem J. 1983;210:89–98. doi: 10.1042/bj2100089. [DOI] [PMC free article] [PubMed] [Google Scholar]
- 48.O’Connor RS, Pavlath GK. Point:Counterpoint: Satellite cell addition is/is not obligatory for skeletal muscle hypertrophy. J Appl Physiol. 2007;103:1099–1100. doi: 10.1152/japplphysiol.00101.2007. [DOI] [PubMed] [Google Scholar]
- 49.McCarthy JJ, Esser KA. Counterpoint: Satellite cell addition is not obligatory for skeletal muscle hypertrophy. J Appl Physiol. 2007;103:1100–1102. doi: 10.1152/japplphysiol.00101.2007a. discussion 1102–1103. [DOI] [PubMed] [Google Scholar]
- 50.O’Connor RS, Pavlath GK. In response to Point:Counterpoint: Satellite cell addition is/is not obligatory for skeletal muscle hypertrophy. J Appl Physiol. 2007;103:1102. doi: 10.1152/japplphysiol.00101.2007. [DOI] [PubMed] [Google Scholar]
- 51.McCarthy JJ, Esser KA. In response to Point:Counterpoint: Satellite cell addition is/is not obligatory for skeletal muscle hypertrophy. J Appl Physiol. 2007;103:1103. doi: 10.1152/japplphysiol.00101.2007a. [DOI] [PubMed] [Google Scholar]
- 52.Mantilla CB, Sieck GC. In response to Point:Counterpoint: Satellite cell addition is/is not obligatory for skeletal muscle hypertrophy. J Appl Physiol. 2007;103:1104. doi: 10.1152/japplphysiol.00466.2007. (lett) [DOI] [PubMed] [Google Scholar]
- 53.Rehfeldt C. In response to Point:Counterpoint: Satellite cell addition is/is not obligatory for skeletal muscle hypertrophy. J Appl Physiol. 2007;103:1104. doi: 10.1152/japplphysiol.00466.2007. (lett) [DOI] [PubMed] [Google Scholar]
- 54.Hikida RS. In response to Point:Counterpoint: Satellite cell addition is/is not obligatory for skeletal muscle hypertrophy. J Appl Physiol. 2007;103:1104–1105. doi: 10.1152/japplphysiol.00466.2007. (lett) [DOI] [PubMed] [Google Scholar]
- 55.Booth FW. In response to Point:Counterpoint: Satellite cell addition is/is not obligatory for skeletal muscle hypertrophy. J Appl Physiol. 2007;103:1105. doi: 10.1152/japplphysiol.00466.2007. (lett) [DOI] [PubMed] [Google Scholar]
- 56.Kadi F. In response to Point:Counterpoint: Satellite cell addition is/is not obligatory for skeletal muscle hypertrophy. J Appl Physiol. 2007;103:1105. doi: 10.1152/japplphysiol.00466.2007. (lett) [DOI] [PubMed] [Google Scholar]
- 57.Bodine SC. In response to Point:Counterpoint: Satellite cell addition is/is not obligatory for skeletal muscle hypertrophy. J Appl Physiol. 2007;103:1105–1106. doi: 10.1152/japplphysiol.00466.2007. (lett) [DOI] [PubMed] [Google Scholar]
- 58.Lowe DA. In response to Point:Counterpoint: Satellite cell addition is/is not obligatory for skeletal muscle hypertrophy. J Appl Physiol. 2007;103:1106. doi: 10.1152/japplphysiol.00466.2007. (lett) [DOI] [PubMed] [Google Scholar]
- 59.O’Connor RS, Pavlath GK, McCarthy JJ, Esser KA. Last Word on Point:Counterpoint: Satellite cell addition is/is not obligatory for skeletal muscle hypertrophy. J Appl Physiol. 2007;103:1107. doi: 10.1152/japplphysiol.00502.2007. (lett) [DOI] [PubMed] [Google Scholar]
- 60.Wada KI, Takahashi H, Katsuta S, Soya H. No decrease in myonuclear number after long-term denervation in mature mice. Am J Physiol Cell Physiol. 2002;283:C484–C488. doi: 10.1152/ajpcell.00025.2002. [DOI] [PubMed] [Google Scholar]
- 61.Gundersen K, Bruusgaard JC. Nuclear domains during muscle atrophy: Nuclei lost or paradigm lost? J Physiol. 2008;586:2675–2681. doi: 10.1113/jphysiol.2008.154369. [DOI] [PMC free article] [PubMed] [Google Scholar]
- 62.Lichtman JW, Magrassi L, Purves D. Visualization of neuromuscular junctions over periods of several months in living mice. J Neurosci. 1987;7:1215–1222. doi: 10.1523/JNEUROSCI.07-04-01215.1987. [DOI] [PMC free article] [PubMed] [Google Scholar]
- 63.Utvik JK, Njå A, Gundersen K. DNA injection into single cells of intact mice. Hum Gene Ther. 1999;10:291–300. doi: 10.1089/10430349950019075. [DOI] [PubMed] [Google Scholar]
- 64.Wada KI, Katsuta S, Soya H. Natural occurrence of myofiber cytoplasmic enlargement accompanied by decrease in myonuclear number. Jpn J Physiol. 2003;53:145–150. doi: 10.2170/jjphysiol.53.145. [DOI] [PubMed] [Google Scholar]


