

Abstract
In the yeast Saccharomyces cerevisiae, neutral lipids can be synthesized by four acyltransferases, namely Dga1p and Lro1p producing triacylglycerols (TAG) and Are1p and Are2p forming steryl esters (SE). TAG and SE are stored in an organelle called lipid particles/droplet. Growth of yeast cells on oleate-supplemented media strongly induced proliferation of lipid particles and specifically the synthesis of TAG, which serve as the major pool for the excess of fatty acids. Surprisingly, SE synthesis was strongly inhibited under these conditions. Here, we show that this effect was not due to decreased expression of ARE2 encoding the major yeast SE synthase at the transcriptional level but to competitive enzymatic inhibition of Are2p by free oleate. Consequently, a triple mutant dga1Δlro1Δare1ΔARE2+ grown on oleate did not form substantial amounts of SE and exhibited a growth phenotype similar to the dga1Δlro1Δare1Δare2Δ quadruple mutant, including lack of lipid particles. Growth of these mutants on oleate was strongly delayed, and cell viability was decreased but rescued by adaptation. In these strains, oleate stress caused morphological changes of intracellular membranes, altered phospholipid composition and formation of an additional lipid class, ethyl esters of fatty acids. In summary, our data showed that exposure to oleate led to disturbed lipid and membrane homeostasis along with liposensitivity of the yeast.
Keywords: Fatty Acid, Lipid, Lipid Droplet, Triacylglycerol, Yeast, Acyltransferase, Steryl Ester
Introduction
Fatty acids are essential molecules for all types of cells. They are required as building blocks for the synthesis of complex lipids and thus for membrane assembly. Fatty acids undergo permanent turnover in cellular processes located to different organelle fractions. Exogenous free fatty acids (FFA) are taken up by the yeast cell and activated to acyl-CoA. These activated fatty acids enter metabolic processes such as β-oxidation in the peroxisomes or synthesis of membrane-forming and storage lipids. Phospholipids are embedded in cellular membranes, whereas neutral lipids such as TAG2 and SE are stored in lipid particles/droplets (LP) (1–3). Storage of nonpolar lipids seems to play a major role when cells are exposed to high levels of exogenous FFA. Under these conditions, LP increase in number and size indicating that LP proliferation is enhanced to prevent accumulation of FFA in the cell (4). In the yeast Saccharomyces cerevisiae as well as in other eukaryotic cells, accumulation of FFA was claimed to be toxic for the cell and thus should be avoided (5, 6).
Recently, a detailed structural investigation of LP from the yeast revealed that TAG are stored in the core of this organelle, being surrounded by several layers of SE (3). In contrast to all other organelles, LP do not possess a phospholipid bilayer but are covered by a surface phospholipid monolayer. The biosynthesis of LP is still a matter of debate, but generally a budding model is well accepted (7–9). This model presumes that neutral lipids synthesized in the endoplasmic reticulum (ER) are concentrated in domains between the two leaflets of the bilayer membrane, which then leads to formation of a nascent LP.
Enzymes contributing to the synthesis of neutral lipids play a key role in LP biosynthesis (3, 10, 11). Four enzymes are responsible for the synthesis of neutral lipids in the yeast. Dga1p and Lro1p esterify DAG to TAG using either acyl-CoA or phospholipids as acyl donors (12–14). SE can be formed by Are1p and Are2p from sterols and acyl-CoA. Additionally, Are proteins have a minor capacity to form TAG. All four enzymes are localized to the ER supporting the theory that LP biogenesis is initiated in the ER. A substantial portion of Dga1p, however, was also found in LP (11) indicating that ER and LP are related organelles.
Little is known about the regulation of neutral lipid synthesis. At present, we can only speculate that synthesis and mobilization of these components have to be balanced. Although regulation of Dga1p and Lro1p has not been studied in detail, Valachovic et al. (15) reported that expression of ARE1 and ARE2 is heme-dependent. Are2p is the major SE-synthesizing enzyme under aerobic conditions, whereas Are1p is up-regulated in heme-deficient or anaerobic yeast cells. Moreover, Are2p esterifies mainly ergosterol, whereas Are1p also accepts ergosterol precursors as adequate substrates (16). These findings are in line with the fact that ergosterol is a major sterol under aerobic conditions, whereas heme-deficient cells are unable of ergosterol synthesis, accumulate ergosterol precursors and need to take up sterols from the environment (15, 17).
A dga1Δlro1Δare1Δare2Δ quadruple mutant (QM) strain lacking all four enzymes for neutral lipid synthesis does not form LP but is able to grow on glucose (10) thus indicating that LP are dispensable for yeast survival under normal growth conditions. However, it was reported that QM cells die upon exposure to exogenous unsaturated fatty acids, e.g. oleate (5, 6). This lipotoxic effect was ascribed to the increased permeability of the plasma membrane by excess incorporation of oleate into phospholipids. Although growth defects of different mutant strains on oleate-containing medium were shown, solid proof for the increased membrane permeability is missing.
In this study, we provide new evidence for oleate sensitivity of yeast cells. Our data support the view that TAG formation serves as the major buffer for a surplus of oleate. In contrast to other studies, however, we found that TAG was not essential for cell survival. We report that strains deficient in TAG or SE synthesis were able to tolerate high amounts of exogenous free fatty acid especially when adapted to these growth conditions. Most interestingly, we also show that SE formation was strongly decreased under oleate stress and thus identified a direct link of FFA accumulation and SE synthase activity. Our finding that Are2p was inhibited by oleate at the enzyme level provides novel molecular insight into yeast liposensitivity caused by fatty acids.
MATERIALS AND METHODS
Yeast Strains and Growth Conditions
Strains used in this study are listed in Table 1. Yeast cells were grown in YPD media containing 1% yeast extract, 2% peptone, and 2% glucose. YPO media contained 0.3% yeast extract, 0.5% peptone, 0.5% KH2PO4, 0.1% glucose, 0.1% oleate, and 0.2% Tween 80 if not stated otherwise. Cells were pre-grown in YPD for 48 h at 30 °C with shaking and used for inoculating YPO media to an A600 of 0.1.
TABLE 1.
Strains used in this study
| Strain | Genotype | Source |
|---|---|---|
| W303 (wild type) | SUG2 GAL+mal mel ade2-1 can1-100 his3-11,15 leu2-3 112 trp1-1 ura3-1 | ScanBi Ltd., Alnarp, Sweden (10) |
| TM DGA1 | W303; MATα lro1::TRP1 are1::HIS3 are2::LEU2 ADE2 met ura3 | ScanBi Ltd., Alnarp, Sweden (10) |
| TM LRO1 | W303; MATα dga1::kanMX4 are1::HIS3 are2::LEU2 ADE2 met trp1 ura3 | ScanBi Ltd., Alnarp, Sweden (10) |
| TM ARE1 | W303; MATα dga1::kanMX4 lro1::TRP1 are2::LEU2 ADE2 met his3 ura3 | ScanBi Ltd., Alnarp, Sweden (10) |
| TM ARE2 | W303; MATα dga1::kanMX4 lro1::TRP1 are1::HIS3 ADE2 met leu2 ura3 | ScanBi Ltd., Alnarp, Sweden (10) |
| QM | W303; MATα dga1::kanMX4 lro1::TRP1 are1::HIS3 are2::LEU2 ADE2 met ura3 | ScanBi Ltd., Alnarp, Sweden (10) |
For cell viability tests, cells from a 48-h culture on YPD were inoculated to YPO to an A600 of 0.1. At the time points indicated, cells were counted in a Bürker chamber, and 100 cells were plated on YPD agar and incubated at 30 °C for 2 days. The formation of colonies was then determined.
Cell Fractionation
Cells were grown to an early stationary phase in liquid media and harvested in a Sorvall SLC3000 rotor at 4,200 × g for 5 min. Cells were washed twice in double distilled water, and the cell wet weight (CWW) was determined. The cells (0.5 g CWW/ml) were then incubated with dithiothreitol (DTT; 0.66 mg/ml) in buffer A (0.1 m Tris/SO4, pH 9.4) for 20 min at 30 °C with shaking. Cells were washed once in buffer C (1.2 m sorbitol), resuspended in buffer B (1.2 m sorbitol, 20 mm KPi, pH 7.4) (0.15 g CWW/ml), and incubated with Zymolyase-20T (Seikagaku Corp., Japan) at a concentration of 2 mg of enzyme per g CWW for at least 1 h at 30 °C with shaking. The resulting spheroplasts were washed twice in buffer C and resuspended in buffer D (5 mm MES-KOH, pH 6.0, 0.6 m sorbitol, 1 mm KCl, 0.5 mm EDTA) followed by mechanical disruption in the presence of the protease inhibitor phenylmethylsulfonyl fluoride (PMSF; 1 mm final concentration) with 15 strokes using a 30-ml Dounce homogenizer with a loose-fitting pestle. The homogenate was centrifuged to remove cell debris in a Sorvall SS34 rotor at 3,000 × g for 5 min. Supernatants were collected, and the homogenization process was repeated twice with the pellets. Combined supernatants were centrifuged at 27,000 × g for 15 min in an SS34 (Sorvall) rotor to sediment mitochondria and peroxisomes. The supernatant was transferred to fresh tubes and centrifuged at 40,000 × g for 30 min. The pellet contained microsomal fractions that were resuspended in 100 mm KPi, pH 7.4, and stored at −80 °C.
Isolation of RNA and RT-PCR Analyses
Total RNA from cultivated cells was isolated by RNeasy kit (Qiagen). Reverse transcription was carried out with 1.5–3 μg of RNA after DNase I treatment (1 unit of RQ1, Promega) in a total volume of 15 μl of reverse transcriptase reaction buffer (15 min at 37 °C). Reverse transcriptase from Invitrogen was used, according to the manufacturer's protocol. Primers for cDNA amplification were used as follows: Are2 forward, 5′-ATG GAC AAG AAG AAG GAT CTA CTG G-3′, Are2 reverse, 5′-TTT CCC TAC TGA GTC GAC AGC ATC T-3′; Act1 forward, 5′-GGT CCC AAT TGC TCG AGA GAT-3′, Act1 reverse, 5′-GAA GTC CAA GGC GAC GTA ACA-3′. Amplification of PCR products was measured during the exponential phase of the reaction as described by Marone et al. (18). PCR was performed with using the following protocol: 1) 96 °C for 2 min; 2) designated cycles of 96 °C for 10 s, 56 °C (Are2) or 58 °C (Act1) for 15 s, 72 °C for 20 s; and 3) 72 °C for 10 min following by cooling to 4 °C.
Electron Microscopy
Yeast cells were prepared for electron microscopy as described before (4). In brief, cells were grown at 30 °C under aerobic conditions on YPO to the early stationary phase. Cells were harvested by centrifugation and washed twice with 0.5% fatty acid-free BSA and three times with double distilled water. The cells were then fixed for 5 min in a 1% aqueous solution of KMnO4 at room temperature, washed with double distilled water, and fixed in a 1% aqueous solution of KMnO4 for 20 min. Fixed cells were washed three times in distilled water and incubated in 0.5% aqueous uranyl acetate overnight at 4 °C. The samples were then dehydrated in a graded series of acetone (50, 70, 90, and 100%) and embedded in an acetone/agar 100 (Gröpl, Austria) mixture (1:1) for 5 h, then in an acetone/agar 100 mixture (1:3) overnight at room temperature, and finally polymerized in pure agar 100 resin for 48 h at 60 °C. Ultrathin sections of 80 nm were stained with lead citrate and viewed with a Philips CM 10 electron microscope.
Lipid Extraction
Lipids were extracted by the method of Folch et al. (19). In brief, extraction of total lipids from cells was performed in the presence of 3 ml of CHCl3/MeOH (2:1; v/v) in a Pyrex glass tube by vortexing at room temperature for 1 h. Proteins and nonpolar substances were removed by consecutive washing steps with 0.2 volumes of 0.034% MgCl2, 1 ml of 2 n KCl/MeOH (4:1; v/v), and 1 ml of CHCl3/MeOH/H2O (3:48:47 per volume). After centrifugation for 3 min at 3,000 rpm in a table top centrifuge, the aqueous phase was removed by aspiration. Finally, lipids were dried under a stream of nitrogen and stored at −20 °C.
Analysis of Phospholipids
The different classes of phospholipids were separated on a 10 × 10-cm silica TLC plate using chloroform, methanol, 25% ammonia (65:35:5 per volume) as a developing solvent for the first dimension and chloroform/ acetone/methanol/acetic acid/water (50:20:10:10:5 per volume) for the second dimension. Spots of phospholipids were visualized by iodine vapor, scraped off, and transferred to phosphate-free glass tubes with ground neck. Lipid phosphorus was quantified after subjecting samples to hydrolysis (20). For this purpose, 0.2 ml of concentrated H2SO4, 72% HClO4 (9:1; v/v) were added to each sample. Hydrolysis was performed at 180 °C in a heating block for 30 min. 4.8 ml of freshly prepared 0.26% ammonium molybdate/ANSA (500:22; v/v) were added to cooled samples. ANSA consists of 40.0 g of K2S2O5, 0.63 g of 8-anilino-1-naphthalenesulfonic acid, and 1.25 g of Na2SO3 in 250 ml of water. After vigorous vortexing, samples were heated to 100 °C for 30 min in a heating chamber. Finally, after short centrifugation in a table top centrifuge at 1,000 × g for 4 min, samples cooled to room temperature were measured spectrophotometrically at a wavelength of 830 nm using a blank spot from the TLC plate without phospholipid as a control. For quantification of total phosphorus, a standard curve was prepared using inorganic phosphate at known amounts.
Neutral Lipid Analysis
Dried lipid extracts were dissolved in an appropriate volume of CHCl3/MeOH (2:1; v/v) and spotted onto Silica Gel 60 TLC plates. A two-step separation system was employed using light petroleum/diethyl ether/acetic acid (70:30:2 per volume) as a solvent until the front reached two-thirds of the height of the plate. Then separation of lipids was continued in the same direction using light petroleum/diethyl ether (49:1; v/v) until the solvent front reached the top of the plate. Free ergosterol and ergosteryl esters were quantified densitometrically with a TLC scanner (Shimadzu Chromatoscanner CS-930) at 275 nm. Other neutral lipids were irreversibly stained by charring prior to scanning. For this purpose, the TLC plate was incubated ∼15 s in a solution of 0.63 g of MnCl2·4H2O, 60 ml of water, 60 ml of methanol, 4 ml of concentrated sulfuric acid and stained in a heating chamber at 100 °C for 30 min. The bands were then quantified by TCL scanning at 600 nm.
Fatty Acid Analysis
Fatty acids were analyzed by gas-liquid chromatography (GLC) after hydrolysis and conversion to methyl esters. For this purpose, lipid extracts were treated with BF3-methanol as described by Morrison and Smith (21). In brief, after addition of 1 ml of BF3-methanol to dried lipid extracts, samples were heated to 95 °C in a sand bath for 10 min and then cooled to room temperature. Then 0.86 ml of benzene were added, and tubes were heated again in the sand bath at 95 °C for 30 min. 1 ml of double distilled water and 3 ml of light petroleum were added, and samples were vortexed for 30 min. After centrifugation at 2,500 rpm for 2 min in a table top centrifuge (Hettich Universal 16), the upper phase was transferred to a new Pyrex tube. The lower phase was extracted again as described above using 3 ml of light petroleum. After centrifugation, organic phases were combined and dried under a stream of nitrogen. The samples were then dissolved in light petroleum and transferred to glass tubes. Finally, fatty acid methyl esters were separated by GLC (HP6890) using n HP-INNOWax polyethylene glycol column (15 m × 0.25 mm inner diameter × 0.5 μm film thickness) with a temperature gradient (160 °C for 5 min with 7.5 °C/min to 250 °C for 15 min). Fatty acids were identified by comparison with commercial fatty acid methyl ester standards (NuCheck, Inc., Elysian, MN).
Ethyl esters of fatty acids were identified according to their RF values on Silica gel 60 TLC plates by comparison with ethyl oleate (for preparation see below). Subsequently, ethyl esters of fatty acids were extracted from the silica gel with heptane and analyzed by GLC-MS (HP 5890 Series II Plus). Ethyl esters of fatty acids were identified according to their retention time and mass fragmentation patterns using MSD ChemStation, D.03.00.552, and the library Wiley/NIST05.
Ethyl oleate and ethyl palmitate were prepared by boiling 1 ml of the respective fatty acid and 1 ml of pure ethanol at 80 °C in a tightly closed Pyrex tube in the presence of 50 μl of H2SO4. Identification of the products was by GLC-MS analysis.
Enzyme Analysis
The acyl-CoA:ergosterol acyltransferase assay was adapted from Yang et al. (22) and Czabany et al. (3). The assay was performed in a final volume of 100 μl containing 6 nmol of [14C]oleoyl-CoA (specific activity 58 mCi/mmol), 0.025 mm ergosterol, 0.5 mm CHAPS, 100 mm KPi, pH 7.4, 1 mm dithiothreitol (DTT), and 20–100 μg of ER protein or 200 μg of homogenate protein, respectively. To test the effect of additives on the enzyme activity, assays were performed in the presence of 1.1, 2.2, or 5.5 μmol of oleate or phospholipids up to a maximum concentration of 96 nmol/μl. Incubations were carried out for 30 min at 30 °C or at different time points as indicated. Reactions were terminated by adding 300 μl of chloroform/methanol (2:1; v/v). Lipids were extracted twice for 30 min with shaking using 300 μl of chloroform:methanol (2:1; v/v), and combined organic phases were washed twice using methanol/water/chloroform (47:48:3 per volume). The organic phase was taken to dryness under a stream of nitrogen. The lipids were then dissolved in 30 μl of chloroform/methanol (2:1; v/v), separated by TLC as described above, and visualized on TLC plates by iodine vapor. SE bands were scraped off, and radioactivity was measured by liquid scintillation counting using LSC Safety Mixture (Baker, Deventer, The Netherlands) with 5% water in the scintillation mixture.
RESULTS
Mutants Bearing Defects in Neutral Lipid Biosynthesis Show Distinct Phenotypes on Oleate-supplemented Media
In this study, we investigated the lipotoxic stress of fatty acids on yeast cells in some detail. To create distinct stress situations, we used mutant strains deficient in three or all four acyltransferases required for LP biogenesis (see Table 1) and cultivated them on media containing oleate as carbon source. Surprisingly, we found that these mutant strains exhibited different growth characteristics on the media (Fig. 1). Growth rates of triple mutants with only Dga1p (TM DGA1) or Lro1p (TM LRO1) active grew similar to wild type. Growth of a strain with only Are2p (TM ARE2) active was delayed, which was even more pronounced when only Are1p (TM ARE1) was functional. The latter strains showed extended lag phases of 12 and 24 h, respectively, and grew to lower density than wild type. In contrast to previous studies (6), we found that the QM dga1Δlro1Δare1Δare2Δ was able to grow on oleate-containing media, although with a marked delay.
FIGURE 1.

Yeast cells defective in neutral lipid synthesis grown on oleate medium. Yeast cells from a preculture grown in YPD for 48 h were used to inoculate fresh YPO media to an A600 of 0.1. Cells were incubated at 30 °C with shaking. At the time points indicated, aliquots were withdrawn, and cells were washed in 0.5% fatty acid-free BSA, and turbidity was measured. Data shown are representative of at least three independent experiments. ♦, wild type (W303); ▴, TM DGA1; ■, TM LRO1; ×, TM ARE1; +, TM ARE2; ●, QM.
To exclude the possibility of oleate decomposition during prolonged incubation as a possible reason for growth retardation, we tested the fatty acid composition of media over the time period investigated. However, no changes of the fatty acid composition were observed (data not shown). We further tested whether growth of oleate-sensitive strains on oleate-containing media might cause a “memory effect.” For this purpose, we cultivated cells on oleate medium for 48 h and then shifted them to fresh oleate medium to an A600 of 0.1. Interestingly, precultivation of QM on oleate-containing media abolished the growth delay when cells were further grown on oleate (Fig. 2A). We also found that during an intermediate round of cultivation on YPD for 48 h, QM did not lose its ability to grow on oleate without delay. Similar results were obtained with TM ARE1 and TM ARE2 (Fig. 2B). Interestingly, both strains recovered almost to wild type growth phenotype when pre-grown on oleate, although to a slightly reduced A600. TM ARE1 was still growing slower than TM ARE2. These surprising results indicated that an adaptive process had occurred, although the reason for this adaptation is presently not known. A reversion of the genetic defect is unlikely because all mutants were deletion strains. Moreover, the neutral lipid profile verified the absence of the respective acyltransferase activity in vivo. We can only speculate at present that gain-of-function suppressors may have been activated.
FIGURE 2.

Growth phenotype of TAG-deficient strains on oleate. Yeast cells from a fresh YPD plate were grown in liquid YPD to the stationary phase. The cells were then used to inoculate a liquid main culture of YPO to an A600 0.1. At the time points indicated, aliquots were withdrawn, and cells were washed in 0.1% BSA, and density was measured optically in a spectrophotometer. Data shown are representative of at least three independent experiments. A, QM, ■, YPO after growth in YPD for 48 h; ♦, YPO after growth on YPO for 48 h; ◇, YPO from YPD (48 h) after preincubation on YPO (48 h). B, TM ARE1 and TM ARE2, ▴, TM ARE1 YPO from YPD (48 h); Δ, TM ARE1 YPO from YPD after YPO (48 h); ♦, TM ARE2 YPO from YPD (48 h); ◇, TM ARE2 YPO from YPD after YPO (48 h).
To shed more light on the survival of QM, TM ARE1, and TM ARE2 on oleate, we performed viability tests. These experiments (Fig. 3) revealed that most of the cells died within the first 24 h of oleate exposure. Surprisingly, however, a small number of cells survived and continued growing. TM ARE1 showed a continuously reduced viability to 40% within the first 24 h of oleate exposure. TM ARE2 was found to be stable for 12 h but then lost viability down to 20% at time points 24 and 36 h. TM ARE1 cultures fully recovered after 36 h and TM ARE2 cultures after 48 h of exposure to YPO. QM lost 90% of its viability within 4 h of growth on oleate. After 12 h, cells started recovering and were back to 100% viability after 36 h of growth. The different recovery periods of TMs grown on oleate were in line with the different lag phases of the strains (see Figs. 1 and 2).
FIGURE 3.

Cell viability on oleate-supplemented media. Cells were grown in liquid YPO from a YPD preculture. At time points indicated, aliquots were withdrawn, and cells were counted in a Bürker cell counter. The same numbers of cells were then plated on fresh YPD plates and incubated for 2 days at 30 °C. The number of colonies formed was determined indicating the rate of cell survival. Black bars, TM ARE1; white bars, TM ARE2; gray bars, QM. Data shown were obtained from three independent experiments, and error bars show standard deviation. p values are as follows: **, <0.01; ***, <0.001; #, data point not measured.
To further elucidate the effect of adaptation of strains to oleate, we inspected their cellular morphology. Strains were grown on oleate to early stationary phase and then subjected to electron microscopy. Wild type, TM DGA1, and TM LRO1 did not show morphological differences (Fig. 4, upper panel). In these cells, TAG was formed and buffered the surplus of fatty acids, large LP accumulated, and peroxisomes, ER and mitochondria were normally developed. In contrast and to our surprise, TM ARE1 and TM ARE2 cells did not contain LP when grown on oleate but instead showed abnormal and increased ER structures (Fig. 4, lower panel). We named these structures large ER membrane (LEM), which were most prominent in TM ARE2 and QM. These results were in contrast to previous findings with the same set of strains grown on glucose (3). Under these conditions, LP were well developed in all TMs, and cell morphology was not different from wild type. QM that lacks LP already on glucose media showed the same morphology on oleate.
FIGURE 4.

Electron micrographs of yeast cells grown on YPO. Cells were grown to the stationary phase in YPO liquid media. Cell fixation and preparation were performed as described under “Materials and Methods.” Several pictures were taken from each strain, and pictures shown here resemble the overall phenotype observed. N, nucleus; Px, peroxisome; Mt, mitochondria; ER, endoplasmic reticulum; LEM, large ER membrane; LP, lipid particle; V, vacuole.
Oleate Changes the Neutral Lipid Pattern of Wild Type and Mutant Strains
The striking morphological changes in mutant strains deficient in TAG biosynthesis (TM ARE1, TM ARE2, and QM) as described above led us to analyze the neutral lipid pattern of these cells grown on oleate compared with glucose. For this purpose, lipid extracts from cells in the early stationary phase were analyzed (Fig. 5). As expected, TM ARE1, TM ARE2, and QM were not able to produce significant amounts of TAG irrespective of the growth medium (Fig. 5A). In contrast, massively increased amounts of TAG were found in wild type, TM DGA1, and TM LRO1 when grown on oleate. It has to be mentioned, however, that an increase in TAG was already observed when TM DGA1 and TM LRO1 were grown on glucose as a compensatory effect for the loss of SE formation.
FIGURE 5.

Neutral lipid analyses of strains from YPD and YPO. Cells from different strains were incubated on YPD and YPO until early stationary phase. Total cell extracts were prepared, and lipids were extracted as described under “Materials and Methods.” Neutral lipids were then separated by TLC, and amounts were analyzed by densitometric scanning. A, amount of TAG in strains indicated; B, amount of SE in strains indicated. Data show results from four independent experiments with standard deviation as indicated by the error bars. p values are as follows: * < 0.05; ** < 0.01; *** < 0.001. wt, wild type.
TM ARE2, the strain with the major SE synthase active, accumulated SE when grown in YPD medium (Fig. 5B). Surprisingly, hardly any SE were detected in strains grown on YPO medium. Especially in wild type and TM ARE2, the amount of SE was dramatically decreased when grown on oleate compared with glucose media. Wild type grown to early stationary phase on YPD contained TAG and SE at an approximate ratio of 1:1 (see Fig. 5) (2). Growth on YPO dramatically shifted the TAG to SE ratio to 16:1 indicating that TAG served as the major buffer for excess fatty acids.
Formation of Fatty Acid Ethyl Esters in Strains Lacking Triacylglycerol Formation
Analyses of total lipid extracts from TM ARE1, TM ARE2, and QM grown on oleate revealed the occurrence of a new and so far unidentified compound (Fig. 6). An additional band was visible on TLC and found to be most prominent in TM ARE1, TM ARE2, and QM grown on YPO. Based on the RF value and GLC-MS analysis, this substance was identified as ethyl esters of palmitate (43%) and oleate (57%). We assume that this compound, although present in minor amounts, was formed as a consequence of fatty acid overflow in these cells.
FIGURE 6.
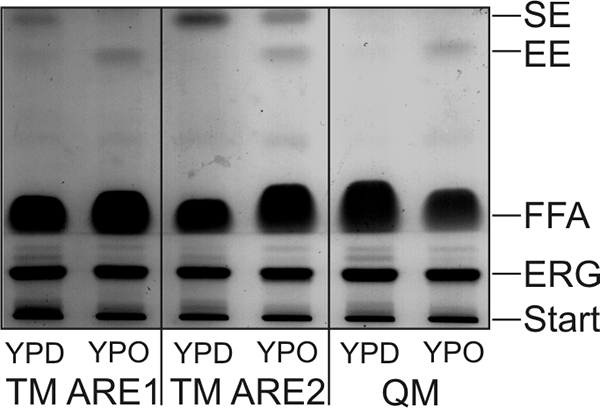
Neutral lipid profile of cells grown on YPD and YPO. Cells from TM ARE1, TM ARE2, and QM were grown to early stationary phase on YPD and YPO liquid media inoculated from the same YPD preculture. Lipids were isolated, and the same amounts were separated by TLC as described under “Materials and Methods” and visualized with iodine vapor. SE, steryl ester; EE, fatty acid ethyl ester; FFA, free fatty acid; ERG, ergosterol; Start, loading lane.
Alterations of cellular morphology (see Fig. 4) and neutral lipid pattern (see Fig. 5) led us to speculate that the phospholipid pattern was also altered when cells were shifted to growth on oleate. Our analyses showed that in all strains with the exception of TM ARE2, the amount of total phospholipids was indeed increased by growth on oleate (Fig. 7). A major increase was found with TM LRO1 and TM ARE1, whereas changes in TM DGA1 and QM were moderate. A more detailed analysis of the phospholipid composition in TM ARE2 cells showed a decrease of phosphatidylethanolamine and an increase of lysophospholipids when cells were grown on oleate compared with glucose (data not shown). Although both phosphatidylethanolamine and lysophospholipids are known to disturb the structure of bilayer membranes, it is hard to imagine that this effect may become relevant in the complex mixture of phospholipids with large amounts of phosphatidylcholine in organelle membranes.
FIGURE 7.

Phospholipid pattern from cells grown on YPD and YPO. Crude lipid extracts were prepared from cells grown on YPD and YPO to stationary phase. Phospholipids were isolated and quantified as described under “Materials and Methods.” Overall amounts of phospholipids in cells grown on YPD (dark bars) and YPO (light bars) were determined in the different mutant strains indicated. Data represent results from three independent experiments with error bars representing standard deviation. p values are as follows: *, < 0.05; **, < 0.01.
Steryl Ester Synthase Activity Is Inhibited by Oleate
The finding that SE levels were dramatically decreased in cells grown on oleate was striking and a novel effect of oleate in yeast. However, the reason for this down-regulation of sterol esterification was not obvious. Previously, it was reported that genes encoding proteins of ergosterol synthesis (ERG1 and ERG3) were down-regulated by oleate (23), and knock-out of the acyltransferases decreased expression of genes involved in ergosterol formation (ERG3, ERG4, and ERG5) (24). Therefore, we presumed that lack of substrates, ergosterol and/or free fatty acid, might cause the decrease in sterol esterification. To prove or disprove this hypothesis, we analyzed amounts of free ergosterol (unesterified) and FFA in cells grown on oleate and or glucose (Fig. 8). We found that the level of free ergosterol was increased in all mutant strains compared with wild type (Fig. 8A). This effect was observed with cells grown on YPD or YPO. Consequently, free ergosterol was not limiting when cells were grown on oleate.
FIGURE 8.

Amounts of free ergosterol and free fatty acids in cells from YPD and YPO. Cells from different strains were incubated on YPD and YPO until early stationary phase. Total cell extracts were prepared, and lipids were extracted as described under “Materials and Methods.” Ergosterol and FFA were then separated by TLC, and amounts were analyzed by densitometric scanning. A, amount of free ergosterol in strains indicated; B, amount of FFA in strains indicated. Data show results from four independent experiments with standard deviation as indicated. p values are as follows: ** < 0.01; *** < 0.001; wt, wild type.
Although it was very unlikely that the level of FFA in cells grown on oleate would be the bottleneck for SE formation, we also analyzed these components in all strains investigated (Fig. 8B). As expected, growth of cells on oleate caused an increase in cellular FFA. The relative increase was most dramatic in wild type because the level of FFA was low in this strain when grown on YPD. In the TMs and in the QM, the amount of FFA was already high when grown on glucose due to the defect in neutral lipid formation, and the increase by growth on oleate was rather moderate. However, also this reaction partner for SE synthases was not limiting.
As mentioned above, it had been shown that oleate has a great impact on the expression of a number of genes (23, 25–27). Therefore, we wondered whether oleate also had an influence on the expression level of ARE2, the major yeast SE synthase under aerobic conditions. However, RT-PCR analysis performed with RNA extracted from wild type cells grown on glucose, oleate, and palmitate did not show any significant difference in the expression of ARE2 (Fig. 9).
FIGURE 9.

Transcription level of ARE2. RNA from yeast wild type cells grown in the presence of glucose (lane 1), palmitate (lane 2), or oleate (lane 3), respectively, was isolated and subjected to RT-PCR as indicated under “Materials and Methods.” Similar results were obtained in two independent experiments. ARE2, acyl-CoA:sterol acyltransferase 2; ACT1, actin.
Finally, we investigated whether FFA had an impact on SE synthesis in vitro. For this purpose, we performed assays with homogenates and purified ER from wild type cells grown on glucose in the absence or presence of oleate and palmitate, respectively. We found that both FFA decreased the esterification of ergosterol in vitro (Fig. 10A), but the effect of oleate was much stronger than of palmitate. This effect was not only seen when radiolabeled oleoyl-CoA was used as a co-substrate for the reaction but also with palmitoyl-CoA (supplemental Fig. 1A). We also ruled out the possibility that oleoyl-CoA instead of free oleate caused the decreased SE synthase activity by substrate inhibition. We performed control experiments using increasing amounts of oleoyl-CoA in the assays, but no indication of inhibition was observed (supplemental Fig. 1B). Moreover, we tested PL species containing different fatty acids for their influence on the enzyme activity, but they also did not exhibit an inhibitory effect on the esterification of sterols (supplemental Fig. 1C). Finally, we wished to exclude an unspecific and more general effect of oleate as detergent or inhibitor of acyltransferases. Therefore, we performed DAG acyltransferase (Dga1p) assays as a control. As can bee seen from Fig. 10B, free oleate did not affect the activity of this enzyme but specifically decreased sterol esterification by Are2p. To further elucidate whether our measurements specifically accounted for inhibition of Are2p activity, we investigated sterol esterification in ER fractions isolated from either wild type, TM ARE1, or TM ARE2 (Fig. 10C). As can be seen from these results, hardly any activity was found in the strain with only Are1p active (TM ARE1), which is in line with previous findings that Are1p activity was found only in cells grown anaerobically (15). Inhibition of SE synthesis by oleate was found almost identical in wild type and TM ARE2, indicating that Are2p is the target for oleate under conditions tested here. We conclude from these results that the inhibition of SE synthase by oleate is specific and accounts for SE depletion in cells grown on oleate.
FIGURE 10.

In vitro sterol esterification activity. Steryl ester synthase activity was determined as described under “Materials and Methods.” A, effect of free oleate or palmitate on the esterification of ergosterol was measured in crude cell homogenates. ■, addition of oleate; ♦, addition of palmitate at the final concentration as indicated. Data shown represent two independent experiments with standard deviation given as indicated by error bars. B, comparison of sterol and DAG esterification in the presence of oleate was measured with isolated ER fractions. ■, ergosterol esterification; ▴, DAG esterification. Data were obtained from four independent experiments, and standard deviation is indicated by error bars. C, effect of oleate on sterol esterification in ER fractions isolated from either wild type (♦), TM ARE2 (■), or TM ARE2 (▴). Data show results from two independent experiments with error bars representing the standard deviation. D, Lineweaver-Burk plot of SE synthase activity in isolated ER fractions in the presence of different amounts of oleate; □, no oleate; ■, 1.1 μmol of oleate; ▴, 2.2 μmol of oleate; ●, 5.5 μmol of oleate. Results shown in this figure are mean values from four independent experiments. with error bars indicating the standard deviation.
To investigate the enzymology of SE synthase inhibition by oleate in more detail, we performed enzyme kinetic measurements using increasing amounts of free oleate as additive (Fig. 10D). These assays showed that Vmax was constant at a value of about 0.002 nmol/min/μg protein in all cases, whereas the Km increased from 5.6 nmol (no oleate) to 11.4, 12.6, and 13.6 nmol when 1.1, 2.2, and 5.5 μmol oleate, respectively, were added to the reaction mixture.
DISCUSSION
Cellular effects of oleate are diverse. On one hand, oleate plays an essential role in a number of cellular processes, e.g. lipid synthesis (28), membrane formation (4, 29), induction of peroxisome proliferation (26, 30, 31), stimulation of lipid particle biogenesis (4, 32), and gene regulation (26). On the other hand, oleate has a negative influence on cell survival and causes a so-called lipotoxic effect (33–35).
In contrast to CHO cells, which cannot tolerate excess amounts of saturated fatty acids (36), yeast cells become sensitive to oleate, especially in strains bearing defects in neutral lipid storage (6, 37). Whereas exogenous saturated fatty acids were found to be without effect on yeast cells, the role of palmitoleate remained controversial (5). Different mechanisms are under discussion, which may lead to fatty acid lipotoxicity in different experimental systems. Programmed cell death (6, 38–40), JNK-dependent TNF-related apoptosis (41), activation of peroxisome proliferator-activated receptor (42), and activation of the unfolded protein response (43–46) with the ER may play a role in the observed lipotoxic effects (47, 48). Finally, imbalance in cellular lipid metabolism leading to changes in membrane properties needs to be considered (5, 6).
Our findings presented here confirm the lipotoxic effect of oleate on yeast cells but extend this finding insofar as we demonstrate that the yeast can adapt to this stress situation. We show that strains lacking neutral lipid formation and thus lipid particle proliferation become permanent or at least long term tolerant to oleate (see Fig. 2). This adaptation process, however, is accompanied by several dramatic cellular changes such as increase of the cellular phospholipid level, increase of lysophospholipids and free sterols, formation of ethyl esters of fatty acids, and disturbance of the ER membrane network. Interestingly, lysophospholipids and esters of fatty acids may act as second messengers (49–52), and their accumulation may lead to disturbed signaling and ultimately to cell death. Ethyl esters of fatty acids are formed by the two acyl-CoA:ethanol O-acyltransferases Eeb1p and Eht1p (53). Up-regulation of EEB1 and EHT1 expression upon oleate treatment (27) may lead to enhanced formation of fatty acid ethyl esters as a sort of escape mechanism from the excess of FFA. An alternative adaptive mechanism to limit fatty acid toxicity would be increased efflux, but there is no proof for such an effect.
Exposure of yeast cells to exogenous oleate confers dramatic changes of the cell structure. Under these conditions, peroxisomes are induced and lipid particles massively proliferate as long as neutral lipid synthesis is active (4). In strains bearing defects in nonpolar lipid production, however, lipid particles cannot be formed, whereas proliferation of peroxisomes upon induction by oleate appeared to be unaffected (see Fig. 4). This result indicates that these two organelles act independently of each other, although functional and structural association of lipid particles and peroxisomes was discussed before (4, 32).
Interestingly, ER membranes strongly proliferate (see Fig. 4) in strains lacking lipid particles that may in part be attributed to the enhanced phospholipid production (see Fig. 7). ER membrane accumulation was also found in yeast cells overproducing Pex15p (54), cytochrome P450, cytochrome b2, and HMG-CoA reductase (55–57), although these ER structures were different from large ER membrane structures (Fig. 4) described in this study. Currently, we can only speculate that ER membrane accumulation may be the result of the enhanced lipid/protein ratio in the ER under conditions when lipid particles cannot be formed. This hypothesis is in line with the view that lipid particles and ER are related organelles. However, it was found that under ER stress lipid particle biosynthesis was not essential for cell survival (58).
Wild type and the quadruple mutant dga1Δlro1Δare1Δare2Δ represent black and white situations of neutral lipid storage and oleate sensitivity. In contrast, TM, with only one of the neutral lipid-forming acyltransferases active, enabled us to obtain a more precise picture of fatty acid lipotoxicity pinpointing some novel details of lipid storage under fatty acid stress. In brief, major effects observed with these strains were as follows: (i) huge accumulation of TAG in TM DGA1 and TM LRO1 confirming that TAG is paramount for fatty acid storage but, in contrast to previous findings, not essential for cellular survival; and (ii) strong oleate sensitivity of TM ARE1 and TM ARE2 strains similar to QM. Moreover, growth of yeast on oleate changes the phospholipid and protein patterns of lipid particles.3 Finally, we discovered that exposure of yeast cells to oleate led to a strong decrease of the cellular SE level due to inhibition of the major SE-synthesizing enzyme.
The latter observation we considered especially important because of a potentially new regulatory effect. Previous studies reported transcriptional alterations as an oleate response (23, 25, 27, 59, 60). In the yeast (61) and in rat adipose tissue (62), oleate has a direct inhibitory effect on the activity of glycerolphosphate acyltransferase. In bacteria, octanoic acid specifically inhibits glucose-6-phosphate dehydrogenase, phosphofructokinase, pyruvate kinase, fumarase, lactate dehydrogenase, and the malic enzyme (63). In HepG2 cells, oleate and linoleate have an inhibitor effect on the proteasome (64).
The reason for reduced production of SE in yeast strains exposed to oleate was not at the transcriptional level of ARE2 encoding the major SE-synthesizing enzyme but at the enzyme level. Classical enzyme kinetic experiments showed that oleate inhibits Are2p in a very specific way. This effect may also be relevant in vivo because of the high concentration of free oleate more or less in all subcellular fractions of cells grown on oleate.3 Accumulation of FFA was already observed in TM and QM strains grown on glucose (Fig. 8B), but neither liposensitivity nor SE reduction was observed. The ratio of oleate to palmitate was 1:1 in cells grown on glucose but was 6.5:1 in cells grown on oleate-supplemented media. The saturated fatty acid palmitate did not cause any growth defect or marked inhibition of Are2p in vitro (Fig. 10A). As a result, the ratio of TAG to SE was hardly altered in cells grown on palmitate (data not shown), whereas oleate-grown cells produced 16 times more TAG than SE (Fig. 5).
Our findings raised the question as to the physiological relevance of the inhibition of sterol esterification. It was discussed that the toxic effect of oleate in yeast was due to changes in the plasma membrane fluidity (5) or to altered acyl chain distribution in membranes (6). Previous studies with Bacillus subtilis had shown that the ratio of unsaturated to saturated fatty acids was critical for membrane fluidity (65–67). This view is in line with our results that the membrane phospholipid composition was altered when cells were grown in oleate-supplemented medium (4). We suggest that high amounts of oleate in phospholipids may lead to increased membrane fluidity and to a challenge of cell viability. Inhibition of Are2p preventing the conversion of free sterols to SE may lead to higher concentrations of free sterols. This effect may contribute to adaptation of membranes toward more rigidity. At this point, we can only speculate that this effect might also be true for other unsaturated fatty acids as suggested previously for palmitoleate (5, 6, 24). In summary, the results described in this study are one step closer to the understanding of liposensitivity caused by oleate. We hypothesize that oleic acid sensitivity occurs rather through a membrane adaptation process than defects in lipid storage. We postulate that the mechanism of oleate-induced enzyme inhibition may also be relevant for other enzymes as well as for other organisms such as mammals or plants.
Supplementary Material
Acknowledgments
We thank Sten Stymne for providing yeast mutant strains. Furthermore, we thank Claudia Hrastnik for technical support and Karin Athenstaedt for fruitful discussion.
This work was supported by the Fonds zur Förderung der Wissenschaftlichen Forschung in Österreich, Projects 18857 and W901-B05 (to G. D.).

The on-line version of this article (available at http://www.jbc.org) contains supplemental Fig. 1.
M. Connerth and T. Czabany, unpublished results.
- TAG
- triacylglycerol
- DAG
- diacylglycerol
- ER
- endoplasmic reticulum
- LP
- lipid particle/droplet
- PA
- phosphatidic acid
- PC
- phosphatidylcholine
- TM
- triple mutant
- QM
- quadruple mutant
- CWW
- cell wet weight
- GLC
- gas-liquid chromatography.
REFERENCES
- 1.Athenstaedt K., Zweytick D., Jandrositz A., Kohlwein S. D., Daum G. (1999) J. Bacteriol. 181, 6441–6448 [DOI] [PMC free article] [PubMed] [Google Scholar]
- 2.Leber R., Zinser E., Zellnig G., Paltauf F., Daum G. (1994) Yeast 10, 1421–1428 [DOI] [PubMed] [Google Scholar]
- 3.Czabany T., Wagner A., Zweytick D., Lohner K., Leitner E., Ingolic E., Daum G. (2008) J. Biol. Chem. 283, 17065–17074 [DOI] [PubMed] [Google Scholar]
- 4.Rosenberger S., Connerth M., Zellnig G., Daum G. (2009) Biochim. Biophys. Acta 1791, 379–387 [DOI] [PubMed] [Google Scholar]
- 5.Lockshon D., Surface L. E., Kerr E. O., Kaeberlein M., Kennedy B. K. (2007) Genetics 175, 77–91 [DOI] [PMC free article] [PubMed] [Google Scholar]
- 6.Petschnigg J., Wolinski H., Kolb D., Zellnig G., Kurat C. F., Natter K., Kohlwein S. D. (2009) J. Biol. Chem. 284, 30981–30993 [DOI] [PMC free article] [PubMed] [Google Scholar]
- 7.Walther T. C., Farese R. V., Jr. (2009) Biochim. Biophys. Acta 1791, 459–466 [DOI] [PMC free article] [PubMed] [Google Scholar]
- 8.Czabany T., Athenstaedt K., Daum G. (2007) Biochim. Biophys. Acta 1771, 299–309 [DOI] [PubMed] [Google Scholar]
- 9.Rajakumari S., Grillitsch K., Daum G. (2008) Prog. Lipid Res. 47, 157–171 [DOI] [PubMed] [Google Scholar]
- 10.Sandager L., Gustavsson M. H., Ståhl U., Dahlqvist A., Wiberg E., Banas A., Lenman M., Ronne H., Stymne S. (2002) J. Biol. Chem. 277, 6478–6482 [DOI] [PubMed] [Google Scholar]
- 11.Sorger D., Daum G. (2002) J. Bacteriol. 184, 519–524 [DOI] [PMC free article] [PubMed] [Google Scholar]
- 12.Yang H., Bard M., Bruner D. A., Gleeson A., Deckelbaum R. J., Aljinovic G., Pohl T. M., Rothstein R., Sturley S. L. (1996) Science 272, 1353–1356 [DOI] [PubMed] [Google Scholar]
- 13.Dahlqvist A., Stahl U., Lenman M., Banas A., Lee M., Sandager L., Ronne H., Stymne S. (2000) Proc. Natl. Acad. Sci. U.S.A. 97, 6487–6492 [DOI] [PMC free article] [PubMed] [Google Scholar]
- 14.Oelkers P., Cromley D., Padamsee M., Billheimer J. T., Sturley S. L. (2002) J. Biol. Chem. 277, 8877–8881 [DOI] [PubMed] [Google Scholar]
- 15.Valachovic M., Hronská L., Hapala I. (2001) FEMS Microbiol. Lett. 197, 41–45 [DOI] [PubMed] [Google Scholar]
- 16.Zweytick D., Leitner E., Kohlwein S. D., Yu C., Rothblatt J., Daum G. (2000) Eur. J. Biochem. 267, 1075–1082 [DOI] [PubMed] [Google Scholar]
- 17.Valachovic M., Klobucníková V., Griac P., Hapala I. (2002) FEMS Microbiol. Lett. 206, 121–125 [DOI] [PubMed] [Google Scholar]
- 18.Marone M., Mozzetti S., De Ritis D., Pierelli L., Scambia G. (2001) Biol. Proced. Online 3, 19–25 [DOI] [PMC free article] [PubMed] [Google Scholar]
- 19.Folch J., Lees M., Sloane Stanley G. H. (1957) J. Biol. Chem. 226, 497–509 [PubMed] [Google Scholar]
- 20.Broekhuyse R. M. (1968) Biochim. Biophys. Acta 152, 307–315 [DOI] [PubMed] [Google Scholar]
- 21.Morrison W. R., Smith L. M. (1964) J. Lipid Res. 5, 600–608 [PubMed] [Google Scholar]
- 22.Yang H., Cromley D., Wang H., Billheimer J. T., Sturley S. L. (1997) J. Biol. Chem. 272, 3980–3985 [DOI] [PubMed] [Google Scholar]
- 23.Smith J. J., Marelli M., Christmas R. H., Vizeacoumar F. J., Dilworth D. J., Ideker T., Galitski T., Dimitrov K., Rachubinski R. A., Aitchison J. D. (2002) J. Cell Biol. 158, 259–271 [DOI] [PMC free article] [PubMed] [Google Scholar]
- 24.Garbarino J., Padamsee M., Wilcox L., Oelkers P. M., D'Ambrosio D., Ruggles K. V., Ramsey N., Jabado O., Turkish A., Sturley S. L. (2009) J. Biol. Chem. 284, 30994–31005 [DOI] [PMC free article] [PubMed] [Google Scholar]
- 25.Gurvitz A., Rottensteiner H. (2006) Biochim. Biophys. Acta 1763, 1392–1402 [DOI] [PubMed] [Google Scholar]
- 26.Saleem R. A., Knoblach B., Mast F. D., Smith J. J., Boyle J., Dobson C. M., Long-O'Donnell R., Rachubinski R. A., Aitchison J. D. (2008) J. Cell Biol. 181, 281–292 [DOI] [PMC free article] [PubMed] [Google Scholar]
- 27.Smith J. J., Sydorskyy Y., Marelli M., Hwang D., Bolouri H., Rachubinski R. A., Aitchison J. D. (2006) Mol. Syst. Biol. 2006;2:2006.0009 [DOI] [PMC free article] [PubMed] [Google Scholar]
- 28.Casey W. M., Rolph C. E., Tomeo M. E., Parks L. W. (1993) Biochem. Biophys. Res. Commun. 193, 1297–1303 [DOI] [PubMed] [Google Scholar]
- 29.Wriessnegger T., Gübitz G., Leitner E., Ingolic E., Cregg J., de la Cruz B. J., Daum G. (2007) Biochim. Biophys. Acta 1771, 455–461 [DOI] [PubMed] [Google Scholar]
- 30.Erdmann R., Blobel G. (1995) J. Cell Biol. 128, 509–523 [DOI] [PMC free article] [PubMed] [Google Scholar]
- 31.Erdmann R., Veenhuis M., Mertens D., Kunau W. H. (1989) Proc. Natl. Acad. Sci. U.S.A. 86, 5419–5423 [DOI] [PMC free article] [PubMed] [Google Scholar]
- 32.Binns D., Januszewski T., Chen Y., Hill J., Markin V. S., Zhao Y., Gilpin C., Chapman K. D., Anderson R. G., Goodman J. M. (2006) J. Cell Biol. 173, 719–731 [DOI] [PMC free article] [PubMed] [Google Scholar]
- 33.Garbarino J., Sturley S. L. (2005) Biochem. Soc. Trans. 33, 1182–1185 [DOI] [PubMed] [Google Scholar]
- 34.Schaffer J. E. (2003) Curr. Opin. Lipidol. 14, 281–287 [DOI] [PubMed] [Google Scholar]
- 35.Unger R. H., Orci L. (2002) Biochim. Biophys. Acta 1585, 202–212 [DOI] [PubMed] [Google Scholar]
- 36.Listenberger L. L., Han X., Lewis S. E., Cases S., Farese R. V., Jr., Ory D. S., Schaffer J. E. (2003) Proc. Natl. Acad. Sci. U.S.A. 100, 3077–3082 [DOI] [PMC free article] [PubMed] [Google Scholar]
- 37.Kohlwein S. D., Petschnigg J. (2007) Curr. Hypertens. Rep. 9, 455–461 [DOI] [PubMed] [Google Scholar]
- 38.Listenberger L. L., Ory D. S., Schaffer J. E. (2001) J. Biol. Chem. 276, 14890–14895 [DOI] [PubMed] [Google Scholar]
- 39.Zhang Q., Chieu H. K., Low C. P., Zhang S., Heng C. K., Yang H. (2003) J. Biol. Chem. 278, 47145–47155 [DOI] [PubMed] [Google Scholar]
- 40.Low C. P., Shui G., Liew L. P., Buttner S., Madeo F., Dawes I. W., Wenk M. R., Yang H. (2008) J. Cell Sci. 121, 2671–2684 [DOI] [PubMed] [Google Scholar]
- 41.Malhi H., Barreyro F. J., Isomoto H., Bronk S. F., Gores G. J. (2007) Gut 56, 1124–1131 [DOI] [PMC free article] [PubMed] [Google Scholar]
- 42.Cury-Boaventura M. F., Gorjão R., de Lima T. M., Newsholme P., Curi R. (2006) Life Sci. 78, 1448–1456 [DOI] [PubMed] [Google Scholar]
- 43.Cunha D. A., Hekerman P., Ladrière L., Bazarra-Castro A., Ortis F., Wakeham M. C., Moore F., Rasschaert J., Cardozo A. K., Bellomo E., Overbergh L., Mathieu C., Lupi R., Hai T., Herchuelz A., Marchetti P., Rutter G. A., Eizirik D. L., Cnop M. (2008) J. Cell Sci. 121, 2308–2318 [DOI] [PMC free article] [PubMed] [Google Scholar]
- 44.Kharroubi I., Ladrière L., Cardozo A. K., Dogusan Z., Cnop M., Eizirik D. L. (2004) Endocrinology 145, 5087–5096 [DOI] [PubMed] [Google Scholar]
- 45.Cnop M., Vidal J., Hull R. L., Utzschneider K. M., Carr D. B., Schraw T., Scherer P. E., Boyko E. J., Fujimoto W. Y., Kahn S. E. (2007) Diabetes Care 30, 677–682 [DOI] [PubMed] [Google Scholar]
- 46.Ota T., Gayet C., Ginsberg H. N. (2008) J. Clin. Invest. 118, 316–332 [DOI] [PMC free article] [PubMed] [Google Scholar]
- 47.Lupi R., Dotta F., Marselli L., Del Guerra S., Masini M., Santangelo C., Patané G., Boggi U., Piro S., Anello M., Bergamini E., Mosca F., Di Mario U., Del Prato S., Marchetti P. (2002) Diabetes 51, 1437–1442 [DOI] [PubMed] [Google Scholar]
- 48.Borradaile N. M., Han X., Harp J. D., Gale S. E., Ory D. S., Schaffer J. E. (2006) J. Lipid Res. 47, 2726–2737 [DOI] [PubMed] [Google Scholar]
- 49.Resnick R. J., Tomáska L. (1994) J. Biol. Chem. 269, 32336–32341 [PubMed] [Google Scholar]
- 50.McIntyre T. M., Pontsler A. V., Silva A. R., Hilaire A., Xu Y., Hinshaw J. C., Zimmerman G. A., Hama K., Aoki J., Arai H., Prestwich G. D. (2003) Proc. Natl. Acad. Sci. U.S.A. 100, 131–136 [DOI] [PMC free article] [PubMed] [Google Scholar]
- 51.Simon M. F., Daviaud D., Pradère J. P., Grès S., Guigné C., Wabitsch M., Chun J., Valet P., Saulnier-Blache J. S. (2005) J. Biol. Chem. 280, 14656–14662 [DOI] [PubMed] [Google Scholar]
- 52.Alhomsi K., Laposata M. (2006) Alcohol Clin. Exp. Res. 30, 1121–1125 [DOI] [PubMed] [Google Scholar]
- 53.Saerens S. M., Verstrepen K. J., Van Laere S. D., Voet A. R., Van Dijck P., Delvaux F. R., Thevelein J. M. (2006) J. Biol. Chem. 281, 4446–4456 [DOI] [PubMed] [Google Scholar]
- 54.Elgersma Y., Kwast L., van den Berg M., Snyder W. B., Distel B., Subramani S., Tabak H. F. (1997) EMBO J. 16, 7326–7341 [DOI] [PMC free article] [PubMed] [Google Scholar]
- 55.Jones A. L., Fawcett D. W. (1966) J. Histochem. Cytochem. 14, 215–232 [DOI] [PubMed] [Google Scholar]
- 56.Wright R., Basson M., D'Ari L., Rine J. (1988) J. Cell Biol. 107, 101–114 [DOI] [PMC free article] [PubMed] [Google Scholar]
- 57.Vergères G., Yen T. S., Aggeler J., Lausier J., Waskell L. (1993) J. Cell Sci. 106, 249–259 [DOI] [PubMed] [Google Scholar]
- 58.Fei W., Wang H., Fu X., Bielby C., Yang H. (2009) Biochem. J. 424, 61–67 [DOI] [PubMed] [Google Scholar]
- 59.De Gottardi A., Vinciguerra M., Sgroi A., Moukil M., Ravier-Dall'Antonia F., Pazienza V., Pugnale P., Foti M., Hadengue A. (2007) Lab. Invest. 87, 792–806 [DOI] [PubMed] [Google Scholar]
- 60.Duplus E., Glorian M., Forest C. (2000) J. Biol. Chem. 275, 30749–30752 [DOI] [PubMed] [Google Scholar]
- 61.Morikawa M., Yamashita S. (1978) Eur. J. Biochem. 84, 61–68 [DOI] [PubMed] [Google Scholar]
- 62.Durocher V., Miller M., Rodriguez M. A. (1990) Can. J. Physiol. Pharmacol. 68, 1255–1260 [DOI] [PubMed] [Google Scholar]
- 63.Ferdinandus J., Clark J. B. (1969) J. Bacteriol. 98, 1109–1113 [DOI] [PMC free article] [PubMed] [Google Scholar]
- 64.Hamel F. G. (2009) Metabolism 58, 1047–1049 [DOI] [PubMed] [Google Scholar]
- 65.Grau R., de Mendoza D. (1993) Mol. Microbiol. 8, 535–542 [DOI] [PubMed] [Google Scholar]
- 66.Weber M. H., Klein W., Müller L., Niess U. M., Marahiel M. A. (2001) Mol. Microbiol. 39, 1321–1329 [DOI] [PubMed] [Google Scholar]
- 67.Aguilar P. S., de Mendoza D. (2006) Mol. Microbiol. 62, 1507–1514 [DOI] [PubMed] [Google Scholar]
Associated Data
This section collects any data citations, data availability statements, or supplementary materials included in this article.