Abstract
Heparan sulfates (HSs) modulate various developmental and homeostatic processes by binding to protein ligands. We have evaluated the structural characteristics of porcine HS in cellular signaling induced by basic fibroblast growth factor (FGF2), using CHO745 cells devoid of endogenous glycosaminoglycans as target. Markedly enhanced stimulation of cell signaling, measured as phosphorylation of ERK1/2 and protein kinase B, was only observed with the shortest HS chains isolated from liver, whereas the longer chains from either liver or intestine essentially prolonged duration of signals induced by FGF2 in the absence of polysaccharide. Structural analysis showed that contiguous sulfated domains were most abundant in the shortest HS chains and were more heavily sulfated in HS from liver than in HS from intestine. Moreover, the shortest chains from either source entered into ternary complexes with FGF2 and FGF receptor-1c more efficiently than the corresponding longer chains. In addition to authentic HSs, decasaccharide libraries generated by chemo-enzymatic modification of heparin were probed for effect on FGF2 signaling. Only the most highly sulfated decamers, previously found most efficient in ternary complex formation (Jastrebova, N., Vanwildemeersch, M., Rapraeger, A. C., Giménez-Gallego, G., Lindahl, U., and Spillmann, D. (2006) J. Biol. Chem. 281, 26884–26892), promoted FGF2 cellular signaling as efficiently as short HS chains from liver. Together these results suggest that the effects of HS on FGF2 signaling are determined by both the structure of the highly sulfated domains and by the organization/availability of such domains within the HS chain. These findings underpin the need for regulation of HS biosynthesis in relation to control of growth factor-induced signaling pathways.
Keywords: Glycosaminoglycan, Growth Factors, Heparan Sulfate, Heparin, Oligosaccharide, Cell Signaling, FGF Receptor, Fibroblast Growth Factor, Ternary Complex
Introduction
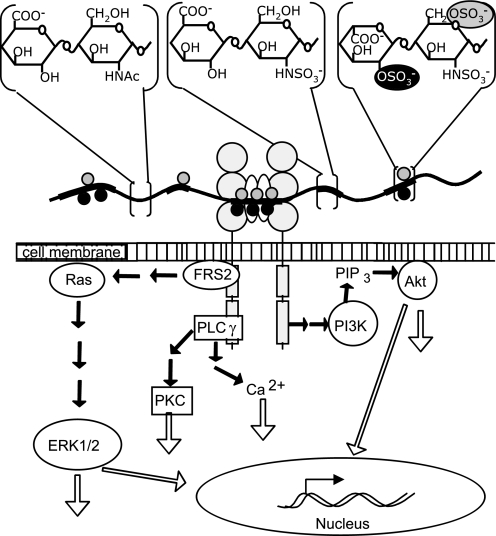
Heparan sulfate (HS)4 chains are long, unbranched, and negatively charged polysaccharides covalently attached to proteoglycan core proteins, such as syndecans or glypicans on the cell surface and perlecan in the extracellular matrix (1, 2). A precursor polymer consisting of alternating glucuronic acid (GlcA) and GlcNAc units is consecutively altered during biosynthesis by a number of sequential modification reactions. Some of the GlcNAc units are N-deacetylated and N-sulfated resulting in an N-sulfated glucosamine unit (GlcNS). This type of modification creates a pattern along each HS chain with stretches of unmodified N-acetylated disaccharide units (denoted NA domains), consecutive sequences of N-sulfated disaccharide units (NS domains), and interspacing domains composed of alternating N-sulfated and N-acetylated disaccharides (mixed or NA/NS domains). This initial pattern basically defines further changes of the HS chains by creating substrates for further enzymatic modification, and thus NA domains remain poorly modified as compared with NS and NA/NS domains. The further modification steps include C5-epimerization of GlcA to IdoUA, 2-O-sulfation of IdoUA (rarely also of GlcA), and 6-O-sulfation of GlcNS and of some GlcNAc residues mainly in the NA/NS domains (3, 4). Because the modification reactions are incomplete, a highly heterogeneous pattern of sulfation is generated along the HS chain (see Fig. 1 for a schematic presentation). Some of the modifying enzymes occur as multiple isoforms, which are differentially expressed in different tissues. The abundance and fine structure of HS generally vary with tissue source (5, 6).
FIGURE 1.
Schematic presentation of HS chain participating in FGF·HS·FR complex formation and induction of intracellular signaling pathways. The HS backbone is symbolized as a cord containing unmodified NA domains (thin gray stretches) and modified NS domains (broad black stretches). Black circles on the cord represent 2-O-sulfate groups, and gray circles represent 6-O-sulfate groups. The highest modified part of the HS chain in the middle is participating in an FGF·HS·FR complex formation, where white ovals represent FGF molecules. The large gray circles symbolize the extracellular immunoglobulin-like domains I–III of the receptor, and the gray rectangles inside the cell represent the receptor kinase domains, which can trigger several signaling pathways. The flowchart sketches three main FGF- induced signaling pathways, the MAPK-ERK1/2, PI3K-Akt, and phospholipase Cγ (PLC)γ pathways. PIP, inositol 1,4,5-trisphosphate.
A multitude of proteins has been shown to bind to HS (7, 8). Among those are growth factors, extracellular matrix proteins, enzymes, and microbial proteins. HS binding proteins generally interact through positive patches on the protein surface with the negatively charged sulfate groups that decorate HS. Thus, most proteins seem to bind to NS domains (9), although in some cases binding sites consist of discontinuous NS domains spaced by NA-disaccharides (10–13). In a few cases, proteins have been shown to require highly specific HS structures for productive interaction, whereas many other ligands appear less selective and can bind to various saccharide domains of sufficient charge density (9, 14).
The family of fibroblast growth factors (FGFs) consists of 23 polypeptide growth factors that bind and activate cell-surface FGF receptors 1–4 (FRs) (15, 16). FGF2 (basic FGF) is by far the most studied FGF and is implicated, among other things, in angiogenesis, wound repair, and developmental and homeostatic processes in the nervous system (17–19). Upon activation, receptor molecules dimerize and mutually transphosphorylate each other, subsequently leading to activation of intracellular signaling pathways, such as the MAPK cascades (ERK1/2, p38, and JNK), the lipid kinase PI3K-protein kinase B (Akt) pathway, and the phospholipase Cγ pathway (see Fig. 1 for a schematic presentation) (20, 21). Depending on cell type, developmental stage, and type of FGF and FR involved, the cell may respond by proliferation, migration, apoptosis, or stimulated/inhibited differentiation (22, 23). FGF signaling is modulated by HS, which binds both the growth factor and the receptor and thus affects the FGF·FR signaling complex (24–26). Several groups have attempted to elucidate what HS structures are required to support different FGF-FR combinations, and this issue is still a matter of debate (27–35). In a number of studies, HS was represented by short oligosaccharides (8–12-mer-long NS domains) with varying degree and type of sulfation. The impact of full chain HS has often been studied using native and selectively desulfated heparin (∼12–15 kDa), which is a highly and evenly sulfated HS variant lacking the domain organization and found intracellularly in connective tissue-type mast cells (36). By using such an approach, it has been difficult to evaluate the possible importance of domain organization of endogenous HS species that FGFs and FRs may encounter in vivo. In alternative approaches, endogenous HS present on target cells provided clues to the importance of certain structural elements, such as 2-O-sulfate groups (32) or the overall role of structural variation in relation to different FGF-FR pairs (33, 37).
In this study, we aimed at relating the structural organization of full-length HS chains to FGF2 engagement at three levels as follows: formation of binary FGF2·HS complexes, formation of ternary FGF2·HS·FR1 complexes, and activation of signaling pathways in cells upon stimulation with FGF2 and HS. We also analyzed the effects of defined oligosaccharides of systematically varied structure (35) on FGF2-induced signaling. Chinese hamster ovary 745 (CHO745) cells devoid of endogenous HS and chondroitin sulfate (CS), expressing a low number of FRs (31), mainly FR2c,5 were used in the cell activation experiments. Because of the lack of expression of xylosyltransferase Xylt1 mRNA and a mutation in the xylosyltransferase gene Xylt2, the first glycosylation step common to HS and CS biosynthesis (attachment of xylose to the protein core) does not take place, and the cells do not produce HS and CS (38, 39). HS was isolated from porcine liver and intestine with preserved NA/NS domain organization and characterized regarding chain length, overall modification level, and domain type/abundance. The results revealed a complex dependence of FGF2 interactions and signaling on HS domain sulfation and overall organization.
EXPERIMENTAL PROCEDURES
Materials
Porcine tissues were obtained from the local slaughterhouse and kept frozen until used. HS from swine intestine was a gift from G. van Dedem (Diosynth, Oss, The Netherlands). Heparin from bovine lung was purified as described previously (40). Chondroitinase ABC was obtained from Seikagaku Corp., and heparin lyases I–III were from IBEX Pharmaceuticals, Inc. (Montreal, Canada). Bio-Gel P-10 fine and empty 10-ml columns were purchased from Bio-Rad. Sephadex G-15, PD-10 desalting columns, DEAE-Sephacel, Superose 6, Superose 12, Superdex 30, a Superdex 30 prototype column, NaB3H4 (50–60 Ci/mmol), and [3H]acetic anhydride (500 mCi/mmol) were obtained from GE Healthcare. A Partisil-10 SAX anion exchange column (4.6 × 250 mm) was from Whatman; a Luna 5u C18 reversed phase column (4.6 × 150) was from Phenomenex (Torrance, CA), and a ProPac PA1 column was from Dionex (Surrey, UK). Recombinant human FGF2 was purchased from PeproTech (London, UK). FR1c-alkaline phosphatase (where “c” denotes the splice variant of the IgIII domain of the FR) protein was kindly provided by A. C. Rapraeger (University of Wisconsin, Madison). Anti-human placenta alkaline phosphatase-agarose beads were obtained from Sigma. Chinese hamster ovary pgsA-745 cells deficient in endogenous HS and CS due to the absence of xylosyltransferase Xylt1 mRNA and a dysfunctional xylosyltransferase 2 gene (38, 39) were generously supplied by L. Claesson-Welsh (Uppsala University, Sweden). Cells were controlled for absence of glycosaminoglycan production as described previously (6). Ham's F-12 medium and fetal bovine serum were purchased from Invitrogen. A solution of penicillin G (0.6%) and streptomycin sulfate (0.5%) was from Statens Veterinärmedicinska Anstalt (Uppsala, Sweden). Cell culture dishes were obtained from Nunc and Falcon. Immobilon-P membranes were from Millipore (Solna, Sweden). ECL Advance blocking agent and ECL Plus Western blotting detection system were purchased from GE Healthcare. Polyclonal rabbit antibodies to phosphorylated ERK1/2 (Thr202/Thr204), Akt (Ser473), total ERK1/2, and anti-rabbit horseradish peroxidase-linked antibody were from Cell Signaling Technology, Inc. Fuji Super RX x-ray films used for detection were from Science Imaging Scandinavia (Nacka, Sweden). All other reagents were of the best quality available.
Heparan Sulfate Preparations
HS was prepared from porcine tissues essentially as described earlier (41). After tissue defatting, protein digestion, and nucleic acid digestion, glycosaminoglycans were precipitated by cetylpyridinium chloride and ethanol. Contaminating CS was digested by chondroitinase ABC, and HS was further purified by chromatography on a DEAE-Sephacel column equilibrated with 50 mm Tris/HCl, pH 7.5. Contaminants were eluted with 5 column volumes of equilibration buffer, 5 column volumes of 50 mm sodium acetate, pH 4.5, 1 column volume of H2O, and 5 column volumes of 0.2 m NH4HCO3 before HS was eluted with 2 m NH4HCO3.
HS was radiolabeled by partial N-deacetylation for 15 min at 96 °C in hydrazine monohydrate (Fluka, Switzerland) containing 1% hydrazine sulfate (42), followed by 3H N-reacetylation of N-unsubstituted glucosamine with [3H]acetic anhydride (43). Labeled liver and intestine HS showed specific activities of ∼1.4 × 10⁴ and ∼2.5 × 10⁴ cpm 3H/μg polysaccharide, respectively. Fractionation of isolated HS was performed by Superose 6 and 12 chromatography in 0.5 m NH4HCO3 at a flow rate of 0.5 ml/min.
NA domains were generated along with disaccharides from NS domain, and tetrasaccharides from NA/NS domains by cleavage of HS with HNO2 at pH 1.5 as described previously (44). A radioactive label was introduced at the reducing end by reduction with NaB3H4 (45). Unincorporated radioactivity and disaccharides were separated from larger oligosaccharides by chromatography on a column (1 × 200 cm) of Sephadex G-15 in 0.2 m NH4HCO3. Tetrasaccharides and larger were subsequently fractionated on a sizing chromatography system consisting of a Superdex 30 column (HiLoad 16/60 preparative grade) coupled in series to a prototype column (1.6 × 60 cm) with similar properties equilibrated in 0.2 m NH4HCO3. The 3H-labeled disaccharides were analyzed on a Partisil-10 SAX HPLC as described previously (46). HS was quantified by colorimetric determination of hexuronic acid using the meta-hydroxydiphenyl method with GlcA as a standard (47). GlcA values were arbitrarily multiplied by 3 to obtain saccharide mass.
Oligosaccharides representing NS domains from different size-defined HS fractions were obtained by N-deacetylation for 4 h at 96 °C as described previously (42), followed by nitrous acid cleavage at pH 3.9 (44) and radiolabeling as described above. Oligosaccharides were size-separated by gel chromatography on a P-10 column (1 × 140 cm) in 0.2 m NH4HCO3, and pools corresponding to 8- and 10-mers were recovered and analyzed for composition as described below. Disaccharide analysis of isolated chains (1 μg) was performed after complete digestion with a mixture of 0.4 milliunits each of heparin lyase I–III followed by reversed-phase ion pairing-HPLC as described previously (6).
Preparation of Oligosaccharide Libraries
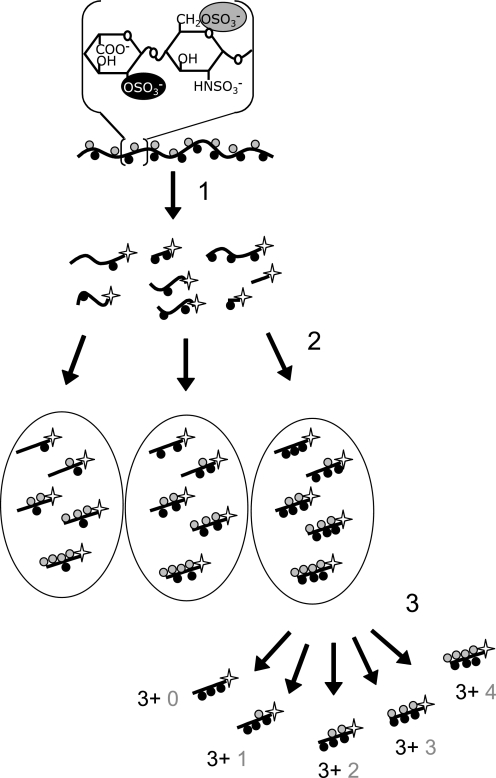
Oligosaccharide libraries were generated from bovine lung heparin as described previously (see Fig. 2 for a schematic illustration of the procedure) (35, 48). In short, heparin was 6-O- and partially 2-O-desulfated through solvolysis and cleaved into oligosaccharides by deamination, and the resultant fragments were 3H-labeled at their reducing end to a specific activity of 5 × 10⁵ cpm/nmol oligosaccharide (step 1 in Fig. 2). Size-defined oligosaccharide pools were obtained by gel chromatography on a Bio-Rad P-10 column. These oligosaccharides were further separated by anion-exchange HPLC on a ProPac PA-1 column according to the number (0–5) of 2-O-sulfate groups. Individual pools containing fragments with a defined number of 2-O-sulfate groups were then subjected to enzymatic 6-O-sulfation (summarized as step 2 in Fig. 2), and the products were separated by anion-exchange HPLC based on the number (0–4) of added 6-O-sulfate groups. The resultant decasaccharides used in the cell activation assay thus had defined numbers of both 2-O- and 6-O-sulfate groups (Fig. 2, step 3).
FIGURE 2.
Chemo-enzymatic generation of oligosaccharide libraries. The starting material, heparin, is symbolized as a string cord with the predominant repeating disaccharide unit indicated. Step 1, after selective O-desulfation by solvolysis (designed to remove all 6-O-sulfate groups and about half of the 2-O-sulfate groups), chains are subjected to partial deaminative cleavage, and the resultant oligosaccharides are radiolabeled by reduction with NaB3H4 (star indicates the radiolabeled reduced end of oligosaccharide). Step 2, size and charge selections are performed before enzyme-based 6-O-sulfation of pools of different oligosaccharides. Step 3, fractions of size-homogeneous oligosaccharides with a given number of 2-O-sulfate groups (1st digit; dark circle) and variable numbers of added 6-O-sulfate groups (2nd digit; gray circle) are further separated by anion-exchange chromatography.
FGF2·HS Binary Complex Formation
FGF2 (120 pmol, 2 μg) was incubated with HS pools I–III (3 pmol corresponding to ∼150, ∼80, and ∼50 ng of pools I–III, respectively) in 200 μl of 50 mm Tris/HCl, pH 7.4, 150 mm NaCl, 0.5 mg/ml BSA. Labeled saccharides trapped along with FGF2 on nitrocellulose filters were quantified by scintillation counting (49). Assays were designed to provide a ≥10-fold molar excess of protein over polysaccharide.
FGF2·HS·FR1c Ternary Complex Formation
Complex formation was assayed by affinity chromatography as described previously (35). Briefly, FR1c-alkaline phosphatase protein (60 pmol) was immobilized on anti-human placental alkaline phosphatase-agarose beads (0.1 ml). 3H-Radiolabeled HS chains (0.45 pmol) were mixed with FGF2 (4.5 pmol) and applied to the FR1c column in 30 μl of equilibration buffer (50 mm Tris/HCl, pH 7.4, 0.15 m NaCl). After 30 min of incubation at 4 °C, the column was eluted with a stepwise NaCl gradient ranging from 0.15 to 2 m in 50 mm Tris/HCl, pH 7.4. Effluent fractions (0.4 ml/fraction; 3 × 0.15 m NaCl, 1 × 0.2, 0.3, 0.4, 0.6, 0.8, and 2 m NaCl) were collected, and amounts of 3H-saccharides were analyzed by scintillation counting. Ternary complex formation was indicated by the proportion of saccharides eluted at >0.15–2 m NaCl (35).
Cell Activation Assays
The mutant (CHO745) target cells used in signaling assays lacked xylosyltransferase activity, which is required to attach the first sugar unit, xylose, to the protein core prior to polymerization of HS and CS chains. These cells thus lack both types of chains on all proteoglycans (38). They constitutively express a low number of FRs (31), mainly FR2c.5 CHO745 cells were cultured in Ham's F-12 medium supplemented with 8% fetal calf serum and 1% penicillin G (0.6%) and streptomycin sulfate (0.5%) at 37 °C, 5% CO2. Cells were plated in 3-cm dishes at a density of 250 × 103 cells/plate and grown for 20 h at 37 °C. The cells were subsequently starved in serum-free medium for 3 h before addition of FGF2, either alone (10 ng/ml) or in combination with HS pools (∼9, 5, and 3 ng/ml of pools I–III, respectively; ∼0.2 nm) or library-derived decasaccharides (1 ng/ml). FGF2 and saccharides were mixed just before application to the cells. After incubation periods ranging from 0 to 80 min, the cells were lysed by adding 130 μl of boiling sample buffer (0.2 m Tris, pH 8, 5 mm EDTA, 0.5 m sucrose, 1% SDS, 0.2 mm Na3VO4, 10 μg/ml pepstatin), ultrasonicated for 6 s, and centrifuged for 15 min at 13,000 × g at 4 °C. The supernatants were kept at −20 °C until further analysis. Equivalent amounts of the samples were run on 12% SDS-PAGE (50) and transferred to Immobilon-P overnight at 4 °C in transfer buffer (25 mm Tris, pH 8.3, 192 mm glycine, 20% methanol) at 90 mA. Membranes were blocked for 1 h at room temperature in Tris-buffered saline (TBS: 50 mm Tris, pH 7.4, 150 mm NaCl), containing 0.1% Tween 20 and 5% (w/v) ECL advance blocking agent. Next, the membranes were incubated with the primary rabbit antibody diluted 1:1000 in TBS, 0.1% Tween 20, 2% (w/v) blocking agent for 1.5–2 h at room temperature. The membranes were washed four times with TBS, 0.1% Tween 20 and then incubated with horseradish peroxidase-linked anti-rabbit antibody (1:2000 dilution in TBS, 0.1% Tween 20, 2% (w/v) blocking agent) for 1 h, washed four times with TBS, 0.1% Tween 20 again, and developed by an ECL detection system as described by the manufacturer. Phosphorylated Akt was always detected first, and the membranes were washed as above and reprobed with anti-phospho-ERK1/2-antibody (1:1000 dilution). After the second detection, the membranes were stripped with 0.1 m glycine/HCl, pH 2.5, and reprobed with anti-total ERK1/2 antibody (1:1000 dilution). Membranes were exposed to x-ray films for various periods of time. Films were scanned using an Epson Perfection 3170 photo scanner and bands quantified using Quantity One software from Bio-Rad. Signals were related to total ERK1/2 protein levels. To compare different experiments, activation with FGF2 at 7 min was used as a reference point and set to 1 arbitrary unit in all experiments. Statistical analysis was performed with InStat software (GraphPad).
RESULTS
HS Chain Length-related Substitution Patterns
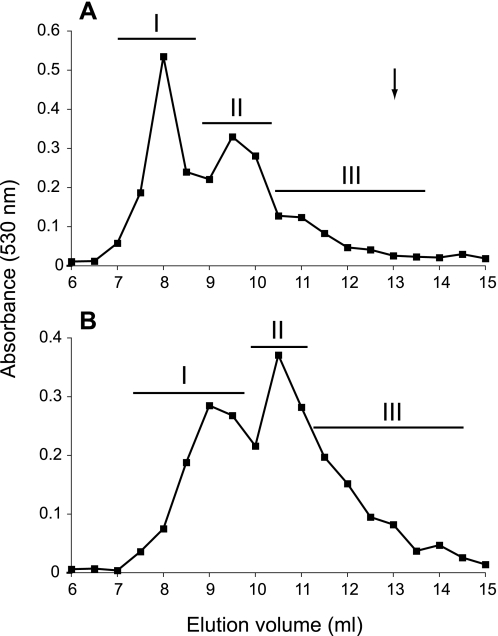
HS species isolated from porcine liver and intestine were separated according to chain length. Both HS preparations yielded heterogeneous separation patterns on a Superose 12 sizing column and were divided into three size-restricted pools (Fig. 3). Based on calibration of the column with size-defined oligosaccharides and polysaccharides, liver HS fractions I–III would correspond to polysaccharides of approximate average size of 45 (∼180-mer), 25 (∼100-mer), and 15 kDa (∼60-mer), respectively. These individual populations were further analyzed in terms of their disaccharide composition and domain organization.
FIGURE 3.
Sizing chromatography of HS isolated from porcine tissues. HS isolated from liver (A) and intestine (B) were separated by chromatography on a Superose 12 column. Fractions were collected, assayed for uronic acid content, and pooled into three subpopulations as indicated by bars. The arrow indicates the elution position of a size-defined 26-mer heparin oligosaccharide.
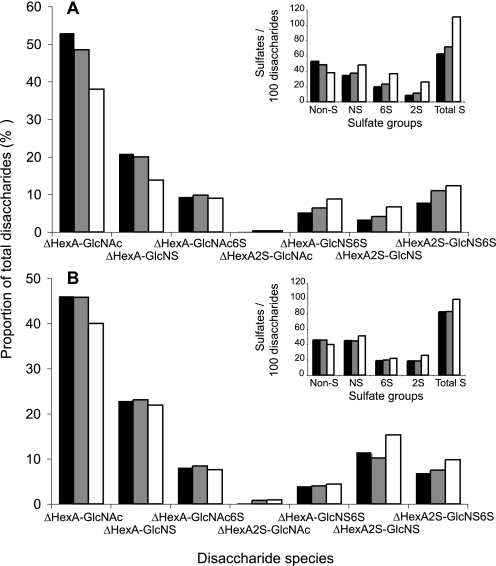
Exhaustive digestion of the various HS fractions with a heparin lyase mixture, followed by separation of digests by reversed-phase ion pairing-HPLC, yielded disaccharide patterns (Fig. 4) that typically differed in a tissue-specific manner (6). Differences were most pronounced for the di- and trisulfated disaccharide species containing a GlcNS unit and either a hexuronic acid 2-O-sulfate (ΔHexA2S-GlcNS), a glucosamine 6-O-sulfate (ΔHexA-GlcNS6S), or both O-sulfate groups (ΔHexA2S-GlcNS6S). Additionally, the overall degrees of N-, 2-O-, 6-O-, and total sulfation were calculated (Fig. 4, insets). The differences in composition were modest for intestine HS pools I–III and more pronounced between liver HS populations I and III. In particular, the shortest liver HS chains contained more of the di- and trisulfated disaccharides species and less nonsulfated N-acetylated disaccharide units than the longer chains. The reciprocal relation of sulfation to chain length in liver HS applied to all types of sulfate substituents (N-, 2-O-, and 6-O-), thus to total sulfation. Again, similar relations, although less pronounced, were observed also for HS isolated from intestine. These differences may conceivably be ascribed to effects of HS proteoglycan turnover, mediated by the endo-glucuronidase, heparanase. The low molecular weight fractions III may, largely or in part, consist of chain fragments released from the peripheral portions of proteoglycan-associated longer chains by heparanase, and thus lack the predominantly N-acetylated saccharide regions proximal to the core protein(s) (51).
FIGURE 4.
Disaccharide composition of HS chains assessed following extensive heparin lyase cleavage. HS from liver (A) and intestine (B) subpopulations was completely degraded to disaccharides by a mixture of heparin lyases. Disaccharides were analyzed by reversed-phase ion pairing-HPLC and fluorescent detection after post-column condensation with cyanoacetamide and quantified against standard disaccharides (6). The different disaccharide species are plotted as percent of all lyase-generated disaccharides. Insets, overall numbers of nonsulfated (Non-S), N-sulfated (NS), 2-O-sulfated (2S), and 6-O-sulfated (6S) disaccharides/100 disaccharides were calculated, and the resulting overall degree of sulfation is shown (Total S). Black bars represent pool I, gray bars pool II, and white bars pool III of each HS preparation.
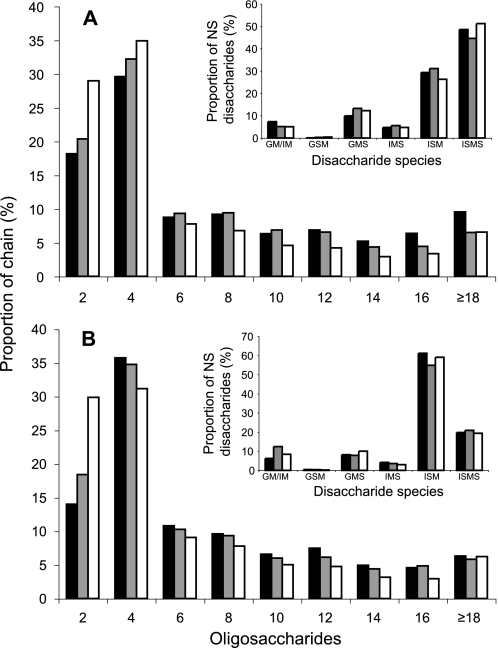
Samples were selectively degraded to yield fragments representing separate domains of the HS chains. N-Deacetylation (42) followed by deamination at pH 3.9 (52) releases disaccharides from NA domains, tetrasaccharides from NA/NS domains, and >4-mers representing NS domains. Quantification of these oligosaccharides, following separation by gel chromatography, indicated proportions of disaccharides (most abundant), 4-mers, and >4-mers (least abundant) that differed in essentially a similar manner for all fractions (I–III from liver and intestine HS), except for a slight over-representation of >4-mers in fractions III from both HS samples (data not shown). Conversely, deamination at pH 1.5 generates disaccharides from NS domains, tetrasaccharides from NA/NS domains, and >4-mers representing NA domains. The results of such degradation, applied to liver (Fig. 5A) and intestine (Fig. 5B) HS, showed a consistent increase of NS-derived disaccharides and a decrease of NA-oligosaccharides with decreasing chain length, without any marked difference regarding tissue source. However, compositional analysis of the NS domains by anion-exchange HPLC of the disaccharide products revealed conspicuously inversed proportions of iduronate-2-O-sulfate-anhydromannitol and iduronate-2-O-sulfate-anhydromannitol-6-O-sulfate, derived from -GlcNS↓-IdoUA2S-GlcNS- and -GlcNS↓-IdoUA2S-GlcNS6S- sequences, respectively, between liver and intestine HS (Fig. 5, insets).
FIGURE 5.
HS domain content and disaccharide composition assessed by deamination at pH 1. 5. HS pool I (black), pool II (gray), and pool III (white) from liver (A) and intestine (B) were treated with HNO2 at pH 1.5, and the products were reduced with NaB3H4. The resulting end-labeled oligosaccharides were analyzed on an FPLC system as described under “Experimental Procedures.” Peak areas, multiplied by factors corresponding to the number of disaccharide units in the respective oligosaccharides, were used to calculate the contribution of each species to intact chains. The disaccharide fractions were further analyzed by strong anion-exchange HPLC (insets), and the proportion of the different disaccharide species was calculated. GM, glucuronate-anhydromannitol; IM, iduronate-anhydromannitol; GSM, glucuronate-2-O-sulfate-anhydromannitol; GMS, glucuronate-anhydromannitol-6-O-sulfate; IMS, iduronate-anhydromannitol-6-O-sulfate; ISM, iduronate-2-O-sulfate-anhydromannitol; ISMS, iduronate-2-O-sulfate-anhydromannitol-6-O-sulfate.
Formation of Binary FGF2·HS and Ternary FGF·HS·FR1c Complexes Related to HS Chain Length
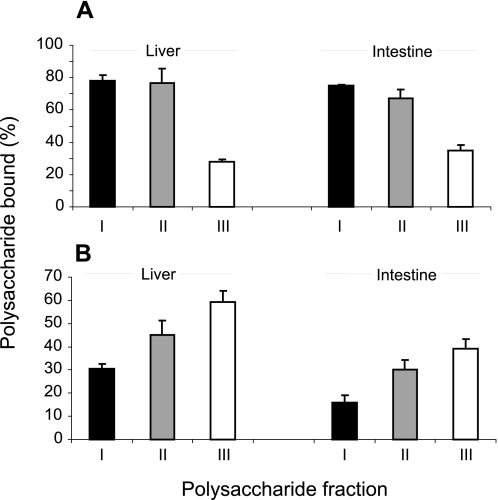
Each of the separated pools was tested for binary and ternary complex formation with FGF2 and FGF-FR1c, respectively. Binary complex formation was assessed in a nitrocellulose filter-based protein trapping system, using approximately equal molar amounts of the various [3H]acetyl-labeled HS fractions. The amounts of bound polysaccharide reflect the interaction states in solution at equilibrium (49), and thus provide relative measures of the protein binding capacities of the polysaccharide samples. Fractions I and II of both liver and intestine HS were retained by the filter to a larger extent than fraction III (Fig. 6A). FGF2 binding was previously shown to require an NS domain of minimal pentamer size, with at least one critical 2-O-sulfate group (53, 54). The results presumably reflect the distribution of such sites along the polymer chains, hence a correlation of binding avidity to increasing HS chain length.
FIGURE 6.
Formation of binary FGF2·HS and ternary FGF2·HS·FR1c complexes. A, binding between FGF-2 and size-fractionated HS subpopulations. Approximately equal molar amounts of 3H N-acetylated HS pools I (black), II (gray), and III (white) from liver and intestine were incubated with FGF2. Protein along with bound HS was retrieved on nitrocellulose filters, and the retained saccharides were determined as radioactive counts. Results are presented as proportion retained saccharides of the total amounts applied. B, ternary complex formation between FGF, FR1c, and HS pools. Approximately equal molar amounts of liver and intestine HS pools I–III were loaded together with FGF2 to a FR1c column, incubated, and eluted with increasing salt concentrations. Results are presented as the proportion of the total amounts of each saccharide applied that was eluted at >0.15–2.0 m NaCl. Standard means ± S.E. were calculated from three experiments.
We next assessed the ability of the various HS pools to promote complex formation between FGF2 and FR1c. Our previous work showed that simultaneous application of FGF2 and saccharides to immobilized FR1c leads to formation of ternary complexes, where the saccharide interacts with both protein partners (35). The saccharide fraction retained on the column at physiological ionic strength and eluted at higher salt concentration was assumed to represent material involved in ternary complex formation. Equal molar amounts of liver and intestine HS pools were applied together with FGF2 to the immobilized FR1c, followed by elution at increasing salt concentrations. All three liver HS pools showed more abundant ternary complex formation than intestine HS pools of approximately corresponding length (Fig. 6B). Unexpectedly, HS from both tissue sources revealed an inverse correlation between complex formation and polymer chain length, the percentage of saccharides eluted above physiological NaCl concentration increasing from pool I to III (Fig. 6B).
Differential Effect of HS Pools on CHO745 Cell Activation
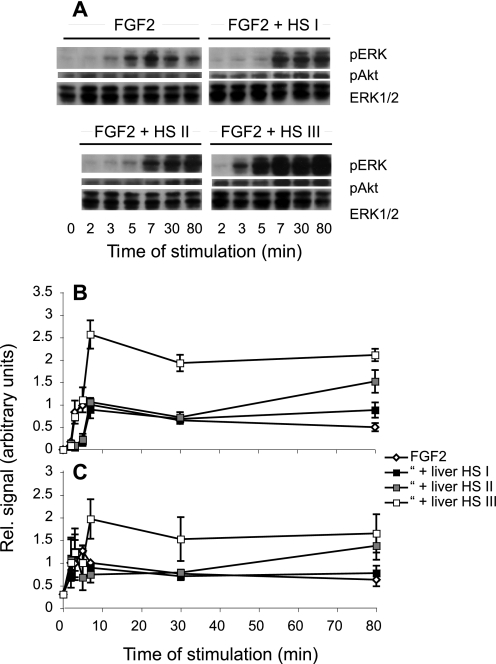
We next determined the effects of different HS fractions on FGF2-induced cell signaling. Liver and intestine HS pools were compared with regard to their ability to support FGF2-induced cell activation. Phosphorylation of ERK1/2 and Akt was measured in CHO745 target cells, following activation by FGF2 alone or in combination with HS (Fig. 7). Addition of HS pools differentially affected cell signaling. Although neither liver HS pools (Fig. 7) nor the intestine HS pools (data not shown) showed any obvious enhancing effect on signaling during the early phases of stimulation, they all appeared to stabilize or even slightly augment the levels of both phosphorylated ERK1/2 (phospho-ERK1/2) and Akt (phospho-Akt) after 80 min, with liver pool I having the weakest effect. By contrast, liver HS pool III markedly promoted both ERK1/2 (Fig. 7B) and Akt (Fig. 7C) activation at all time points beyond 5 min. Notably, this stimulatory effect was obtained with pool III from liver HS only, not with pool III from intestine HS (data not shown). Remarkably, the ERK1/2 phosphorylation induced by FGF2 alone was actually delayed for about 5 min in the presence of liver HS pools I and II, whereas Akt phosphorylation was unaffected (Fig. 7C).
FIGURE 7.
Effect of liver HS pools on FGF2-induced ERK1/2 and Akt phosphorylation. CHO745 cells, lacking endogenous HS and CS, were activated with FGF2 (10 ng/ml) alone or together with liver HS pools (9, 5, and 3 ng/ml of pools I–III, respectively). Incubation was interrupted after the indicated periods of time by addition of boiling sample buffer, and cell lysates were separated on SDS-PAGE and analyzed by Western blotting, as described under “Experimental Procedures.” Blots are shown from one experiment in A, and the quantified signals for phosphorylation of ERK1/2 (B) and Akt (C) from at least three independent experiments are plotted against time. Standard means ± S.E. were calculated from three independent experiments.
Effect of Oligosaccharide Libraries on Cell Signaling
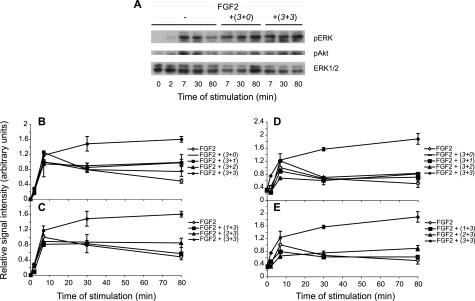
Finally, we investigated the effect of N-sulfated oligosaccharides on cell signaling. Phosphorylation of ERK1/2 and Akt was measured in CHO745 target cells, devoid of endogenous glycosaminoglycans, following activation by FGF2 alone or in combination with saccharides. Because of the substantial heterogeneity of NS domains isolated from the individual HS pools, we instead turned to heparin-derived decasaccharides with defined and systematic variation in O-sulfation (Fig. 2). Previous cell-free experiments using these oligosaccharide libraries showed that the stability of complexes with FGF1 or FGF2 and various FRs increased with increasing sulfation density of the saccharides, whereas the detailed sulfation pattern appeared not to be important (35). Cells were stimulated with FGF2 in the presence or absence of decasaccharides carrying three to six O-sulfate groups, distributed as follows: (3 + 0), (3 + 1), (3 + 2), (1 + 3), (2 + 3), and (3 + 3), where the first digit denotes the number of 2-O- and the second the number of 6-O-sulfate groups. FGF2 alone induced transient phosphorylation of ERK1/2 and Akt that was maximal after 7 min of stimulation and then gradually decreased (Fig. 8A). Application of the growth factor and decasaccharides carrying (3 + 0), (3 + 1), (3 + 2) (Fig. 8, B and D), and (1 + 3), (2 + 3) O-sulfate groups (Fig. 8, C and E) had a small but consistent effect on the duration of both ERK1/2 and Akt phosphorylation, signals remaining essentially stable throughout the 80-min observation period (Fig. 8). These observations suggest that the oligosaccharides tested, containing up to 5 O-sulfate groups, merely maintained signaling intensity, either by protecting the growth factor from degradation or by increasing the stability of the FGF·FR complex. By contrast, decasaccharide (3 + 3), containing a single additional O-sulfate group, clearly promoted both ERK1/2 and Akt phosphorylation, which was then sustained at high levels for at least 80 min (Fig. 8, B–E).
FIGURE 8.
Cell activation by FGF2 and decasaccharides with different numbers of O-sulfate groups. CHO745 cells were incubated for the indicated periods of time with FGF2 (10 ng/ml), either alone or in the presence of oligosaccharides (∼1 ng/ml) with the specified numbers of 2-O- and 6-O-sulfate groups (see Fig. 2 for designation). Stimulation of CHO745 cells was interrupted at the time points indicated, and cell lysates were analyzed as in Fig. 7. Representative blots are shown in A. Results from several experiments were quantified and plotted versus stimulation time for phospho-ERK (B and C) and phospho-Akt (D and E). Values are averages of 2 to 3 repeat experiments. For the sake of clarity, the data sets for each target protein are presented in two separate panels with the curves for FGF and FGF + (3 + 3) oligosaccharides from the same experimental series indicated in both panels for comparison.
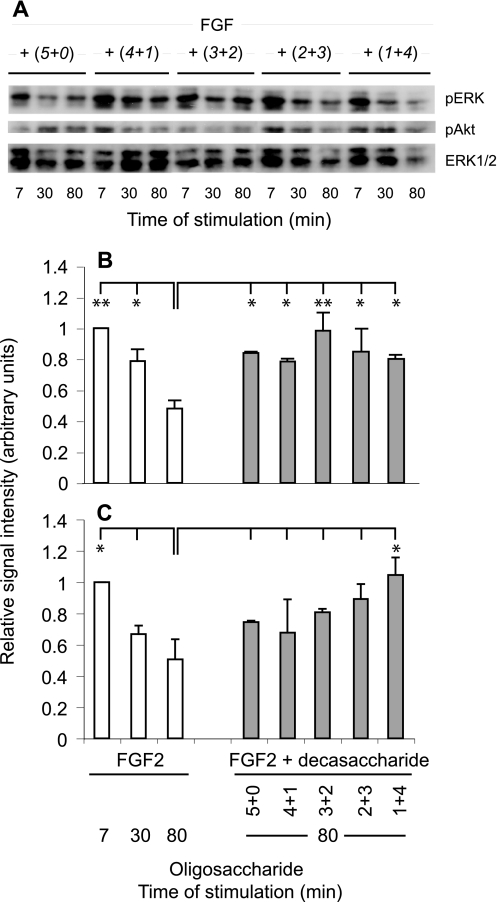
The results illustrated in Fig. 8 pointed to overall sulfation levels as an important parameter in HS-supported receptor activation by FGF2 but did not reveal any preference for 2-O- or 6-O-sulfate groups. Further experiments were designed to clarify whether the two types of sulfate substituents are functionally interchangeable. To this end, phospho-ERK1/2 and phospho-Akt were determined following exposure of CHO745 cells to FGF2 along with several decasaccharide species ((5 + 0), (4 + 1), (3 + 2) (2 + 3), and (1 + 4)), all containing 5 O-sulfate groups albeit with different 2-O-/6-O-sulfate ratios. All decasaccharides showed similar signal-prolonging effects on both pathways, as evidenced by the signal intensities recorded 80 min after exposure to FGF2 in the presence or absence of saccharides (Fig. 9). Notably, in previous experiments, the same oligosaccharides showed similar intermediary ability to promote ternary complex formation with FGF2 and FR1c-3c (Fig. 6 in Ref. 35). These results enforce the notion that ERK1/2 and Akt phosphorylation may be supported by oligosaccharides with variable distribution of 2-O- and 6-O-sulfate groups.
FIGURE 9.
Cell activation by FGF2 and decasaccharides with the same total number of O-sulfate groups. Results were obtained as described in Fig. 8. A, representative Western blot of protein extracts incubated with anti-pERK, anti-pAkt, and anti-ERK1/2, respectively. B, phospho-ERK1/2; C, phospho-Akt levels at the indicated time points following stimulation with FGF2 alone or after 80 min of stimulation in the presence of FGF2 and the indicated decasaccharides. Values are averages of three repeat experiments. Statistical comparison was performed between the indicated pairs and reached significance where indicated with p < 0.01 (**) and p < 0.05 (*).
DISCUSSION
Stimulation of FRs by FGFs activates several intracellular signaling pathways that are cell type-specific but usually involve MAPK cascades and PI3K-Akt and PLCγ pathways (20, 23). Formation of FGF·FR signaling complexes is generally believed to be promoted by HS chains that bind both the growth factors and the receptors (25, 26). Various biochemical and biophysical approaches, as well as cellular and animal model systems, have been used to identified HS structures capable of interaction with different FGFs and FGF-FR pairs, hence induction of FGF signaling (27–32, 34, 37, 54–59). Structure/function aspects of HS in FGF signaling are controversial, and some reports imply that even subtle structural differences between saccharide sequences translate into stimulation or inhibition (28, 29), whereas others favor an element of structural redundancy. According to the latter view, various HS structural motifs may serve to promote a defined FGF-induced signaling event, and lack of a particular agonist sequence may be compensated through other structures (32, 34, 57–61).
In this study, we have compared size-fractionated pools of full-length HS chains isolated from porcine liver and intestine regarding interaction with FGF2 alone, FGF2 along with FR1c, and ability to promote FGF2-induced signaling. Experiments with FGF2 alone and HS pools showed that binding capacity increased with HS chain length (Fig. 6A), presumably due to an increase in number of FGF2-binding sites, and hence in avidity. By contrast, ternary FGF2·HS·FR1c complex formation declined with increasing chain length (Fig. 6B). We note that NS domains, composed of highly sulfated disaccharide units, are most abundant in the shorter HS chains (Fig. 5), and our previous analysis of N-sulfated octa- and decamer oligosaccharides in FGF2·HS·FR1c complexes pointed to a correlation between the overall degree of O-sulfation and ternary complex formation (35).
To study the impact of HS pools on cell signaling, we used CHO745 cells devoid of both endogenous HS and CS, because not only HS but also CS can bind FGF2 (62), and overexpression of CS as a consequence of HS deficiency may influence cell stimulation (63, 64). Two downstream signaling pathways involving ERK1/2 and Akt were investigated and showed that stimulation with FGF2 alone led to transient phosphorylation of both ERK1/2 and Akt. Effects of co-application of size-fractionated HS pools were generally modest but consistently involved prolongation of signals (Fig. 7). Such effects are potentially important, as the duration of FGF-induced signaling may determine not only the intensity but also the type of cellular response (23, 65–67). By contrast, liver HS pool III alone not only prolonged but also strongly potentiated both types of signals (Fig. 7). NS domains in intestine HS pool III were at least as frequent but were relatively low in 6-O-sulfate groups (Fig. 5B, inset). The selective stimulatory properties of liver HS pool III on cell signaling would appear to mirror the superior ability of this fraction to promote complex formation with FGF2 and FR1c (Fig. 6B).
The effect of NS domain fine structure on FGF2-induced cell signaling was tested using oligosaccharides with systematically varied O-sulfation. Addition of decasaccharides carrying three to five differently distributed O-sulfate groups prolonged both types of signals, without any apparent preference for 2-O- or 6-O-sulfate groups and with only modest effect on signaling amplitude (Figs. 8 and 9). By contrast, “heparin-like” species with six O-sulfate groups (3 + 3 distribution) induced markedly elevated and sustained activation of both ERK1/2 and Akt pathways (Fig. 8). These results agree with our previous findings that, although decasaccharides carrying ≥4 O-sulfate groups could promote FGF1/2·FR complex formation, species with ≥6 O-sulfate groups generated more stable complexes (35). A weak, penta-O-sulfated (3 + 2) decasaccharide signaling activator is thus transformed into a highly active and long lasting (3 + 3) agonist by incorporation of a single additional 6-O-sulfate group (Fig. 8). This difference in activity appears proportionally similar to that shown by liver HS pool III compared with the other HS pools investigated (Fig. 7).
The precise mechanism(s) by which HS chains and oligosaccharides may affect FGF action remain intriguing. On one hand, our findings seem to support the notion that FGF signaling does not critically depend on HS fine structure and agree with other studies showing that variously modified HS structures may be active at the cellular level (32,30, 34) as well as in vivo (59, 61). Duration and intensity of signaling correlate with saccharide sulfate density. On the other hand, we are impressed by the striking effects of single sulfate groups, as demonstrated by the (3 + 3) decasaccharide (Fig. 8) and revealed also in a study of modified heparin oligosaccharides (68). We cannot exclude that such groups are required to complete an FGF-FR-binding site involving a specific combination of sulfate substituents, which may be obscured by other redundant yet tolerated residues. A bona fide binding site may thus reside in variously sulfated saccharide sequences, and its formation may be controlled through levels rather than sequence of different sulfate groups (13). Such “hidden” specificity would be compatible with the isolation from partially depolymerized, native HS of a low abundance oligosaccharide species displaying the minimal constellation of sulfate groups required to generate a particular protein-binding site, along with other more sulfated binding species (29). A solution to this problem will require access to a range of synthetic oligosaccharides, defined not only (as in the present study) regarding contents but also sequence of different sulfate groups.
We have proposed that the major purpose of regulation in HS biosynthesis is to ensure generation of charged domains, appropriately spaced along the polysaccharide chain and of adequate sulfate level, rather than regions of precisely defined sequence (9). The stoichiometry of FGF·FR complexes along an HS chain may depend on domain size, as suggested by recent studies using various heparin oligosaccharides (68). Domain organization may further affect growth factor stability, level, and duration of receptor occupancy, relation between receptor kinase activity, and phosphatase-catalyzed receptor dephosphorylation, as well as additional processes of potential functional importance, such as endocytosis of receptor complexes (21, 69–71). Moreover, growth factors and morphogens diffuse from sites of secretion to target cells through formation of concentration gradients that may be stabilized and controlled through interactions between the proteins and cell-surface HS proteoglycans (60). The sulfated domains of HS chains thus are required not only in actual signaling events at the receptor level but also serve to ascertain growth factor availability at appropriate concentrations.
Acknowledgments
We thank Gunilla Pettersson for assistance with HS preparations and oligosaccharide libraries, A. C. Rapraeger for the FR1c-alkaline phosphatase protein, and Lena Claesson-Welsh for CHO745 cells.
This work was supported by Swedish Research Council Grant 150223, Swedish Cancer Society, Swedish Foundation for Strategic Research Grant A303:156e, and Polysackaridforskning AB.
R. Ramachandra and D. Spillmann, unpublished results.
- HS
- heparan sulfate
- Akt
- protein kinase B
- CS
- chondroitin sulfate
- FR
- FGF receptor
- GlcA
- glucuronic acid
- GlcNS
- N-sulfated glucosamine
- NA
- N-acetylated
- NS
- N-sulfated
- 2S
- 2-O-sulfated
- 6S
- 6-O-sulfated
- IdoUA
- iduronic acid.
REFERENCES
- 1.Bernfield M., Götte M., Park P. W., Reizes O., Fitzgerald M. L., Lincecum J., Zako M. (1999) Annu. Rev. Biochem. 68, 729–777 [DOI] [PubMed] [Google Scholar]
- 2.Iozzo R. V. (2005) Nat. Rev. Mol. Cell Biol. 6, 646–656 [DOI] [PubMed] [Google Scholar]
- 3.Esko J. D., Lindahl U. (2001) J. Clin. Invest. 108, 169–173 [DOI] [PMC free article] [PubMed] [Google Scholar]
- 4.Gallagher J. T. (2001) J. Clin. Invest. 108, 357–361 [DOI] [PMC free article] [PubMed] [Google Scholar]
- 5.Maccarana M., Sakura Y., Tawada A., Yoshida K., Lindahl U. (1996) J. Biol. Chem. 271, 17804–17810 [DOI] [PubMed] [Google Scholar]
- 6.Ledin J., Staatz W., Li J. P., Götte M., Selleck S., Kjellén L., Spillmann D. (2004) J. Biol. Chem. 279, 42732–42741 [DOI] [PubMed] [Google Scholar]
- 7.Lindahl U., Kusche-Gullberg M., Kjellén L. (1998) J. Biol. Chem. 273, 24979–24982 [DOI] [PubMed] [Google Scholar]
- 8.Capila I., Linhardt R. J. (2002) Angew. Chem. Int. Ed. Engl. 41, 391–412 [DOI] [PubMed] [Google Scholar]
- 9.Kreuger J., Spillmann D., Li J. P., Lindahl U. (2006) J. Cell Biol. 174, 323–327 [DOI] [PMC free article] [PubMed] [Google Scholar]
- 10.Lortat-Jacob H., Turnbull J. E., Grimaud J. A. (1995) Biochem. J. 310, 497–505 [DOI] [PMC free article] [PubMed] [Google Scholar]
- 11.Spillmann D., Witt D., Lindahl U. (1998) J. Biol. Chem. 273, 15487–15493 [DOI] [PubMed] [Google Scholar]
- 12.Kreuger J., Matsumoto T., Vanwildemeersch M., Sasaki T., Timpl R., Claesson-Welsh L., Spillmann D., Lindahl U. (2002) EMBO J. 21, 6303–6311 [DOI] [PMC free article] [PubMed] [Google Scholar]
- 13.Lindahl U., Li J. P. (2009) Int. Rev. Cell. Mol. Biol. 276, 105–159 [DOI] [PubMed] [Google Scholar]
- 14.Gorsi B., Stringer S. E. (2007) Trends Cell Biol. 17, 173–177 [DOI] [PubMed] [Google Scholar]
- 15.Powers C. J., McLeskey S. W., Wellstein A. (2000) Endocr. Relat. Cancer 7, 165–197 [DOI] [PubMed] [Google Scholar]
- 16.Ornitz D. M., Itoh N. (2001) Genome Biol. 2, Reviews 3005.3001–3005.3012 [DOI] [PMC free article] [PubMed] [Google Scholar]
- 17.Bikfalvi A., Klein S., Pintucci G., Rifkin D. B. (1997) Endocr. Rev. 18, 26–45 [DOI] [PubMed] [Google Scholar]
- 18.Reuss B., von Bohlen und Halbach O. (2003) Cell Tissue Res. 313, 139–157 [DOI] [PubMed] [Google Scholar]
- 19.Presta M., Dell'Era P., Mitola S., Moroni E., Ronca R., Rusnati M. (2005) Cytokine Growth Factor Rev. 16, 159–178 [DOI] [PubMed] [Google Scholar]
- 20.Eswarakumar V. P., Lax I., Schlessinger J. (2005) Cytokine Growth Factor Rev. 16, 139–149 [DOI] [PubMed] [Google Scholar]
- 21.Katz M., Amit I., Yarden Y. (2007) Biochim. Biophys. Acta 1773, 1161–1176 [DOI] [PMC free article] [PubMed] [Google Scholar]
- 22.Boilly B., Vercoutter-Edouart A. S., Hondermarck H., Nurcombe V., Le Bourhis X. (2000) Cytokine Growth Factor Rev. 11, 295–302 [DOI] [PubMed] [Google Scholar]
- 23.Dailey L., Ambrosetti D., Mansukhani A., Basilico C. (2005) Cytokine Growth Factor Rev. 16, 233–247 [DOI] [PubMed] [Google Scholar]
- 24.Yayon A., Klagsbrun M., Esko J. D., Leder P., Ornitz D. M. (1991) Cell 64, 841–848 [DOI] [PubMed] [Google Scholar]
- 25.Mohammadi M., Olsen S. K., Ibrahimi O. A. (2005) Cytokine Growth Factor Rev. 16, 107–137 [DOI] [PubMed] [Google Scholar]
- 26.Harmer N. J. (2006) Biochem. Soc. Trans. 34, 442–445 [DOI] [PubMed] [Google Scholar]
- 27.Guimond S., Maccarana M., Olwin B. B., Lindahl U., Rapraeger A. C. (1993) J. Biol. Chem. 268, 23906–23914 [PubMed] [Google Scholar]
- 28.Guimond S. E., Turnbull J. E. (1999) Curr. Biol. 9, 1343–1346 [DOI] [PubMed] [Google Scholar]
- 29.Pye D. A., Vives R. R., Turnbull J. E., Hyde P., Gallagher J. T. (1998) J. Biol. Chem. 273, 22936–22942 [DOI] [PubMed] [Google Scholar]
- 30.Kariya Y., Kyogashima M., Suzuki K., Isomura T., Sakamoto T., Horie K., Ishihara M., Takano R., Kamei K., Hara S. (2000) J. Biol. Chem. 275, 25949–25958 [DOI] [PubMed] [Google Scholar]
- 31.Lundin L., Larsson H., Kreuger J., Kanda S., Lindahl U., Salmivirta M., Claesson-Welsh L. (2000) J. Biol. Chem. 275, 24653–24660 [DOI] [PubMed] [Google Scholar]
- 32.Merry C. L., Bullock S. L., Swan D. C., Backen A. C., Lyon M., Beddington R. S., Wilson V. A., Gallagher J. T. (2001) J. Biol. Chem. 276, 35429–35434 [DOI] [PubMed] [Google Scholar]
- 33.Allen B. L., Filla M. S., Rapraeger A. C. (2001) J. Cell Biol. 155, 845–858 [DOI] [PMC free article] [PubMed] [Google Scholar]
- 34.Wu Z. L., Zhang L., Yabe T., Kuberan B., Beeler D. L., Love A., Rosenberg R. D. (2003) J. Biol. Chem. 278, 17121–17129 [DOI] [PubMed] [Google Scholar]
- 35.Jastrebova N., Vanwildemeersch M., Rapraeger A. C., Giménez-Gallego G., Lindahl U., Spillmann D. (2006) J. Biol. Chem. 281, 26884–26892 [DOI] [PubMed] [Google Scholar]
- 36.Lindahl U., Lidholt K., Spillmann D., Kjellén L. (1994) Thromb. Res. 75, 1–32 [DOI] [PubMed] [Google Scholar]
- 37.Allen B. L., Rapraeger A. C. (2003) J. Cell Biol. 163, 637–648 [DOI] [PMC free article] [PubMed] [Google Scholar]
- 38.Esko J. D., Stewart T. E., Taylor W. H. (1985) Proc. Natl. Acad. Sci. U.S.A. 82, 3197–3201 [DOI] [PMC free article] [PubMed] [Google Scholar]
- 39.Cuellar K., Chuong H., Hubbell S. M., Hinsdale M. E. (2007) J. Biol. Chem. 282, 5195–5200 [DOI] [PubMed] [Google Scholar]
- 40.Lindahl U., Cifonelli J. A., Lindahl B., Roden L. (1965) J. Biol. Chem. 240, 2817–2820 [PubMed] [Google Scholar]
- 41.Linker A., Hovingh P. (1973) Carbohydr. Res. 29, 41–62 [DOI] [PubMed] [Google Scholar]
- 42.Guo Y. C., Conrad H. E. (1989) Anal. Biochem. 176, 96–104 [DOI] [PubMed] [Google Scholar]
- 43.Höök M., Riesenfeld J., Lindahl U. (1982) Anal. Biochem. 119, 236–245 [DOI] [PubMed] [Google Scholar]
- 44.Shively J. E., Conrad H. E. (1976) Biochemistry 15, 3932–3942 [DOI] [PubMed] [Google Scholar]
- 45.Pejler G., Bäckström G., Lindahl U., Paulsson M., Dziadek M., Fujiwara S., Timpl R. (1987) J. Biol. Chem. 262, 5036–5043 [PubMed] [Google Scholar]
- 46.Bienkowski M. J., Conrad H. E. (1985) J. Biol. Chem. 260, 356–365 [PubMed] [Google Scholar]
- 47.Blumenkrantz N., Asboe-Hansen G. (1973) Anal. Biochem. 54, 484–489 [DOI] [PubMed] [Google Scholar]
- 48.Jemth P., Kreuger J., Kusche-Gullberg M., Sturiale L., Giménez-Gallego G., Lindahl U. (2002) J. Biol. Chem. 277, 30567–30573 [DOI] [PubMed] [Google Scholar]
- 49.Kreuger J., Lindahl U., Jemth P. (2003) Methods Enzymol. 363, 327–339 [DOI] [PubMed] [Google Scholar]
- 50.Laemmli U. K. (1970) Nature 227, 680–685 [DOI] [PubMed] [Google Scholar]
- 51.Lyon M., Steward W. P., Hampson I. N., Gallagher J. T. (1987) Biochem. J. 242, 493–498 [DOI] [PMC free article] [PubMed] [Google Scholar]
- 52.Kreuger J., Prydz K., Pettersson R. F., Lindahl U., Salmivirta M. (1999) Glycobiology 9, 723–729 [DOI] [PubMed] [Google Scholar]
- 53.Maccarana M., Casu B., Lindahl U. (1993) J. Biol. Chem. 268, 23898–23905 [PubMed] [Google Scholar]
- 54.Kreuger J., Salmivirta M., Sturiale L., Giménez-Gallego G., Lindahl U. (2001) J. Biol. Chem. 276, 30744–30752 [DOI] [PubMed] [Google Scholar]
- 55.Schlessinger J., Plotnikov A. N., Ibrahimi O. A., Eliseenkova A. V., Yeh B. K., Yayon A., Linhardt R. J., Mohammadi M. (2000) Mol. Cell 6, 743–750 [DOI] [PubMed] [Google Scholar]
- 56.Pellegrini L., Burke D. F., von Delft F., Mulloy B., Blundell T. L. (2000) Nature 407, 1029–1034 [DOI] [PubMed] [Google Scholar]
- 57.Ostrovsky O., Berman B., Gallagher J., Mulloy B., Fernig D. G., Delehedde M., Ron D. (2002) J. Biol. Chem. 277, 2444–2453 [DOI] [PubMed] [Google Scholar]
- 58.Kreuger J., Jemth P., Sanders-Lindberg E., Eliahu L., Ron D., Basilico C., Salmivirta M., Lindahl U. (2005) Biochem. J. 389, 145–150 [DOI] [PMC free article] [PubMed] [Google Scholar]
- 59.Kamimura K., Koyama T., Habuchi H., Ueda R., Masu M., Kimata K., Nakato H. (2006) J. Cell Biol. 174, 773–778 [DOI] [PMC free article] [PubMed] [Google Scholar]
- 60.Lander A. D. (2007) Cell 128, 245–256 [DOI] [PubMed] [Google Scholar]
- 61.Li J. P., Gong F., Hagner-McWhirter A., Forsberg E., Abrink M., Kisilevsky R., Zhang X., Lindahl U. (2003) J. Biol. Chem. 278, 28363–28366 [DOI] [PubMed] [Google Scholar]
- 62.Nandini C. D., Itoh N., Sugahara K. (2005) J. Biol. Chem. 280, 4058–4069 [DOI] [PubMed] [Google Scholar]
- 63.Taylor K. R., Rudisill J. A., Gallo R. L. (2005) J. Biol. Chem. 280, 5300–5306 [DOI] [PubMed] [Google Scholar]
- 64.Ida M., Shuo T., Hirano K., Tokita Y., Nakanishi K., Matsui F., Aono S., Fujita H., Fujiwara Y., Kaji T., Oohira A. (2006) J. Biol. Chem. 281, 5982–5991 [DOI] [PubMed] [Google Scholar]
- 65.Santos S. D., Verveer P. J., Bastiaens P. I. (2007) Nat. Cell Biol. 9, 324–330 [DOI] [PubMed] [Google Scholar]
- 66.Marshall C. J. (1995) Cell 80, 179–185 [DOI] [PubMed] [Google Scholar]
- 67.Whitmarsh A. J. (2007) Biochim. Biophys. Acta 1773, 1285–1298 [DOI] [PubMed] [Google Scholar]
- 68.Goodger S. J., Robinson C. J., Murphy K. J., Gasiunas N., Harmer N. J., Blundell T. L., Pye D. A., Gallagher J. T. (2008) J. Biol. Chem. 283, 13001–13008 [DOI] [PubMed] [Google Scholar]
- 69.Reiland J., Rapraeger A. C. (1993) J. Cell Sci. 105, 1085–1093 [DOI] [PubMed] [Google Scholar]
- 70.Sperinde G. V., Nugent M. A. (1998) Biochemistry 37, 13153–13164 [DOI] [PubMed] [Google Scholar]
- 71.Shaul Y. D., Seger R. (2007) Biochim. Biophys. Acta 1773, 1213–1226 [DOI] [PubMed] [Google Scholar]


