Abstract
Interactions between urokinase plasminogen activator receptor (uPAR) and its various ligands regulate tumor growth, invasion, and metastasis. Antibodies that bind specific uPAR epitopes may disrupt these interactions, thereby inhibiting these processes. Using a highly diverse and naïve human fragment of the antigen binding (Fab) phage display library, we identified 12 unique human Fabs that bind uPAR. Two of these antibodies compete against urokinase plasminogen activator (uPA) for uPAR binding, whereas a third competes with β1 integrins for uPAR binding. These competitive antibodies inhibit uPAR-dependent cell signaling and invasion in the non-small cell lung cancer cell line, H1299. Additionally, the integrin-blocking antibody abrogates uPAR/β1 integrin-mediated H1299 cell adhesion to fibronectin and vitronectin. This antibody and one of the uPAR/uPA antagonist antibodies shows a significant combined effect in inhibiting cell invasion through Matrigel/Collagen I or Collagen I matrices. Our results indicate that these antagonistic antibodies have potential for the detection and treatment of uPAR-expressing tumors.
Keywords: Antibodies/Monoclonal, Cancer, Cell/Adhesion, Cell/Migration, Extracellular Matrix/Fibronectin, β1-Integrin, uPA, uPAR
Introduction
The urokinase plasminogen activator receptor (uPAR/CD87)4 is a glycosylated protein of 45–55 kDa consisting of three homologous cysteine-rich domains. The protein is localized to the extracellular leaf of the plasma membrane through a glycosylphosphatidylinositol anchor. uPAR mediates a wide variety of cellular processes including inflammation (1), metastasis, and invasion (2, 3), tissue remodeling (4), angiogenesis (5), and cell adhesion (6).
Many of these processes are initiated by the highly specific binding of various ligands to membrane-bound uPAR. One such interaction is between uPAR and uPA, which mediates both extracellular and intracellular signaling events (7–9). Binding of extracellular pro-uPA to uPAR facilitates its activation (10). In turn, uPA activates proteases, such as plasmin, which directly and indirectly degrade the extracellular matrix (ECM). Furthermore, plasmin can activate pro-uPA, leading to a positive feedback loop that accelerates ECM degradation.
uPAR is also able to act intracellularly by activating proliferative signal transduction pathways. Although many of these proliferative signals are dependent on uPA binding, they are largely independent of uPA catalytic activity (11, 12). These uPAR-initiated intracellular signaling events are mediated by interaction with other proteins either directly or as part of a multiprotein complex (13).
Additionally, uPAR is believed to directly associate with integrin family adhesion receptors in complexes that mediate RGD-independent cell signaling and migration (14). Peptides and small molecules that disrupt uPAR/β1 integrin interactions have been shown to prevent tumor metastasis in animal models (15, 16).
The uPAR multidomain structure enables the binding of diverse ligands (17). In some cases it has been shown that the presence of uPA increases the affinity between uPAR and its ligands, such as vitronectin (18). Furthermore, uPAR/uPA-dependent signaling seems to require uPAR/integrin interactions (19, 20). Thus, uPAR serves to integrate an array of growth and migration signals from the extracellular milieu via a network of binding events. Therefore, identifying reagents that block these binding events is an active area of research.
Several peptides, peptidomimetics, small molecules, and antibodies that block uPAR/uPA have been identified (21); however, none of the peptide or small molecule approaches has advanced into clinical studies (22). Recent advances in highly selective antibody therapeutics against extracellular targets have made these molecules attractive reagents for targeting the uPAR/ligand interactions (23); however, fully human antibodies that bind uPAR with high affinity and interrupt uPA and β1 integrin binding have not been previously described.
Phage display technology provides a facile way to clone large repertoires of human antibody binding regions and screen for molecules that bind to a target such as uPAR. We describe a panel of anti-uPAR antibodies discovered from a highly diverse and naïve human Fab phage display library. Two Fabs that compete with uPA for uPAR binding and one Fab that competes with α5β1 integrin for uPAR binding were identified. These antibodies are capable of selectively labeling uPAR-expressing cells and inhibit uPAR-mediated cell signaling and migration. In addition, these human anti-uPAR antibodies were used to demonstrate that the inhibition of both the uPAR/uPA and uPAR/β1 interactions has an additive effect on cellular signaling and cancer cell migration.
EXPERIMENTAL PROCEDURES
uPAR Expression and Purification
Human soluble uPAR cDNA (residues 1–277) was ligated into the insect cell expression vector pACgp67 (BD Biosciences). pACgp67 and Baculogold DNA (BD Biosciences) were co-transfected into Spodoptera frugiperda 9 (Sf9) cells using LipofectamineTM (Invitrogen), and recombinant baculovirus was harvested and amplified according to the manufacturer's protocol. Sf9 cells were infected with the recombinant baculovirus at a multiplicity of infection of 0.25, and infected cell culture supernatant was harvested 7 days post-transfection. uPAR was captured by antibody affinity chromatography, eluted, then dialyzed overnight before purification by fast protein liquid chromatography on a Mono Q (GE Life Sciences) column using a linear gradient from 0 to 1 m NaCl for elution.
Phage Display Library Construction
A fully human naïve Fab phage display library was constructed using methods described by de Haard et al. (24). Briefly, peripheral blood lymphocyte cDNA was synthesized from RNA. The resulting library was cloned into a phagemid vector, which fuses a C-terminal hexahistidine and c-Myc tag to the heavy chain. Large-scale phage rescue was performed using M13K07 helper phage.
Phage Display Panning
Human soluble uPAR was immobilized overnight to a Nunc MaxisorpTM 96-well microplate (eBioScience) at 10 μg/ml in 50 mm sodium carbonate, pH 9.5, and unbound uPAR was removed by washing. uPAR-coated wells were then blocked with milk and washed, and a pre-blocked aliquot of the phage library was divided between the wells. Unbound phage were washed away, and bound phage were recovered by adding Escherichia coli TG1 cells. Infected TG1 cells were spread onto selection plates, grown overnight, and harvested by plate scraping. Phage were amplified with M13K07 helper phage infection in liquid culture. Fab-displaying phage were harvested from the culture supernatant and concentrated by polyethylene glycol precipitation. The second and third rounds of panning were conducted similarly to the 1st round, but the washing step was made increasingly stringent to remove weakly bound phage.
Expression of Fab into Culture Supernatants
Phage-infected E. coli TG1 colonies were grown in selection media, and Fab expression was induced by the addition of isopropyl β-d-1-thiogalactopyranoside (1 mm final) to cultures showing log phase growth. Cultures were shaken overnight to induce periplasmic Fab expression, a minor portion of which leaks into the culture supernatant. After overnight incubation, TG1 culture supernatants containing leaked Fabs were collected by centrifugation.
Preparation of Periplasmic Fraction
Cell pellets from phage-infected TG1 cultures grown at the 96-well plate scale and induced for Fab expression by addition of isopropyl β-d-1-thiogalactopyranoside, were resuspended in 50 μl of 100 mm Tris, pH 8.0, 25% glucose, and 100 μg/ml hen egg white lysozyme and shaken at room temperature for 30 min. 300 μl of ice-cold water was then added and mixed with vigorous pipeting. The periplasmic fraction was then clarified by centrifugation.
Fab Purification
Individual Fab clones were expressed in E. coli BL21 cells (as described for TG1 cells). Periplasmic fractions were purified by immobilized nickel chelate chromatography using Chelating-SepharoseTM (GE Healthcare) according to the manufacturer's protocol.
Purified protein was analyzed by SDS-PAGE, and the concentration was estimated with the BCATM protein assay kit (Pierce) using bovine serum albumin standards. Each Fab was analyzed for expression by Western blot using an Penta-His horseradish peroxidase (HRP) conjugate antibody (Qiagen) according to the manufacturer's protocol.
uPAR ELISA
uPAR binding Fabs were detected on a Nunc MaxisorpTM 96-well plate coated with 50 μl of 1 μg/ml uPAR. Fabs (either culture supernatant, periplasmic fraction, or purified protein at 22.5 μg/ml) were applied to the plate wells, which were then washed. Bound Fabs were detected using 100 μg/ml HRP-conjugated anti-Myc antibody clone 9E10 (Roche Applied Science). Three wells not coated with uPAR were included to control for nonspecific Fab binding. For ELISA assays using culture supernatants, bound 9E10-HRP was detected using 1-StepTM Turbo-TMB ELISA (Pierce) for end point analysis at 450 nm according to the manufacturer's protocol. For all other experiments, bound 9E10-HRP was detected as the rate of increase of the absorbance at 650 nm in the presence of 3,3′,5,5′-tetramethylbenzidine substrate.
Sequence Analysis
The heavy and light chain expression cassettes of all 36 uPAR binding clones were sequenced. The complementarity-determining regions (CDRs) of the heavy and light chain sequences were aligned using the ClustalW2 server (25).
Competitive ELISA
95 μl of each Fab was combined with 6 nm high molecular weight uPA (HMW-uPA) (American Diagnostica). The resulting mixture was incubated with the uPAR-coated microplate wells described in the previous section. Wells not coated with uPAR were included to control for any nonspecific binding of HMW-uPA. Wells coated with uPAR and incubated against all Fabs without HMW-uPA were included to control for nonspecific protease activity. Maximal uPA binding was determined by incubating HMW-uPA with uPAR-coated wells without any Fab. Unbound Fabs and HMW-uPA were removed by washing. The amount of bound HMW-uPA was measured by assaying proteolytic activity in the treated wells using the chromogenic uPA substrate Spectrazyme® UK (American Diagnostica) and monitoring the rate of increase of the absorbance at 405 nm. The wells were further assayed to detect the presence of bound Fab using 9E10-HRP as described in the previous section.
uPA Activity in the Presence of Fabs
Fabs were tested for direct inhibition of uPA in two ways. First, 1 μg/ml HMW-uPA was incubated in uPAR-coated plates; unbound HMW-uPA was removed by washing, and Fabs were added to the wells at 25 μg/ml. The activity of HMW-uPA in the presence and absence of Fab was measured as described above. Second, 10 nm HMW-uPA and low molecular weight uPA (American Diagnostica) were incubated in a microtiter plate in the presence and absence of 450 nm Fab. The activity of high and low molecular weight uPA was measured in triplicate by assaying proteolytic activity as described above.
Human IgG1 Antibody Expression and Purification
Heavy and light chain Fab sequences were amplified by PCR and separately cloned into vector pTT5-SP-H1, a modification of the pTT5 vector (National Research Council of Canada). Heavy and light chain expression vectors were transformed into NEB Turbo Competent E. coli (New England Biolabs), and large-scale plasmid preparations were performed using the Pure Yield Plasmid Midiprep system (Promega). The sequences of all full-length antibody expression clones were confirmed.
HEK-293-EBNA1 cells, a generous gift from Yves Durocher of the Canadian National Research Council, were adapted to Invitrogen FreeStyleTM 293 Expression Medium (Invitrogen) supplemented with 50 μg/ml G418. Heavy and light chain encoding pTT5 plasmids were co-transfected into the cells with jetPEITM (Polyplus) according to the manufacturer's protocol. Cells were incubated for 4–5 days post-transfection, after which the IgG-containing spent media was harvested. IgGs were purified on a Protein A-agarose (Pierce) affinity column, eluted with 100 mm citrate, pH 3.0, neutralized, dialyzed overnight against phosphate-buffered saline, pH 7.4, and stored at 4 °C. IgG expression levels were determined using the Easy-Titer Human IgG Assay kit (Pierce) and spectrophotometric readings at 280 nm.
Surface Plasmon Resonance
The interaction affinities between uPAR and 1A8, 2B1, 2G10, and 2E9 were determined by equilibrium surface plasmon resonance using a Biacore 1000. To abrogate the effect of avidity, antibodies were immobilized on the surface of a Biacore CM5 chip, and soluble uPAR was flowed as the analyte. Four Biacore CM5 chip flow cells were sequentially treated according to the manufacturer's protocol with 1-ethyl-3-[3-dimethylaminopropyl]carbodiimide hydrochloride (EDC) and N-hydroxysuccinimide (NHS). 1A8, 2B1, 2E9, and 2G10 IgGs were each diluted to 5 μg/ml in 10 mm sodium acetate, pH 5.0, and then immobilized to separate flow cells to obtain ∼2700 relative response units. The flow cells were blocked with 1 m ethanolamine, pH 8.5, after antibody immobilization. A flow cell on each CM5 chip was immediately treated with 1 m ethanolamine, pH 8.5, after EDC/NHS activation to provide a reference surface.
Soluble human uPAR was injected over flow cells at the following concentrations: 450, 225, 112.5, 56.25, 28.13, 14.1, 7, 3.5, 1.8, and 0 nm. Bound uPAR was removed with 10 mm glycine, pH 1.5. Instrument response values were recorded and imported into Scrubber2 (BioLogic Software) for analysis. Data were normalized using the double referencing method (26) and analyzed using a one-site binding model as implemented in Scrubber2. Response values reached a stable plateau as judged by a change of less than 0.05% over the last minute of injection.
Flow Cytometry
A confluent flask of either HEK-293 cells or HEK-293 uPAR cells was treated with TrypLE Express (Invitrogen). Harvested cells were re-suspended in Stain Buffer (BD Pharmingen), and either 5 × 10⁵ or 1 × 10⁶ cells were transferred to tubes for antibody staining. 1A8, 2B1, 2E9, 2G10, and whole human IgG (Sigma) were added to a final concentration of 5 μg/ml. 2G10 and 3C6 Fab were added to a final concentration of 50 μg/ml. All samples were incubated on a rotator at 4 °C for 30 min after the addition of antibody, harvested by centrifugation, and resuspended in 500 μl of Stain Buffer. The IgG samples were resuspended and incubated with 20 μl of fluorescein isothiocyanate-conjugated mouse anti-human monoclonal antibody (BD Pharmingen), whereas the Fab samples were incubated with Alexa Fluor® 488-conjugated mouse anti-cMyc monoclonal antibody (AbD Serotec). 5 × 10⁵ cells were analyzed with a BD Biosciences FACSCalibur cytometer. Data analysis was performed with FlowJo Version 7.2.4.
Adhesion Assay
The cell adhesion assay was performed as described previously (14). Briefly, H1299 cells (2 × 10⁵) were seeded onto fibronectin (FN)-coated (10 μg/ml) or vitronectin (VN)-coated (5 μg/ml) plates with or without the anti-uPAR Fabs (10 μg/ml), RGD peptide, or RAD peptide (0.4 mm). Attached cells were fixed with methanol, and Giemsa stain was used for colorimetric analysis by measuring the optical density at 550 nm. FN and VN were purchased from Sigma. RGD and RAD peptides were purchased from Anaspec (San Jose, CA).
ERK Phosphorylation Assays
Serum-starved H1299 cells were washed with 50 mm glycine-HCl, 100 mm NaCl, pH 3.0, for 3 min to remove surface-bound endogenous uPA and neutralized with 0.5 m HEPES, 0.1 m NaCl, pH 7.5, for 10 min on ice. Cells were pretreated with 10 μg/ml 1A8, 2B1, 2E9, 2G10, or control human IgG for 1 h at 37 °C. Pro-uPA was added to 10 nm and incubated at 37 °C for 5 min to initiate ERK activation. After incubation, cells were lysed in radioimmune precipitation assay buffer (Pierce) supplemented with protease and phosphatase inhibitors (Sigma) and blotted for phospho- and total ERK (Cell Signaling). In the case of FN-stimulated ERK phosphorylation, cells were cultured on a FN- (10 μg/ml)-coated surface for 30 min before lysis.
Invasion Assays
H1299 human lung cancer cells (1 × 10⁵) were pretreated with 1A8, 2B1, 2E9, 2G10, or control human IgG (each 10 μg/ml) and 2G10, 3C6, 2G10 + 3C6 Fab (5–10 μg/ml) for 1 h at 37 °C. Cells were then seeded into BD BiocoatTM Invasion Chambers (BD Biosciences) with Matrigel, Collagen I, or Matrigel/Collagen I mix-coated tops and FN pre-coated bottoms and then cultured overnight in serum-free Dulbecco's modified Eagle's medium containing 5 mg/ml bovine serum albumin; fetal bovine serum was added to the lower chamber to 5%. 24 h later, the matrices and cells on the membrane top chamber side were removed, and cells on the membrane bottom chamber side were fixed with methanol, stained with Giemsa, extracted in 10% acetic acid, and measured in a plate reader at 595 nm. All assays were performed in triplicate, and the data are expressed as percent inhibition by the antibodies.
Acid-extracted rat-tail collagen I was purchased from Sigma (Catalog #C7661) and was reconstituted according to the manufacturer's protocol.
Anti-uPAR Co-immunoprecipitation
H1299 cells (1 × 10⁷) were lysed in Triton lysis buffer (50 mm HEPES, pH 7.5, 150 mm NaCl, and 1% Triton X-100) supplemented with protease inhibitors (Sigma) and 1 mm phenylmethylsulfonyl fluoride. Clarified lysates were first incubated with anti-uPAR Fabs (10 μg/ml) at 4 °C for 1 h, then with Penta-His Antibody (Qiagen) for 1 h, and finally with 50 μl of mixed Protein A and Protein G-agarose beads overnight. The immunoprecipitates were subjected to SDS-PAGE and Western blot analysis for uPAR and either α5 or β1 integrins. The anti-uPAR monoclonal antibody (R2) was a kind gift from Michael Ploug (Finsen Laboratory, Copenhagen, Denmark). The anti-integrin polyclonal antibodies were purchased from Chemicon (Temecula, CA).
uPAR and MMP Invasion Assay
H1299 human lung cancer cells (3 × 10⁵) were pretreated with 2G10 or 3C6 Fab (5 μg/ml) and either GM6001 (0.1 μm, Chemicon) or anti-MT1-MMP catalytic domain (5 μg/ml, Clone 3G4.2, Millipore) for 1 h at 37 °C. Cells were then seeded into BD BiocoatTM Invasion Chambers (BD Biosciences) with Matrigel/Collagen I mix-coated tops and FN precoated bottoms and then cultured overnight in serum-free Dulbecco's modified Eagle's medium containing 5 mg/ml bovine serum albumin; media containing 5% fetal bovine serum was added to the lower chamber. Length of invasion, fixation, staining, and analysis was done exactly as in the previously documented invasion assays.
RESULTS
Phage Display Identifies uPAR Binding Fabs
Before panning, the binding of active uPAR to a microplate surface was confirmed by detecting the binding of HMW-uPA to the uPAR-coated surface. Binding of HMW-uPA was detected by assaying for the presence of specific proteolytic activity within a microplate well with the uPA substrate spectrazyme UK (data not shown) after incubating the uPAR-coated plate with HMW-uPA and stringently washing.
Fabs capable of binding human uPAR were obtained after three rounds of panning in which washes to remove weakly bound Fab-displaying phage were made increasingly stringent. 384 independent clones were evaluated from the final round of panning. To confirm that these Fabs could be expressed in bacteria, culture supernatants (into which a small fraction of Fabs accumulated after isopropyl β-d-1-thiogalactopyranoside addition) were tested for the presence of Fabs capable of binding to uPAR. From these 384 clones, 96 were selected for further analysis on the basis of reproducible uPAR binding. Periplasmic protein fractions were then prepared from the 96 clones. With these fractions ELISA analyses gave stronger, more consistent signals compared with that of culture supernatants, presumably due to the higher concentration of Fab in the periplasm as compared with culture supernatant. Of the 96 clones, 36 candidates were confirmed as strong binders of uPAR, with an average signal greater than 8-fold over background (data not shown).
Sequence Analysis and Small-scale Expression Identifies Unique Fabs
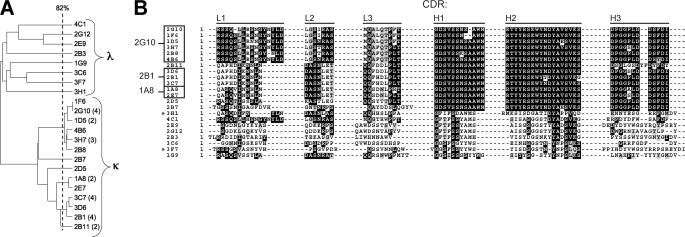
The 36 candidates were sequenced and evaluated for expression at the 100-ml culture scale. Sequencing of the heavy and light chain expression cassettes revealed that 22 of the 36 candidates have unique Fab sequences. ClustalW alignment of these sequences yielded a percent identity dendrogram with two distinct groups of antibodies defined by having a κ or λ light chain (Fig. 1A). Several subgroups of highly related sequences are evident within the κ light chain group, whereas eight antibodies with a relatively low degree of sequence similarity are evident within the λ light chain group. Alignment of the six CDRs of each unique Fab (Fig. 1B) shows that the CDR sequences determine the subgrouping pattern observed in the dendrogram of Fig. 1A. The lowest pairwise sequence identity between antibody CDRs is 22%.
FIGURE 1.
Sequence homology for uPAR-binding Fabs identified by phage display. A, the heavy and light chain protein sequences of the 22 unique clones were aligned to generate a percent identity tree diagram. The number of identical clones is indicated in parentheses for redundant Fab sequences. The Fab subgroups, defined by their light chain identity (κ or λ), are labeled. The vertical line indicates the 82% sequence identity threshold. Sequences that branch to the right of the 82% cut-off are considered equivalent. B, the sequences of the CDR loops of each unique Fab were aligned and shaded to indicate sequence identity. The name of each CDR loop is indicated above the alignment. Fab heavy and light chain protein sequences with greater than 82% sequence identity were grouped together (box). A representative clone was selected from each group based on expression levels in E. coli Rosetta-gamiTM B cells and is indicated to the left of the box. Asterisks indicate Fab clones that did not express in Rosetta cells.
The expression levels of the 22 unique Fabs in E. coli were determined after isopropyl β-d-1-thiogalactopyranoside induction of 100-ml cultures. Histidine-tagged Fabs from the periplasmic fraction were obtained by osmotic shock, purified on a nickel-chelating Sepharose column, and analyzed for expression by Western blot. Two Fab clones showed no expression and were not pursued further (Fig. 1B). Small-scale expression of the remaining Fabs, with the exception of 2E9, yielded 250 μg/liter E. coli culture. Fab 2E9 expression yields were 5-fold lower.
Purified Fabs were further characterized by uPAR ELISA. Initial measurements of bound antibody exhibited a large variance between different Fabs, but control experiments measuring uPA binding to immobilized uPAR did not show similar variance, suggesting that these differences reflect inherent disparities in binding mode or affinity between different Fabs (data not shown).
The list of Fabs to further pursue was narrowed by clustering individual clones based on their sequences and bacterial expression abilities. Sequences with a similarity greater than or equal to 82% were clustered together (Fig. 1). From these groupings, a representative clone demonstrating robust small-scale expression was chosen, thus narrowing the list of Fabs to 12 clones for further analysis.
Competitive ELISA Identifies 2E9 and 2G10 as the Most Competitive with uPA for uPAR Binding
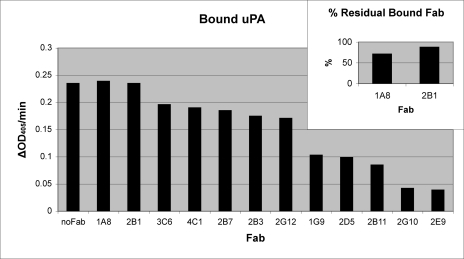
Purified Fabs from the 12 remaining clones were analyzed for their ability to compete with uPA for binding to immobilized uPAR. The presence of uPA was measured by the amount of bound proteolytic activity in the presence and absence of each Fab (Fig. 2). This assay identified 2E9 and 2G10 as competitors of the uPA/uPAR interaction. Controls showed that these antibodies did not directly inhibit uPA proteolytic activity (data not shown).
FIGURE 2.
Binding of uPA to uPAR in the presence of Fab. uPA was added to a uPAR-coated plate in the absence and presence of each Fab. The presence of uPA was determined by the amount of bound proteolytic activity and is reported as the initial velocities from the progress curves. Maximal uPA binding was determined by incubating uPA without Fab and is labeled no Fab. Data is plotted left to right from Fabs that do not compete with uPA for uPAR binding to Fabs that show maximal competition. Inset, for 1A8 and 2B1, the amount of Fab bound to uPAR in the presence and absence of uPA was determined by ELISA. The ratio of bound Fab in the presence of uPA to bound Fab in the absence of uPA is reported as a percentage.
The competitive ELISA data also suggested that 1A8 and 2B1 do not compete with uPA for uPAR binding. To verify that these Fabs were not weak uPA competitors, the ratio of bound Fab in the presence of uPA to bound Fab in the absence of uPA was calculated (Fig. 2, inset). The amount of Fab bound in the presence and absence of uPA was determined in the same uPAR-coated well; therefore, some loss of Fab is expected due to processing between measurements. This assay verified that 1A8 and 2B1 bound a non-uPA binding site on uPAR. The two strongest non-competitive binders, 1A8 and 2B1, and the two strongest competitive inhibitors, 2G10 and 2E9, were chosen for further analysis.
Full-length IgG Expression in Mammalian Cells Produces Reagent Quantities of Antibody
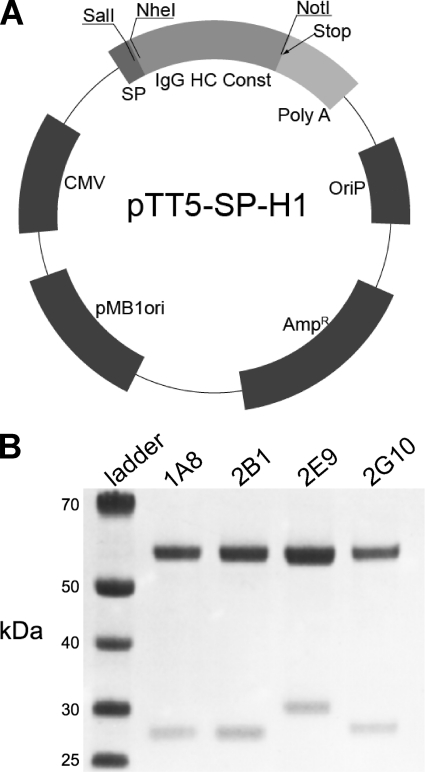
The heavy and light chain sequences of 1A8, 2B1, 2G10, and 2E9 were cloned into the mammalian expression vector pTT5-SPH1 for high level expression by transient transfection in HEK-293-EBNA1 cells (Fig. 3). Co-transfection of varying ratios of heavy and light chain expression plasmids revealed that an equal mass of heavy and light chain DNA, which corresponds to a slight molar excess of light chain plasmid particles, produced the highest level of antibody. A total DNA:polyethyleneimine ratio of 1 μg:4 μl and sub-confluent maintenance of HEK-293-EBNA1 cells resulted in a greater than 90% transfection efficiency. Optimal time to harvest post-transfection was 4–5 days. Antibody expression yield was sequence-dependent and varied between 20 and to 100 mg/liter of culture supernatant at the 1-ml scale and between 10 and 50 mg/liter in large scale trials (500 ml).
FIGURE 3.
IgG expression by transient transfection. A, Fab sequences were grafted onto an IgG1 scaffold by independently subcloning the heavy (HC) and light chain sequences into pTT5-SP-H1. The plasmid map of this transient expression vector is shown. For a given antibody, both the pTT5-SP-H1 heavy chain vector and pTT5-SP-H1 light chain vector were co-transfected into HEK-293-EBNA1 cells for expression. CMV, cytomegalovirus. IgG HC Const, IgG Heavy Chain Constant Fc Region. B, SDS-PAGE analysis of purified antibodies is shown. The λ light chain of 2E9 runs at a higher apparent molecular weight than the κ light chain of the other antibodies.
Surface Plasmon Resonance Reveals Low nm Affinities for uPAR
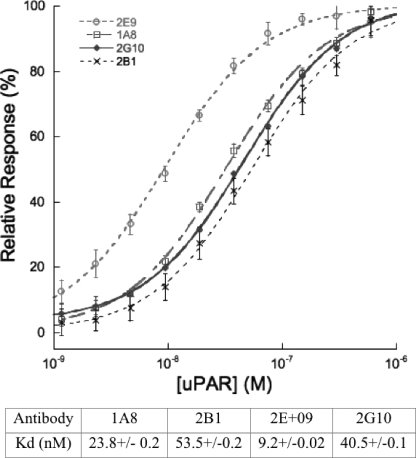
The monovalent interaction affinity between uPAR and the antibodies 1A8, 2B1, 2G10, and 2E9 were determined by equilibrium surface plasmon resonance methods using a Biacore 1000. Analysis of instrument response versus analyte (uPAR) concentration yielded monovalent dissociation constants in the nanomolar range (Fig. 4).
FIGURE 4.
Equilibrium affinity determination of uPAR antibody interaction. Percent of maximal surface plasmon resonance response during analyte (uPAR) injection versus analyte concentration is shown. Curve fitting for 2E9 (open circles), 1A8 (open squares), 2G10 (closed diamonds), and 2B1 (×) yielded KD values that are summarized in the table.
Flow Cytometry Shows Specific Labeling of uPAR-expressing Cells
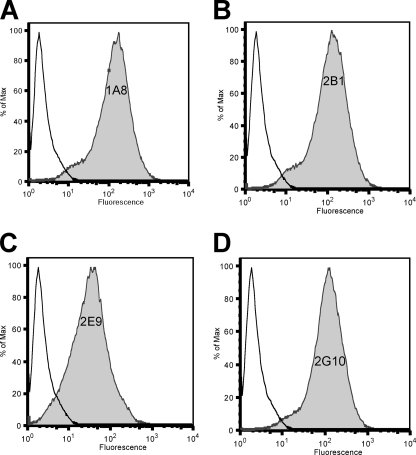
The ability of the identified antibodies to bind uPAR, as it is presented on the cell surface, was analyzed by flow cytometry. HEK-293 cells stably expressing membrane-bound human uPAR were labeled with full-length anti-uPAR IgGs or an isotype control. Anti-uPAR IgGs were detected with an anti-human Fc fluorescein isothiocyanate-conjugated secondary antibody. Labeled cells were analyzed on a flow cytometer (Fig. 5). All the antibodies tested indicated robust labeling of uPAR-expressing HEK-293 cells but did not show labeling of the parental HEK-293 cells lacking uPAR expression indicating highly specific binding (data not shown).
FIGURE 5.
Detection of cell surface uPAR with human anti-uPAR antibodies. A—D, white profiles represent staining with control whole human IgG; shaded profiles represent staining with human anti-uPAR antibody. The identity of the human anti-uPAR antibody is indicated within the shaded profile (A = 1A8; B = 2B1; C = 2E9; D = 2G10). To quantify the relative staining intensities of the human anti-uPAR antibodies, the same gate (horizontal line) was applied to each sample. The % of cells staining positive for uPAR expression is indicated above the gate.
2E9 and 2G10 Decrease H1299 Invasion
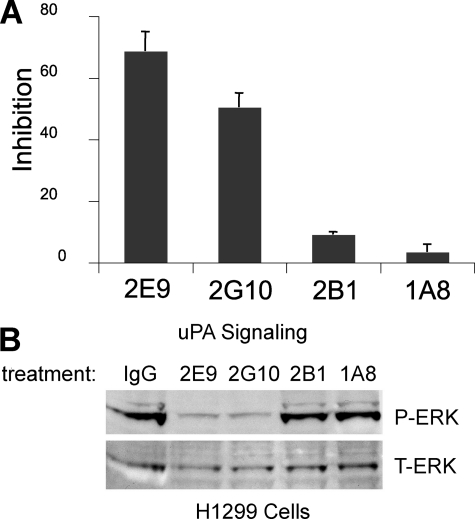
H1299 cells have also been shown ex vivo to migrate through or invade extracellular matrix components such as Matrigel in a manner that is dependent on uPA binding to uPAR (19). A strong ex vivo Matrigel invasion phenotype is thought to correlate with the metastatic potential of a cancer cell in vivo. Analysis of the effects of antibodies 1A8, 2B1, 2G10, and 2E9 on Matrigel invasion by H1299 cells, which produce uPA in an autocrine fashion, shows that 2G10 and 2E9 are both capable of inhibiting migration, whereas 1A8 and 2B1 are not (Fig. 6A).
FIGURE 6.
Inhibition of uPA/uPAR mediated invasion and signaling in H1299 cells. A, H1299 cells were pretreated with antibodies (10 μg/ml), 2E9, 2G10, 2B1, and 1A8, before they were allowed to invade Matrigel for 24 h. The cells that migrated through and attached to the bottom of the filter were fixed, stained with Giemsa, and extracted with 10% acetic acid. Cell invasiveness is evaluated by measuring A595 nm. The results are expressed as percent inhibition of that observed with no treatment control. B, H1299 cells expressing endogenous uPAR were serum-starved, acid-washed, pre-treated with antibodies (10 μg/ml), and then incubated with pro-uPA (10 nm). The lysates were immunoblotted with anti-pERK (top panel) and anti-total ERK (bottom panel).
2E9 and 2G10 Decrease uPA-dependent ERK Phosphorylation in H1299 Cells
The human lung cancer cell line H1299 exhibits pro-proliferative ERK phosphorylation and activation that is dependent on signaling events mediated by binding of uPA to uPAR (19). This cell line was used to test the ability of the anti-uPAR antibodies to inhibit uPAR-dependent pro-proliferative signals triggered by uPA binding. The results demonstrate that antibodies 1A8 and 2B1 do not inhibit ERK phosphorylation under the conditions tested. However, 2E9 and 2G10, which compete with uPA binding to uPAR, are able to inhibit ERK phosphorylation (Fig. 6B).
3C6 Decreases FN-dependent ERK phosphorylation in H1299 Cells and Abrogates Their FN- and VN-dependent Adhesion
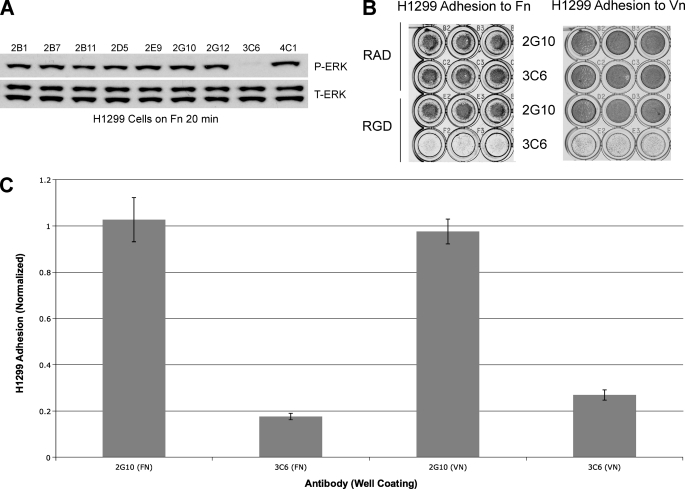
The activation of FN-dependent ERK phosphorylation in H1299 cells is dependent on the formation of the uPAR/α5β1/FN complex (19). To determine whether any of the unique anti-uPAR Fabs interfere with the uPAR/α5β1 interaction, we tested their ability to decrease ERK phosphorylation in H1299 cells seeded in FN-coated wells. We identified 3C6 as able to significantly decrease FN-dependent ERK phosphorylation (Fig. 7A).
FIGURE 7.
Determination of 3C6 as a putative uPAR/β1 integrin antagonist. A, H1299 cells were serum-starved, acid-washed, pre-treated with Fabs (10 μg/ml), 2B1, 2B7, 2B11, 2D5, 2E9, 2G10, 2G12, 3C6, and 4C1, and cultured on a FN-coated surface (10 μg/ml) for 30 min before lysis. The lysates were immunoblotted with anti-pERK (top) and anti-total ERK (T-ERK, bottom). B, H1299 cells were seeded on FN-coated (10 μg/ml) or VN-coated (5 μg/ml) 96-well plates with or without anti-uPAR antibody and RGD or RAD peptide. Shown here is a direct comparison between 2G10 (uPAR/uPA antagonist) and 3C6, now identifiable as an uPAR/β1 integrin antagonist. C, shown is a normalized graph comparing the adhesion for each antibody treatment on the two different ECM coatings, obtained by dividing the average reading from RGD-treated wells by that from RAD-treated wells. Note that 3C6 treatment disrupts uPAR-mediated integrin adhesion at least 4-fold more than 2G10 treatment.
To further characterize the functional effects of 3C6, an FN adhesion assay was utilized. The α5β1/FN interaction can occur in a uPAR-independent context that is sensitive to antagonism by the RGD peptide and in a uPAR-dependent context that is resistant to the RGD peptide (14). In the presence of both the RGD peptide and 3C6, H1299 adhesion to FN-coated wells was abrogated (Fig. 7B). The selectivity of this effect was verified by inclusion of RAD peptide and the Fab form of the uPA competitor, 2G10, as negative controls.
To determine whether the 3C6 ability to disrupt uPAR/β1-mediated adhesion is generalizable, we characterized the ability of uPAR/α3β1-mediated H1299 cell adhesion to VN. In an assay similar to the FN adhesion assay, it was found that 3C6 could also prevent the adhesion of H1299 cells to VN in the presence of RGD peptide (Fig. 7B), suggesting that 3C6 is able to specifically block the functions of uPAR complexes with multiple β1 integrins.
3C6 Fab Binds to uPAR Overexpressing HEK Cells
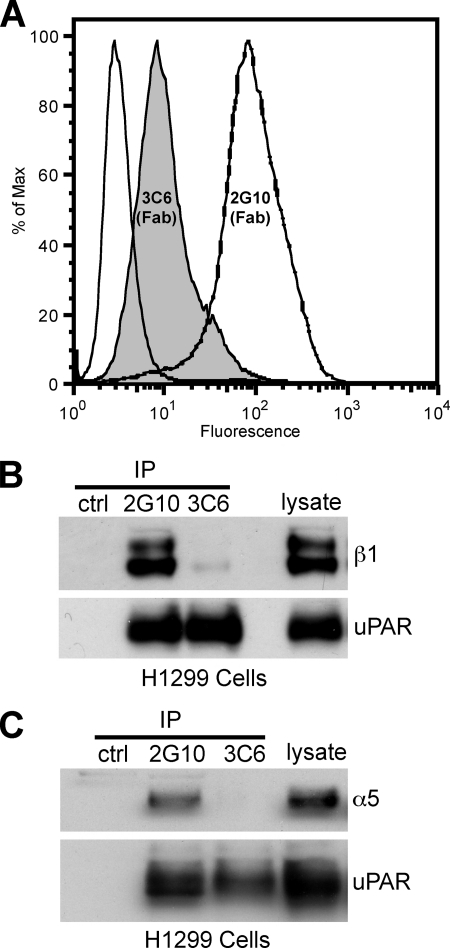
To confirm that 3C6 recognizes uPAR as displayed on a cell surface, we utilized the same flow cytometry assay used to characterize the anti-uPAR IgGs. Because the investigation of 3C6-dependent cellular effects was done with the Fab form of the antibody, we continued to use this format for flow cytometry. We also included the 2G10 Fab as a benchmark for an antagonistic antibody ability to bind cellular uPAR-expressing HEK-293 cells. The data indicate that the 3C6 Fab can bind to cells that overexpress uPAR, albeit not as robustly as the 2G10 Fab (Fig. 8A).
FIGURE 8.
3C6 binds to cell surface uPAR and abrogates uPAR association with α5β1 integrin. A, HEK-293 cells overexpressing uPAR were stained with 3C6 and 2G10 to confirm the 3C6 ability to bind cell surface uPAR. The dashed white profile represents staining with 2G10 Fab; the shaded profile represents staining with 3C6 Fab; the solid white profile represents no Fab staining but inclusion of the AlexaFluor 488-conjugated secondary. B and C, H1299 lysates were incubated with anti-uPAR Fab (2G10 or 3C6), Penta-His antibody, and Protein A/G-agarose. The presence of β1 integrin (B) or α5 integrin (C) and uPAR was probed with the respective antibodies in Western analysis. Ctl, control; IP, immunoprecipitate.
3C6 Prevents the Association of uPAR and β1 Integrins in H1299 Cells
α3β1 and α5β1 are the major β1 integrins that associate with uPAR in H1299 cells (14). To determine whether 3C6 directly blocks uPAR association with β1 integrins, 3C6 and 2G10 Fabs were used to immunoprecipitate uPAR and uPAR ligands from H1299 lysates. The resulting immunoprecipitates were analyzed by Western blot for uPAR, α5, and β1 integrin subunits. 2G10 appears to be able to bind uPAR at the same time as β1 integrin (Fig. 8B). The absence of β1 in the 3C6 immunoprecipitation suggests that 3C6 prevents uPAR/β1 association. Because α5β1 integrin association with uPAR is known to effect changes in ERK phosphorylation and MMP expression (14), we also probed for the presence of the α5 subunit. The results indicate that 2G10 is able to bind uPAR simultaneously with α5β1 integrin, whereas 3C6 prevents uPAR association with α5β1 integrin (Fig. 8C).
2G10 and 3C6 Show a Combined Effect on Inhibition of H1299 Invasion through Cross-linked Matrices
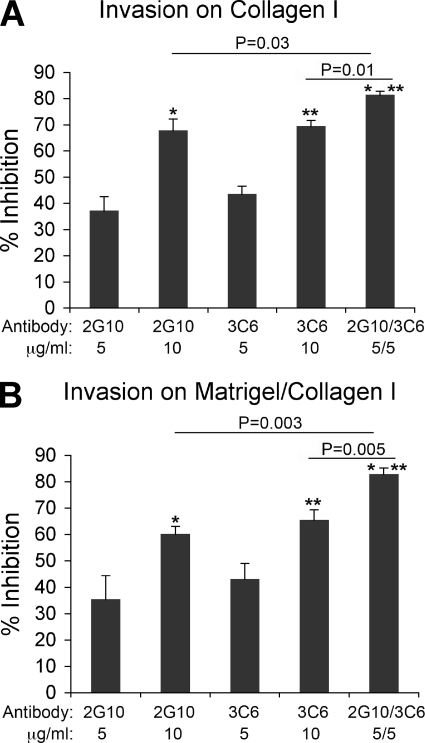
Migration is a complex phenomenon that requires modulation of adhesion and degradation of ECM (27). As shown in Fig. 6A, antagonism of the uPAR/uPA complex by 2E9 and 2G10 inhibits the invasion of H1299 cells. To determine whether3C6 has a similar effect on invasion by antagonizing the uPAR/β1 complexes, we explored whether the 3C6 Fab could have an additional effect on invasion inhibition when used simultaneously with the uPA comptetitor Fab, 2G10, to block cell invasion through Matrigel/Collagen I or Collagen I. As shown in Fig. 9A, not only do 2G10 and 3C6 Fabs inhibit invasion through Collagen I, but a combined dosage exhibits a combined response.
FIGURE 9.
Combined 2G10 and 3C6 treatment of H1299 cells significantly decreases invasive potential through Matrigel/Collagen I and Collagen I. H1299 cells were pretreated with antibodies (2G10, 3C6, and 2G10/3C6 at 5–10 μg/ml) before seeding on the Collagen I-coated (A) or Matrigel/Collagen I-coated (B) top membrane of a 24-well Transwell plate (105 cells/well in triplicate). Cells were incubated for 24 h. The cells that migrated through and attached to the bottom of the filter were fixed, stained with Giemsa, and extracted with 10% acetic acid. Cell invasiveness is evaluated by measuring A595 nm. The results are expressed as a percentage of inhibition observed in the no-treatment control. Note, the inhibition potential of combined 2G10 (5 μg/ml) and 3C6 (5 μg/ml) is significantly stronger than either antibody alone (10 μg/ml), suggesting an additive effect.
Additionally, the invasion assay was repeated on a substrate composed of both Matrigel and Collagen I to provide a matrix that contains more physiologically relevant physical cues for migration and ECM degradation. The results are consistent with the increased response observed on the collagen I-coated inserts (Fig. 9B).
2G10 and 3C6 Do Not Confer Additional Invasion Inhibition above MMP Inhibitors
Supplemental Fig. S1 shows the invasion inhibition observed for the different treatments of H1299 cells. The concentrations were chosen below the saturation point of the anti-uPAR antibodies (as can be gauged by the invasion data from Fig. 9) so as to provide a preliminary indication as to whether additional invasion inhibition was conferred by using two different inhibitors. Additional treatment of MMP-inhibited H1299 cells (which were treated with either broad spectrum MMP inhibitor GM6001 or the antibody that was specific for the MT1-MMP catalytic domain) with anti-uPAR antagonist antibodies 2G10 or 3C6 did not confer invasion inhibition that was significantly greater than treatment with MMP inhibitors alone.
DISCUSSION
uPAR-mediated signaling has been implicated in tumor cell invasion, survival, and metastasis (28). Many of these signaling events are dependent on binding extracellular ligands such as uPA and integrins. Therefore, the identification of reagents with favorable pharmacokinetic characteristics capable of binding to and interfering with uPAR-mediated signaling is an area of great interest.
Here we report Fabs from a highly diverse and naïve human Fab phage display library that are capable of binding uPAR. Antibodies that inhibit the binding of the known uPAR ligands uPA and β1 integrins were produced. These antibodies are able to robustly label membrane-bound uPAR-expressing cells and inhibit uPAR-mediated signal transduction and cellular migration.
The identified anti-uPAR antibodies can be broadly categorized into two different groups by heavy chain sequence similarity. Fourteen of the antibodies show significant heavy chain CDR sequence similarity (2G10 through 2B7 in Fig. 1B), whereas the remaining eight do not. 2G10, 2B1, and 1A8 have similar heavy chain CDRs, but 2G10 competes with uPA for uPAR binding, whereas 2B1 and 1A8 do not. Interestingly, the light chain CDRs of 1A8 and 2B1 are highly similar to one another and different from that of 2G10, indicating that the light chain may play a role in 2G10 ability to compete with uPA for uPAR binding. 2E9, which also competes with uPA, has heavy and light chain CDRs that are highly dissimilar to 1A8, 2B1, or 2G10. This suggests that there is more than one method of interfering with uPAR/uPA binding. To corroborate this supposition, the flow cytometry data (Fig. 5) imply that even though 2E9 and 2G10 both compete with uPA for uPAR binding, they recognize cellular uPAR differently.
3C6 has unique light and heavy chain CDRs when compared with 1A8, 2B1, 2G10, and 2E9, consistent with its role as the sole anti-uPAR antibody that antagonizes the uPAR/β1 interactions. The diversity of the anti-uPAR antibody sequences suggests that they may possess multiple uPAR binding modes and may antagonize other uPAR/ligand interactions.
There are several instances where the binding affinity of the antibody for uPAR does not predict functional efficacy in cell-based assays. The monovalent binding affinity of the 2G10 and 2E9 IgG antibodies are weaker than the affinity between uPAR and uPA (0.31 nm) (29), yet these IgGs inhibit uPAR-mediated invasion. One explanation for this phenomenon is that the avidity conferred by the bivalent IgG forms of 2E9 and 2G10 increases their apparent affinity for uPAR, thus allowing competition; however, the functional effect of the 2G10 IgG and Fab are comparable (Figs. 6A and 9), suggesting that IgG avidity alone cannot explain the functional efficacy of these antibodies. Additionally, although 3C6 appears to bind uPAR overexpressing cells less efficiently than 2G10 (Fig. 8A), it is still able to affect pERK levels, adhesion, and invasive potential in H1299 cells. The same can be said for 2E9, which exhibits uPA competition. Although surface plasmon resonance measurements show 2E9 to have the highest monovalent affinity for uPAR, flow cytometry data indicate that it binds to uPAR overexpressing HEK-293 cells less efficiently than 2G10; however, 2E9 inhibited H1299 invasion more so than 2G10 (Fig. 6A). Thus, in this investigation surface plasmon resonance and flow cytometry provide a means to determine uPAR recognition in vitro and ex vivo but do not predict functional efficacy in cell-based assays.
Characterization of these antibodies has shown their antagonism to be highly selective. 2G10 and 2E9 inhibit uPA binding to uPAR, whereas 3C6 inhibits β1 integrin binding to uPAR. These antibodies are also capable of inhibiting processes mediated by uPA/uPAR or uPAR/β1 complexes in the lung cancer cell line H1299, such as Matrigel/Collagen I or Collagen I invasion, and ERK phosphorylation. In contrast, 1A8 and 2B1 do not show any inhibition of uPA binding, invasion, or ERK phosphorylation, and 2G10 does not abrogate either FN- or VN-mediated adhesion of H1299 cells (Fig. 7, B and C). These results suggest the high degree of functional selectivity of these antibodies. Flow cytometry experiments show that these antibodies specifically bind to cells that express uPAR on their extracellular surface without detectably labeling control cells. Furthermore, they exhibit no binding to mouse uPAR (data not shown). The lack of reactivity toward mouse uPAR suggests that these antibodies would be ideal for studying inhibition of tumor growth and metastasis in mouse xenograft models that use human cell lines. In addition, because these antibodies are fully human, antibody-dependent cell-mediated cytoxicity would not contribute to any anti-proliferative or anti-metastatic effects observed in mouse models.
A promising observation is that combined 2G10 and 3C6 treatment of H1299 cells has a combined effect on inhibiting invasion through Matrigel/Collagen I and Collagen I matrices (Fig. 9). Doubling the concentration of 2G10 or 3C6 does not lead to a 2-fold increase in invasion inhibition. This could be ascribed to saturation of uPAR-mediated invasion pathways; however, a slightly greater invasion inhibition is achieved than from doubling either antibody concentration (Fig. 9). Although further experiments are required to pinpoint the specific molecular mechanisms contributing to this phenomenon as well as the type of relationship that combined treatment with 2G10 and 3C6 exhibits, it is evident that combined treatment with a uPAR/uPA antagonist antibody and a uPAR/β1 antagonist antibody exhibits a different cellular effect than treatment with only one antibody antagonist.
Previous investigations into the ability for cancer cells to migrate through matrices that more closely recapitulate the basement membrane matrix have shown that membrane type-1, type-2, and type-3 metalloproteinases (MT1-, MT2-, and MT3-MMPs) to be essential for invasion (30). In particular, MT1-MMP has been implicated as a downstream factor that determines proteolytic invasion through basement membranes directly and indirectly (31). Previous work indicated that disruption of the uPAR/β1 interaction leads to down-regulation of MMP1 and MMP9 transcription, which leads to lower protease activity (19). Therefore, we were inclined to accept that the uPAR interaction with uPA and β1 integrins ultimately lead to the activation of matrix-degrading MMPs. Additionally, the uPAR/uPA interaction has been suggested to be involved in the activation of ECM-degrading MMP2 (32). To resolve whether uPAR contributed to invasion beyond that of MMPs, MT1-MMP in particular, we conducted another invasion assay where we co-treated H1299 cells with either 2G10 or 3C6 and the broad-spectrum MMP inhibitor GM6001 or an antibody against the catalytic domain of MT1-MMP. We observed that neither 2G10 nor 3C6 contributed any additional invasion inhibition above that seen in GM6001- or anti-MT1-MMP-treated samples. This suggested that uPAR-mediated invasion is ultimately determined by MMP activity, particularly that of MT1-MMP (supplemental Fig. S1).
The expression of MT1-MMP, uPAR, and uPA has been previously demonstrated and implicated in the ECM remodeling of cells (33, 34). Additionally, uPAR and MT1-MMP expression has been correlated with an invasive phenotype, particularly in pancreatic cancer cells (35, 36). As indicated by our supplemental data, MMPs may play the ultimate role in dictating cancer cell invasiveness through cross-linked matrices (supplemental Fig. S1). Although this would suggest that targeting membrane-type MMPs for therapeutic purposes would be beneficial, MMP inhibitors have met with limited success as cancer therapeutics, likely due to inhibition of MMPs not involved in disease processes (37). Our data suggest an alternate modality for the inhibition of MMP activity that bypasses much of the problems encountered with the broad-spectrum MMP inhibitors. The implication for therapeutic development is 2-fold; 1) intracellular delivery of uPAR-targeted therapeutics is not required to have a significant effect, and 2) the targeting of two distinct sites on uPAR makes it less likely for resistance mutations to emerge in a population of cancer cells.
In summary, the functional selectivity and specificity of these antibodies suggests that they may be useful for imaging and/or therapeutic purposes in tumors associated with high levels of uPAR expression. In addition, these antibodies will allow for further mechanistic dissection of uPAR signaling by enabling experiments that concurrently and selectively antagonize multiple uPAR/ligand interactions. Future work will involve the pharmacological characterization of these antibodies ex vivo and in vivo as well as determining their potency against other types of cell lines and cancers.
Supplementary Material
Acknowledgments
We thank Dr. Cheng-I Wang for assistance with the library, Dr. Harold Chapman for grant support and helpful discussions, and Dr. Susan Miller for insight on competitive binding.
This work was supported, in whole or in part, by National Institutes of Health Grant 5T32GM008284-22 (to S. D.), CA128765 and GM073210 (to C. S. C.), and CA125564 and CA125564 (to Y. W. and Harold A. Chapman). This work was also supported by Leukemia and Lymphoma Society Fellowship 5552-06 (to D. R. H.).

The on-line version of this article (available at http://www.jbc.org) contains supplemental Fig. 1.
- uPAR
- urokinase plasminogen activator (uPA) receptor
- CDR
- complementarity-determining region
- ECM
- extracellular matrix
- EDC
- 1-ethyl-3-[3-dimethylaminopropyl]carbodiimide hydrochloride
- Fab
- fragment antigen binding
- HMW
- high molecular weight
- HRP
- horseradish peroxidase
- IgG
- immunoglobulin G
- NHS
- N-hydroxysuccinimide
- RGD
- arginine-glycine-aspartic acid
- RAD
- arginine-alanine-aspartic acid
- FN
- fibronectin
- ELISA
- enzyme-linked immunosorbent assay
- VN
- vitronectin
- ERK
- extracellular signal-regulated kinase
- MMP
- metalloproteinase.
REFERENCES
- 1.Sitrin R. G., Pan P. M., Harper H. A., Todd R. F., 3rd, Harsh D. M., Blackwood R. A. (2000) J. Immunol. 165, 3341–3349 [DOI] [PubMed] [Google Scholar]
- 2.Lakka S. S., Rajagopal R., Rajan M. K., Mohan P. M., Adachi Y., Dinh D. H., Olivero W. C., Gujrati M., Ali-Osman F., Roth J. A., Yung W. K., Kyritsis A. P., Rao J. S. (2001) Clin. Cancer Res. 7, 1087–1093 [PubMed] [Google Scholar]
- 3.Holst-Hansen C., Johannessen B., Høyer-Hansen G., Rømer J., Ellis V., Brünner N. (1996) Clin. Exp. Metastasis 14, 297–307 [DOI] [PubMed] [Google Scholar]
- 4.Solberg H., Ploug M., Høyer-Hansen G., Nielsen B. S., Lund L. R. (2001) J. Histochem. Cytochem. 49, 237–246 [DOI] [PubMed] [Google Scholar]
- 5.Schnaper H. W., Barnathan E. S., Mazar A., Maheshwari S., Ellis S., Cortez S. L., Baricos W. H., Kleinman H. K. (1995) J. Cell Physiol. 165, 107–118 [DOI] [PubMed] [Google Scholar]
- 6.Wei Y., Waltz D. A., Rao N., Drummond R. J., Rosenberg S., Chapman H. A. (1994) J. Biol. Chem. 269, 32380–32388 [PubMed] [Google Scholar]
- 7.Alfano D., Franco P., Vocca I., Gambi N., Pisa V., Mancini A., Caputi M., Carriero M. V., Iaccarino I., Stoppelli M. P. (2005) Thromb. Haemost. 93, 205–211 [DOI] [PubMed] [Google Scholar]
- 8.Danø K., Behrendt N., Høyer-Hansen G., Johnsen M., Lund L. R., Ploug M., Rømer J. (2005) Thromb. Haemost. 93, 676–681 [DOI] [PubMed] [Google Scholar]
- 9.Dass K., Ahmad A., Azmi A. S., Sarkar S. H., Sarkar F. H. (2008) Cancer Treat. Rev. 34, 122–136 [DOI] [PubMed] [Google Scholar]
- 10.Ragno P. (2006) Cell. Mol. Life Sci. 63, 1028–1037 [DOI] [PMC free article] [PubMed] [Google Scholar]
- 11.Gyetko M. R., Todd R. F., 3rd, Wilkinson C. C., Sitrin R. G. (1994) J. Clin. Invest. 93, 1380–1387 [DOI] [PMC free article] [PubMed] [Google Scholar]
- 12.Busso N., Masur S. K., Lazega D., Waxman S., Ossowski L. (1994) J. Cell Biol. 126, 259–270 [DOI] [PMC free article] [PubMed] [Google Scholar]
- 13.D'Alessio S., Blasi F. (2009) Front Biosci. 14, 4575–4587 [DOI] [PubMed] [Google Scholar]
- 14.Wei Y., Tang C. H., Kim Y., Robillard L., Zhang F., Kugler M. C., Chapman H. A. (2007) J. Biol. Chem. 282, 3929–3939 [DOI] [PubMed] [Google Scholar]
- 15.van der Pluijm G., Sijmons B., Vloedgraven H., van der Bent C., Drijfhout J. W., Verheijen J., Quax P., Karperien M., Papapoulos S., Löwik C. (2001) Am. J. Pathol. 159, 971–982 [DOI] [PMC free article] [PubMed] [Google Scholar]
- 16.Chaurasia P., Mezei M., Zhou M. M., Ossowski L. (2009) PLoS One 4, e4617. [DOI] [PMC free article] [PubMed] [Google Scholar]
- 17.Tarui T., Andronicos N., Czekay R. P., Mazar A. P., Bdeir K., Parry G. C., Kuo A., Loskutoff D. J., Cines D. B., Takada Y. (2003) J. Biol. Chem. 278, 29863–29872 [DOI] [PubMed] [Google Scholar]
- 18.Kanse S. M., Kost C., Wilhelm O. G., Andreasen P. A., Preissner K. T. (1996) Exp. Cell Res. 224, 344–353 [DOI] [PubMed] [Google Scholar]
- 19.Tang C. H., Hill M. L., Brumwell A. N., Chapman H. A., Wei Y. (2008) J. Cell Sci. 121, 3747–3756 [DOI] [PMC free article] [PubMed] [Google Scholar]
- 20.Carriero M. V., Del Vecchio S., Capozzoli M., Franco P., Fontana L., Zannetti A., Botti G., D'Aiuto G., Salvatore M., Stoppelli M. P. (1999) Cancer Res. 59, 5307–5314 [PubMed] [Google Scholar]
- 21.Tyndall J. D., Kelso M. J., Clingan P., Ranson M. (2008) Recent Pat. Antican. Drug Discov. 3, 1–13 [DOI] [PubMed] [Google Scholar]
- 22.Mazar A. P. (2008) Clin. Cancer Res. 14, 5649–5655 [DOI] [PubMed] [Google Scholar]
- 23.Filpula D. (2007) Biomol. Eng. 24, 201–215 [DOI] [PubMed] [Google Scholar]
- 24.de Haard H. J., van Neer N., Reurs A., Hufton S. E., Roovers R. C., Henderikx P., de Bruïne A. P., Arends J. W., Hoogenboom H. R. (1999) J. Biol. Chem. 274, 18218–18230 [DOI] [PubMed] [Google Scholar]
- 25.Larkin M. A., Blackshields G., Brown N. P., Chenna R., McGettigan P. A., McWilliam H., Valentin F., Wallace I. M., Wilm A., Lopez R., Thompson J. D., Gibson T. J., Higgins D. G. (2007) Bioinformatics 23, 2947–2948 [DOI] [PubMed] [Google Scholar]
- 26.Myszka D. G. (1999) J. Mol. Recognit. 12, 279–284 [DOI] [PubMed] [Google Scholar]
- 27.Streuli C. H. (2009) J. Cell Sci. 122, 171–177 [DOI] [PMC free article] [PubMed] [Google Scholar]
- 28.Dass C. R., Choong P. F. (2008) Cancer Biol. Ther. 7, 1262–1270 [DOI] [PubMed] [Google Scholar]
- 29.Ploug M., Østergaard S., Gårdsvoll H., Kovalski K., Holst-Hansen C., Holm A., Ossowski L., Danø K. (2001) Biochemistry 40, 12157–12168 [DOI] [PubMed] [Google Scholar]
- 30.Hotary K., Li X. Y., Allen E., Stevens S. L., Weiss S. J. (2006) Genes Dev. 20, 2673–2686 [DOI] [PMC free article] [PubMed] [Google Scholar]
- 31.Sabeh F., Shimizu-Hirota R., Weiss S. J. (2009) J. Cell Biol. 185, 11–19 [DOI] [PMC free article] [PubMed] [Google Scholar]
- 32.He Y., Liu X. D., Chen Z. Y., Zhu J., Xiong Y., Li K., Dong J. H., Li X. (2007) Clin. Cancer Res. 13, 3115–3124 [DOI] [PubMed] [Google Scholar]
- 33.Gaultier A., Hollister M., Reynolds I., Hsieh E. H., Gonias S. L. (2010) Matrix Biol. 29, 22–30 [DOI] [PMC free article] [PubMed] [Google Scholar]
- 34.Okumura Y., Sato H., Seiki M., Kido H. (1997) FEBS Lett. 402, 181–184 [DOI] [PubMed] [Google Scholar]
- 35.Kogianni G., Walker M. M., Waxman J., Sturge J. (2009) Eur. J. Cancer 45, 685–693 [DOI] [PubMed] [Google Scholar]
- 36.Mondino A., Blasi F. (2004) Trends Immunol. 25, 450–455 [DOI] [PubMed] [Google Scholar]
- 37.Turk B. (2006) Nat. Rev. Drug Discov. 5, 785–799 [DOI] [PubMed] [Google Scholar]
Associated Data
This section collects any data citations, data availability statements, or supplementary materials included in this article.


