

Abstract
G protein-coupled receptor (GPCR) heteromers are macromolecular complexes with unique functional properties different from those of its individual protomers. Little is known about what determines the quaternary structure of GPCR heteromers resulting in their unique functional properties. In this study, using resonance energy transfer techniques in experiments with mutated receptors, we provide for the first time clear evidence for a key role of intracellular domains in the determination of the quaternary structure of GPCR heteromers between adenosine A2A, cannabinoid CB1, and dopamine D2 receptors. In these interactions, arginine-rich epitopes form salt bridges with phosphorylated serine or threonine residues from CK1/2 consensus sites. Each receptor (A2A, CB1, and D2) was found to include two evolutionarily conserved intracellular domains to establish selective electrostatic interactions with intracellular domains of the other two receptors, indicating that these particular electrostatic interactions constitute a general mechanism for receptor heteromerization. Mutation experiments indicated that the interactions of the intracellular domains of the CB1 receptor with A2A and D2 receptors are fundamental for the correct formation of the quaternary structure needed for the function (MAPK signaling) of the A2A-CB1-D2 receptor heteromers. Analysis of MAPK signaling in striatal slices of CB1 receptor KO mice and wild-type littermates supported the existence of A1-CB1-D2 receptor heteromer in the brain. These findings allowed us to propose the first molecular model of the quaternary structure of a receptor heteromultimer.
Keywords: G Protein-coupled Receptors (GPCR), Neurochemistry, Protein Conformation, Protein Domains, Receptor Structure-Function
Introduction
Receptor heteromers are the focus of intense research, as through heteromerization receptors become unique functional entities with different properties from those of either receptor when not engaged in heteromerization resulting in new therapeutic targets (1–4). Their unique properties provide a “biochemical fingerprint” thus allowing their identification in native tissues (1, 3). There is already a long list of discovered heteromers with two different G protein-coupled receptors (GPCRs)2 (2, 4). Furthermore, we recently obtained evidence for the existence of receptor heteromultimers, i.e. heteromers including more than two different receptors, and reported on heteromers, including the GPCRs adenosine A2A, cannabinoid CB1, and dopamine D2 receptors, in transfected cells (5). Evidence of GPCR homomultimers has also been recently demonstrated in living cells (6, 7). Many important questions regarding receptor heteromers and heteromultimers remain unanswered. What is the arrangement of their GPCR units (quaternary structure)? What are the molecular determinants of their quaternary structure? Last but not least, what is their functional significance in native tissues?
It was inferred that different molecular mechanisms were involved in GPCR homo- and heteromerization. For family C GPCRs, disulfide bonds between extracellular domains as well as coiled-coil interactions between C-terminal domains seem to be necessary for the formation of functional homomeric or heteromeric receptors (8). For oligomerization of family A GPCRs, the helical transmembrane (TM) domains seem to be particularly important (7, 9–15). In this study, by using mutated A2A, CB1, and D2 receptors, we investigated the relevance of electrostatic interactions (16) between intracellular domains in the determination of the quaternary structure of GPCR heteromers between A2A, CB1, and D2 receptors. Our initial goal was to obtain evidence for multiple intracellular interactions in the A2A-CB1-D2 receptor heteromultimer. Significantly, the same intracellular domains involved in A2A-CB1-D2 receptor heteromultimerization were also involved in A2A-D2, A2A-CB1, and CB1-D2 receptor heteromerization. A three-dimensional model of the quaternary structure of the receptor heteromultimer was obtained by using the information from resonance energy transfer between A2A, CB1, and D2 receptors in the receptor heteromultimer. Furthermore, a biochemical property of the receptor heteromultimer was found to be dependent on its correct quaternary structure, determined by the intracellular electrostatic interactions, which allowed its identification in rodent brain tissue.
EXPERIMENTAL PROCEDURES
Cell Culture
HEK-293T cells were grown in Dulbecco's modified Eagle's medium (DMEM) (Invitrogen) supplemented with 2 mm l-glutamine, 100 units/ml penicillin/streptomycin, and 5% (v/v) heat-inactivated fetal bovine serum (FBS) (all supplements were from Invitrogen). CHO cell lines were maintained in α-minimal essential medium without nucleosides, containing 10% fetal calf serum, 50 μg/ml penicillin, 50 μg/ml streptomycin, and 2 mm l-glutamine (300 μg/ml). Cells were maintained at 37 °C in an atmosphere of 5% CO2 and were passaged when they were 80–90% confluent, twice a week.
Mutant Receptors
Ser374 in the C-terminal domain of the human A2A receptor was mutated to Ala to obtain the A2AA374 receptor. The sequence 199RIFLAARRQ207 (boldface letters indicate the amino acid involved in the interaction between the receptors and the residues that were mutated) in the cytoplasm at the end of TM5 of human A2A receptor was mutated to 199RIFLAAAAQ207 to obtain the A2AA205-A206 receptor. The sequence 462SVSTDTSAE470 in the C-terminal domain of human CB1 receptor was mutated to 462SVSTDAAAE470 to obtain the CB1A467-A468 receptor. The sequence 321TSEDGKVQVT330 in the third intracellular loop of human CB1 receptor was mutated to 321AAEDGKVQVT330 to obtain CB1A321-A322 receptor. Mutations were performed by site-directed mutagenesis (Cellogenetics, Ijamsville, MD).
Fusion Proteins and Expression Vectors
The human cDNAs of the A2A, CB1, and the mutant versions of these receptors or the human D2, D2S, and D4.4 receptors, cloned in pcDNA3.1, were amplified without their stop codons using sense and antisense primers harboring unique EcoRI and BamHI sites to clone A2A, A2AA374, and A2AA205-A206 receptors in the Rluc corresponding vector, EcoRI and KpnI to clone D2 and D2S receptors in the GFP2 corresponding vector, BamHI and EcoRI to clone CB1, CB1A467-A468, and CB1A321-A322 in the enhanced YFP corresponding vector, and XhoI and BamHI sites to clone D4.4 receptor in the Rluc corresponding vector. The amplified fragments were subcloned to be in-frame into restriction sites of the multiple cloning sites of pcDNA3.1-Rluc, pGFP2-N3(h), pEYFP-N1 (Clontech) to give the plasmids corresponding to A2A-Rluc, A2AA374-Rluc A2AA205-A206-Rluc, D4-Rluc, D2-GFP2, D2S-GFP2, CB1-YFP, CB1A467-A468-YFP, and CB1A321-A322-YFP receptor fusion proteins. The cDNA of the 5HT2B-YFP fusion protein was kindly provided by Dr. Irma Nardi (University of Pisa, Italy). Under these conditions, the fusion proteins are expressed at the membrane level, are not strongly overexpressed, and are quantitatively expressed in similar amounts (5).
Transient Transfection and Sample Preparation
HEK-293T or CHO cells growing in 6-well dishes were transiently transfected with the corresponding fusion protein cDNA by the polyethyleneimine method (Sigma). Cells were incubated (4 h) with the corresponding cDNA together with polyethyleneimine (5.47 mm in nitrogen residues) and 150 mm NaCl in a serum-starved medium. After 4 h, the medium was changed to a fresh complete culture medium. Forty eight hours after transfection, cells were washed twice in quick succession in Hanks' balanced salt solution with 10 mm glucose, detached, and resuspended in the same buffer containing 1 mm EDTA. To control the cell number, sample protein concentration was determined using a Bradford assay kit (Bio-Rad) using bovine serum albumin dilutions as standards. Cell suspension (20 μg of protein) was distributed into 96-well microplates; black plates with transparent bottom were used for FRET and fluorescence determinations, and white plates with white bottom were used for BRET and SRET experiments.
BRET Experiments
HEK-293T cells expressing the corresponding donor (receptor Rluc) and increasing amounts of the corresponding acceptor (receptor GFP2 for BRET2 or receptor YFP for BRET1), as indicated in figure legends, were used. With aliquots of transfected cells (20 μg of protein), three different determinations were performed in parallel. (i) To quantify fluorescence proteins expression, cells were distributed in 96-well microplates (black plates with transparent bottom), and fluorescence was read in a Fluostar Optima Fluorimeter (BMG Labtechnologies, Offenburg, Germany) equipped with a high energy xenon flash lamp, using an excitation filter at 410 nm for receptor GFP2 reading (BRET2) or 485 nm for receptor YFP reading (BRET1), and emission was detected using filters at 510 nm (for GFP2) or 530 nm (for YFP). Receptor fluorescence expression was determined as fluorescence of the sample minus the fluorescence of cells expressing receptor Rluc alone. (ii) For BRET2 and BRET1 measurements, the equivalent of 20 μg of cell suspension was distributed in 96-well microplates (Corning 3600, white plates with white bottom), and 5 μm DeepBlueC (BRET2) or coelenterazine H (BRET1) (Molecular Probes, Eugene, OR) was added. For BRET2 experiments, readings were collected immediately (∼30 s) after addition of DeepBlueC using a Mithras LB 940 (Berthold Technologies, DLReady, Germany) that allows the integration of the signals detected in the short wavelength filter at 410 nm and the long wavelength filter at 510 nm. In BRET1 after 1 min of adding coelenterazine H, the readings were collected using a Mithras LB 940 that allows the integration of the signals detected in the short wavelength filter at 485 nm and the long wavelength filter at 530 nm. (iii) To quantify receptor Rluc expression, luminescence readings were performed after 10 min of adding 5 μm coelenterazine H. The net BRET is defined as ((long wavelength emission)/(short wavelength emission)) − Cf, where Cf corresponds to ((long wavelength emission)/(short wavelength emission)) for the Rluc construct expressed alone in the same experiment.
FRET Experiments
HEK-293T cells expressing the corresponding donor (receptor GFP2) and increasing amounts of the corresponding acceptor (receptor YFP), as indicated in figure legends, were used. Using aliquots of transfected cells (20 μg of protein), two different determinations were performed in parallel. (i) To quantify YFP fluorescence, due to receptor YFP expression, the same procedure as described for BRET experiments was used. (ii) For FRET measurements, the equivalent of 20 μg of cell suspension was distributed into 96-well microplates (black plates with a transparent bottom) and read in a Fluostar Optima fluorimeter equipped with a high energy xenon flash lamp, using an excitation filter at 410 nm and an emission filters at 510 nm (Chx) and 530 nm (Chy). Gain settings were identical for all experiments to keep the relative contribution of the fluorophores to the detection channels constant for spectral unmixing. The contribution of GFP2 and YFP proteins alone to the two detection channels (spectral signature (17)) was measured in experiments with cells expressing only one of these proteins and normalized to the sum of the signal obtained in the two detection channels. The spectral signatures of the different receptors fused to either GFP2 or YFP did not vary significantly from the determined spectral signatures of the fluorescent proteins alone. In determinations i and ii, linear unmixing was done taking into account the spectral signature as described by Zimmermann et al. (17) to separate the two emission spectra. For quantitation of the fluorescence emitted by each of two individual fluorophores (FluoA corresponding to the donor and FluoB corresponding to the acceptor) in FRET experiments, Equation 1 was applied,
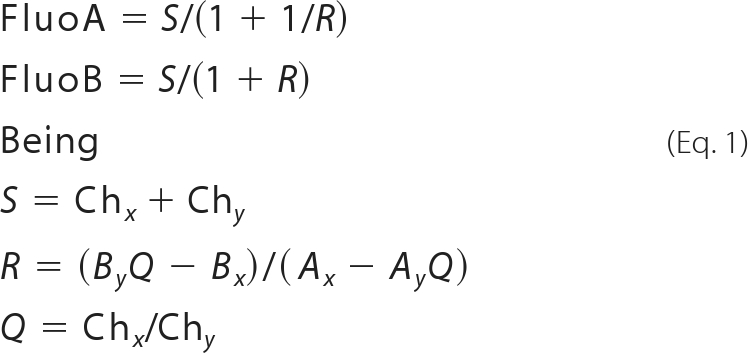 |
where Chx and Chy represent the signals in detection channels x and y, and Ax, Bx and Ay, Bx represent the normalized contributions of FluoA or FluoB to channels x and y, as they are known from the spectral signatures of the fluorescent proteins.
Sequential Resonance Energy Transfer (SRET) Experiments
The recently introduced sequential BRET-FRET (SRET) technique (5) not only allows the demonstration of heteromerization of three proteins but can also provide information about the quaternary structure of the heterotrimeric complex. By transfecting three receptors separately fused to Rluc, GFP2, and YFP, the detection of the SRET2 signal demonstrates the physical interactions between the three receptors. In SRET2, the oxidation of the Rluc substrate DeepBlueC triggers GFP2 excitation (BRET2), which triggers a subsequent excitation of YFP (FRET) (see Fig. 1). Emission of YFP after addition of DeepBlueC is only possible if the three fusion proteins are in close proximity (<10 nm), allowing bioluminescent and fluorescent SRET to occur. For SRET experiments, HEK-293T cells were transiently co-transfected with the indicated amounts of plasmid cDNAs corresponding to receptor Rluc, receptor GFP2, and receptor YFP (see figure legends). In the experiments without casein kinase 1/2 inhibitors, cells were used 48 h post-transfection. When using casein kinase 1/2 inhibitors, cells were treated with casein kinase 1 inhibitor IC 261 (50 μm; Calbiochem) and casein kinase 2 inhibitor TBAC (10 μm; Calbiochem) 4 h after transfection, and after 24 h, the medium was changed to a fresh complete culture medium containing the same amount of inhibitors, and cells were used 48 h post-transfection. Using aliquots of transfected cells (20 μg of protein), different determinations were performed in parallel. (i) Quantification of protein-YFP expression was performed as indicated in FRET experiments. The sample fluorescence is the fluorescence calculated as described minus the fluorescence of cells expressing only protein-Rluc and protein-GFP2. (ii) Quantification of protein-Rluc expression was by determination of the luminescence due to protein-Rluc. Cells were distributed in 96-well microplates (Corning 3600, white plates with white bottom), and luminescence was determined 10 min after addition of 5 μm coelenterazine H in a Mithras LB 940 multimode reader. (iii) BRET and FRET were combined to generate a technique called sequential BRET-FRET (SRET) that permits identification of heteromers formed by three different proteins. Cells were distributed in 96-well microplates (Corning 3600, white plates with white bottom), and 5 μm DeepBlueC (Molecular Probes, Eugene, OR) was added. The SRET2 signal was collected using a Mithras LB 940 reader with detection filters for short wavelength (410 nm) and long wavelength (530 nm). By analogy with BRET, net SRET2 is defined as ((long wavelength emission)/(short wavelength emission)) − Cf, where Cf corresponds to long wavelength emission/short wavelength emission for cells expressing protein-Rluc and protein-GFP2. Linear unmixing was done for SRET2 quantification, taking into account the spectral signature to separate the two fluorescence emission spectra (17). (iv) Using aliquots of cells transfected for SRET experiments, BRET1, BRET2, and FRET measurements were performed as indicated above. A SRET2 saturation curve can be obtained determining SRET2 as a function of increasing expression of the FRET acceptor (receptor YFP). From these saturation curves, an apparent SRETmax was determined by fitting data to a monophasic saturation curve by nonlinear regression using the commercial Grafit curve-fitting software (Erithacus Software, Surrey, UK). These parameters have a similar meaning to these parameters when applied to BRET assays (5).
FIGURE 1.

A2A-CB1-D2 receptor heteromerization in living cells. Assays were performed 48 h post-transfection in cells expressing A2A-Rluc receptor (1 μg of cDNA; ∼100,000 luminescence units), D2-GFP2 receptor (3 μg of cDNA; ∼6,000 fluorescence units), and increasing amounts of CB1-YFP receptor cDNA (8,000–18,000 fluorescence units). In each sample fluorescence or luminescence was measured before every experiment to confirm similar donor expressions while monitoring the increased acceptor expression. a and b, aliquots of these cells were used. a, net SRET2 was obtained by monitoring the YFP fluorescence emission after DeepBlueC addition, with subtraction of the value obtained with cells expressing the same amount of A2A-Rluc and D2-GFP2 receptors. SRET saturation curves (black) were obtained for the coupling of A2A-Rluc, D2-GFP2, and CB1-YFP receptors, although negligible and linear SRET was obtained in cells expressing equivalent amounts of A2A-Rluc, D2-GFP2, and 5HT2B-YFP receptors (green) or D4-Rluc, A2A-GFP2, and CB1-YFP receptors (red). SRET data are expressed as means ± S.D. of 5–8 different experiments grouped as a function of the amount of SRET acceptor. b, BRET1 was obtained by monitoring the YFP fluorescence emission after coelenterazine H addition, with subtraction of the value obtained with cells expressing the same amount of A2A-Rluc receptor. BRET2 was obtained by monitoring the emission of GFP2 fluorescence after DeepBlueC addition, with subtraction of the value obtained with cells expressing the same amount of A2A-Rluc receptors. FRET was measured by monitoring the emission of YFP fluorescence after excitation of GFP2 at 400 nm. Data are expressed as the mean ± S.E. of 5–8 independent experiments performed in duplicate. Linear unmixing of the emission signals was applied to BRET2 and FRET values (b) and for YFP quantification in saturation curves (a). c, schematic representation of the putative triangular quaternary structure of the A2A-CB1-D2 receptor heteromer. mBu, milli-BRET unit.
ERK Phosphorylation Assays
Wild-type littermates and CB1 receptor knock-out CD1 albino Swiss male mice, 8 weeks old, weighing 25 g were used. The generation of mice lacking CB1 receptor has been described elsewhere (18, 19). Mice were housed five per cage in a temperature- (21 ± 1 °C) and humidity-controlled (55 ± 10%) room with a 12:12 h light/dark cycle (light between 08:00 and 20:00 h) with food and water ad libitum. Animal procedures were conducted according to standard ethical guidelines (European Communities Council Directive 86/609/EEC) and approved by the Local Ethical Committee (IMAS-IMIM/UPF). Mice were decapitated with a guillotine, and the brains were rapidly removed and placed in ice-cold oxygenated (O2/CO2, 95:5%) Krebs-HCO3− buffer (124 mm NaCl, 4 mm KCl, 1.25 mm NaH2PO4, 1.5 mm MgCl2, 1.5 mm CaCl2, 10 mm glucose, and 26 mm NaHCO3, pH 7.4). The brains were sliced at 4 °C in a brain matrix (Zivic Instruments, Pittsburgh, PA) into 0.5-mm coronal slices. Slices were kept at 4 °C in Krebs-HCO3− buffer during the dissection of the striatum. Each slice was transferred into an incubation tube containing 1 ml of ice-cold Krebs-HCO3− buffer. The temperature was raised to 23 °C, and after 30 min, the media were replaced by 2 ml of Krebs-HCO3− buffer (23 °C). The slices were incubated under constant oxygenation (O2/CO2, 95:5%) at 30 °C for 4–5 h in an Eppendorf thermomixer (Eppendorf-5 Prime, Inc., Boulder, CO). The media were replaced by 200 μl of fresh Krebs-HCO3− buffer, and after 30 min, 1 μm of the A2A receptor agonist CGS-21680, 1 μm of the D2 receptor agonist quinpirole, or both prepared in Krebs-HCO3− buffer were added. After 10 min, the incubation solution was discarded, and slices were frozen on dry ice and stored at −80 °C. When ERK phosphorylation assays were performed in cell cultures, CHO cells (48 h after transfection) were cultured in serum-free medium for 16 h before the addition of any agent. Cells were resuspended in Hanks' balanced salt solution buffer and were treated for 5 min with CGS2168 (200 nm), quinpirole (1 μm), or a mixture of both ligands and rinsed with ice-cold phosphate-buffered saline. Both cells and slices were lysed by the addition of 500 μl of ice-cold lysis buffer (50 mm Tris-HCl, pH 7.4, 50 mm NaF, 150 mm NaCl, 45 mm β-glycerophosphate, 1% Triton X-100, 20 μm phenylarsine oxide, 0.4 mm NaVO4, and protease inhibitor mixture). The cellular debris was removed by centrifugation at 13,000 × g for 5 min at 4 °C, and the protein was quantified by the bicinchoninic acid method using bovine serum albumin dilutions as standard. To determine the level of ERK1/2 phosphorylation, equivalent amounts of protein (10 μg) were separated by electrophoresis on a denaturing 7.5% SDS-polyacrylamide gel and transferred onto PVDF membranes. The membranes were then probed with a mouse anti-phospho-ERK1/2 antibody (Sigma, 1:2500). To rule out that the differences observed were due to the application of unequal amounts of lysates, PVDF blots were stripped and probed with a rabbit anti-ERK1/2 antibody that recognizes both phosphorylated and nonphosphorylated ERK1/2 (Sigma, 1:40,000). Bands were visualized by the addition of anti-mouse HRP-conjugated (Dako, Glostrup, Denmark) or anti-rabbit HRP-conjugated (Sigma) secondary antibodies, respectively, and SuperSignal West Pico chemiluminescent substrate (Pierce). Bands densities were quantified with LAS-3000 (Fujifilm), and the level of phosphorylated ERK1/2 isoforms was normalized for differences in loading using the total ERK protein band intensities. Quantitative analysis of detected bands was performed by Image Gauge version 4.0 software. Bifactorial ANOVA and post hoc Bonferroni tests were used for statistical comparisons.
Mass Spectometric Analysis
0.3 μl of equimolar solutions of the various peptides were deposited on the sample plate followed by 0.3 μl of matrix, a saturated solution of 2,4,6-trihydroxyacetophenone in 50% ethanol, and left to dry at room temperature. Spectra of each sample spot were acquired using a MALDI TOF-TOF instrument (Applied Biosystem 4700 proteomics analyzer, Framingham, MA) in positive ion mode. Each spectrum is the average of 1000 shots. All peptides were synthesized at The Johns Hopkins School of Medicine “Synthesis and Sequencing Facility.”
Computational Models of D2, CB1, and A2A Receptors
The amino acid sequences of the human D2 receptor (accession number P14416), CB1 receptor (P21554), and A2A receptor (P29274) receptors were obtained from UniProt. Structural simulations of the A2A receptor are based on its crystal structure (PDB code 3EML) (20). Simulations of the D2 and CB1 receptors are based on computational models constructed by homology modeling techniques using the crystal structure of the β2-adrenergic receptor (PDB code 2RH1) (21, 22) as template. Because of the absence of P5.50 Ballesteros-Weinstein numbering (23) in the CB1 receptor, we superimposed Tyr292(5.58) and Lys300(5.66) to Tyr219(5.58) and Lys227(5.66) of the β2-adrenergic receptor. Tyr5.58 and Lys5.66 are structural and functional amino acids involved in the stabilization of the active state by interacting with Arg3.50 and Asp/Glu6.30, respectively, as revealed by the recent crystal structure of the ligand-free opsin, which contains several distinctive features of the active state (24). The highly conserved NPXXYXn= 5,6F(K/R) motif at the junction between TM7 and Hx8 is one residue shorter in the β2-adrenergic receptor (n = 5) than in rhodopsin and D2 or CB1 receptors (n = 6). Thus, this junction in D2 or CB1 receptors was modeled as in rhodopsin (PDB codes 1GZM and 2Z73) (25, 26). The unambiguous assignment of the TM boundaries to a particular position is not possible. However, we have assumed that TM5 of A2A extends to position Arg206(5.67) as shown in the crystal structure (20), and TM5 of D2 extends to position Arg220(5.69) according to the β2-based homology model (21, 22). These definitions of TM5 cause Arg205(5.66)–Arg206(5.67) of the A2A receptor and 215(5.64)VLRRRRKRVN224 of the D2 receptor to be located at the end of TM5 in the cytoplasm. In contrast, the Swiss Protein Database assigns these epitopes of A2A and D2 in IL3. The crystal structure of squid rhodopsin (PDB code 2Z73) has shown that in addition to the conserved amphipathic Hx8 that runs parallel to the membrane, the C terminus expands toward TM6 (25). However, the structural homology, among GPCRs, probably does not extend to this C-tail domain because of its high variability in length and amino acid composition among the members of the family. This C-tail is formed by 59 amino acids in the CB1 receptor (Ser414–Leu472), only 1 amino acid in the D2 receptor (Cys443), and 104 amino acids in the A2A receptor (Arg309–Ser412). Nevertheless, Ser414–Asn437 of the CB1 receptor and Arg309–Gly330 of the A2A receptor, forming part of this C-tail sequence, were modeled, in an arbitrary manner, based on the structure of squid rhodopsin.
Computational Models of Receptor Heteromers
Cysteine cross-linking experiments have suggested that receptor oligomerization involves the surfaces of TM1, -4, and/or -5 (10, 12, 13). Thus, the structures of receptor heteromers were modeled in such a manner that substituted cysteines at position 1.35 could be cross-linked (TM1–TM1) (13); or positions 4.41, 4.44, 4.48, 4.51, and 4.59 (TM4-TM4invago) (12); or positions 4.50, 4.54, and 4.58 (TM4-TM4ago) (12); or position 5.41 (TM5-TM5) (12).
RESULTS
Quaternary Structure of the A2A-CB1-D2 Receptor Heteromer
An obvious initial question about receptor heteromers made up of three different receptors is whether each receptor interacts with the other two or not, i.e. if they form a triangular or linear arrangement. As in a prior report (5), we first demonstrated the ability of A2A-Rluc, D2-GFP2, and CB1-YFP receptors to form heteromers by determining the SRET saturation curve in transfected HEK-293T cells (Fig. 1a). In the same experimental preparation, we found significant BRET2 and FRET signals between the A2A-Rluc-D2-GFP2 receptor pair and the D2-GFP2-CB1-YFP receptor pair, respectively (Fig. 1b). Furthermore, we also detected by BRET1 assays a positive transfer of energy between A2A-Rluc and CB1-YFP receptors (Fig. 1b). These data and the positive SRET signal (Fig. 1a) in cells co-expressing A2A-Rluc, D2-GFP2, and CB1-YFP receptors suggest a triangular arrangement between the three receptors (Fig. 1c). In fact, taking into account the correlation between FRET efficiency and acceptor/donor distances and that Rluc, GFP2, and YFP are fused to the end of the C terminus of the receptors, the distance between BRET donors and acceptors can be approximated (17). Considering the high FRET efficiency between D2-GFP2 and CB1-YFP receptors (36 ± 3%), the range of the distance between GFP2 and YFP in the heteromer is estimated to be 5.7–6.1 nm. Thus, a linear arrangement of the three receptors could give a positive SRET signal but a very much reduced or even nonsignificant BRET1 signal between A2A-Rluc and CB1-YFP receptors, because there is a rapid dissipation of the energy transfer (to the 6th power of the distance). Therefore, assuming that the heterotrimer is the minimal unit, only a triangular arrangement of monomers (Fig. 1c) would make both SRET (Fig. 1a) and BRET1 (Fig. 1b) possible between A2A-Rluc and CB1-YFP receptors.
Multiple Electrostatic Interactions in A2A-CB1-D2 Receptor Heteromers
The amino acid sequence of the human CB1 receptor contains two highly conserved epitopes with two adjacent Thr and Ser residues (supplemental Table 1), which have a high probability of CK1/2-dependent phosphorylation (Swiss Protein Database “Net Phos” program (27)). They are located in the distal portion of the C terminus (CT) of the CB1 receptor (Thr467 and Ser468) and in the middle portion of intracellular loop (IL) 3 (Thr321 and Ser322). The initial working hypothesis was that these CB1 receptor epitopes, with high probability of phosphorylation, would be relevant in determining the quaternary structure of the A2A-CB1-D2 receptor heteromer, by establishing electrostatic interactions with Arg-rich epitopes located in the A2A and D2 receptors.
Electrostatic Interaction between Phosphorylated Thr467–Ser468 in the C Terminus of the CB1 Receptor and Arg205(5.66)-Arg206(5.67) in the Cytoplasm at the End of Transmembrane Helix 5 of the A2A Receptor
We first looked at possible alterations in heteromerization between CB1 and A2A and between CB1 and D2 receptor in cells co-expressing a mutant CB1 receptor in which Thr467(CT) and Ser468(CT) were replaced by Ala (CB1A467-A468 receptor). In cells co-expressing A2A-Rluc and CB1A467-A468-YFP receptors, there was a reduction of BRET1 values when compared with those obtained with cells expressing A2A-Rluc and CB1-YFP (Fig. 2a). On the other hand, these mutations did not modify the FRET values between D2-GFP2 and CB1A467-A468-YFP, when compared with cells expressing D2-GFP2 and CB1-YFP (Fig. 2b). This mutated CB1 receptor and all the mutant receptors described below were shown to be well expressed at the membrane level (results not shown). Furthermore, the fact that the mutated CB1 receptor selectively altered the RET signal when co-expressed with A2A but not with the D2 receptors demonstrates that the results cannot be explained by changes in the membrane expression of the mutant receptor or its putative partner. These results therefore show that Thr467(CT) and Ser468(CT) of the CB1 receptor are involved in the molecular interaction with the A2A receptor in the A2A-CB1 receptor heteromer. The existence of measurable BRET1 values in cells co-expressing A2A-Rluc and CB1A467-A468-YFP receptors indicate that the CB1A467-A468 receptor is still able to interact physically with the A2A receptor and that other domains, most likely TM domains (see Introduction). are also involved in A2A-CB1 receptor heteromerization. This CT epitope of the CB1 receptor was also able to interact with the A2A receptor in the A2A-CB1-D2 receptor heteromer, as deduced from the low SRET values obtained when CB1A467-A468-YFP receptor was co-expressed with A2A-Rluc and D2-GFP2 receptors (Fig. 2c). Furthermore, in cells expressing CB1A467-A468-YFP, A2A-Rluc, and D2-GFP2 receptors, BRET1 values between A2A-Rluc and CB1A467-A468-YFP receptors and BRET2 values between A2A-Rluc and D2-GFP2 receptors were significantly reduced, and FRET values between D2-GFP2 and CB1A467-A468-YFP receptors were increased relative to cells expressing nonmutated receptors (Fig. 2d). Because the bioluminescent or fluorescent proteins are fused to the CT of the receptors, these results indicate that expression of CB1A467-A468-YFP receptors induced a modification of the quaternary structure of the A2A-CB1-D2 heteromer, with separation of the CT of CB1 and A2A receptors and A2A and D2 receptors and approximation of the CT of CB1 and D2 receptors.
FIGURE 2.

A2A-CB1A467-A468-D2 receptor heteromerization in living cells. Assays were performed 48 h post-transfection in cells expressing the following: a, A2A-Rluc receptor (1 μg of cDNA; ∼100,000 luminescence units) and increasing amounts of cDNA of the CB1-YFP or CB1A467-A468-YFP receptors (8,000–18,000 fluorescence units); mBu, milli-BRET unit. b, D2-GFP2 (3 μg of the cDNA; ∼6,000 fluorescence units) and increasing amounts of the cDNA for CB1-YFP or CB1A467-A468-YFP; c and d, A2A-Rluc receptor (1 μg of cDNA; ∼100,000 luminescence units), D2-GFP2 receptor (3 μg of the cDNA; ∼6,000 fluorescence units), and increasing amounts of cDNA of the CB1A467-A468-YFP receptor (8,000–18,000 fluorescence units). In each sample, fluorescence or luminescence was measured before every experiment to confirm similar donor expressions while monitoring the increased acceptor expression. a, BRET1 saturation curves for the A2A-Rluc-CB1-YFP receptor pair (squares) and for the A2A-Rluc-CB1A467-A468-YFP receptor pair (triangles) were obtained by monitoring the YFP fluorescence emission after coelenterazine H addition, with subtraction of the value obtained with cells expressing the same amount of A2A-Rluc receptor. Data are expressed as means ± S.D. of five different experiments grouped as a function of the amount of BRET1 acceptor. b, FRET saturation curves for the D2-GFP2-CB1-YFP receptor pair (triangles) and for the D2-GFP2- CB1A467-A468-YFP receptor pair (squares) were obtained by monitoring the YFP fluorescence emission at 530 nm after excitation of GFP2 at 400 nm, with subtraction of the value obtained with cells expressing the same amount of donor protein. Data are expressed as means ± S.D. of seven different experiments grouped as a function of the amount of FRET acceptor. c, net SRET2 was obtained by monitoring the emission of YFP fluorescence after DeepBlueC addition, with subtraction of the value obtained with cells expressing the same amount of A2A-Rluc and D2-GFP2 receptors. SRET saturation curves (solid line) were obtained for the coupling of A2A-Rluc, D2-GFP2, and CB1A467-A468-YFP receptors and compared with the curve obtained for the coupling of A2A-Rluc, D2-GFP2, and CB1-YFP receptors (dotted line, see Fig. 1). SRET data are expressed as means ± S.D. of five different experiments grouped as a function of the amount of SRET acceptor. d, BRET1, BRET2, and FRET were measured as indicated in Fig. 1 legend. Data are expressed as % of values obtained in cells expressing A2A-Rluc, D2-GFP2, and CB1-YFP receptors (control, Fig. 1b), in mean ± S.E. of five independent experiments performed in duplicate. One-way ANOVA followed by Bonferroni test showed significant increases or decreases with respect to the control (*, p < 0.05; **, p < 0.01; ***, p < 0.005). Linear unmixing of the emission signals was applied to the data for BRET2 and FRET values (b and d) and for YFP quantification in saturation curves (a and c). e, the spectrum of a mixture of the following three peptides SVSTDAAAE, SVSTDpTpSAE, and LRIFLAARR, shows only one noncovalent complex between SVSTDpTpSAE and LRIFLAARR at 2171.7 atomic mass units (see text).
We then looked for the presence of adjacent Arg residues in intracellular domains of the A2A receptor that could potentially interact with the phosphorylated Thr467(CT) and Ser468(CT) of CB1 receptor via electrostatic interactions. We found a highly conserved motif, Arg205(5.66)–Arg206(5.67) (supplemental Table 1), located in the cytoplasm at the end of TM5, according to the crystal structure (see “Experimental Procedures”). Mass spectrometric analysis demonstrated that a synthetic peptide corresponding to this A2A receptor epitope, 198LRIFLAARR206, and a phosphorylated peptide corresponding to the CT of the CB1 receptor epitope, 462SVSTDpTpSAE470, form stable noncovalent complexes, and the Ala-containing peptides LRIFLAAAA and SVSTDAAAE do not (Figs. 2e and 3e). We then investigated whether the A2A receptor epitope containing adjacent Arg could be involved in A2A-CB1 receptor heteromerization by using a mutant A2A receptor in which Arg205(5.66)–Arg206(5.67) were replaced by Ala (A2AA205-A206 receptor). Cells co-expressing A2AA205-A206-Rluc and CB1-YFP receptors showed lower BRET1 values than those expressing WT receptors (Fig. 3a). On the other hand, the BRET1 values between A2AA205-A206-Rluc and D2-YFP receptors were similar to the values between A2A-Rluc and D2-YFP receptors (Fig. 3b). Hence, the quaternary structure of the A2A-CB1 receptor heteromer depends on an electrostatic interaction between epitopes located in the CT of the CB1 receptor and in the cytoplasm at the end of TM5 of the A2A receptor. Furthermore, this electrostatic interaction is also involved in A2A-CB1-D2 receptor heteromerization (Fig. 3, c and d). In fact, low SRET values were obtained when the A2AA205-A206-Rluc receptor was co-transfected with D2-GFP2 and CB1-YFP receptors (Fig. 3c). In cells co-expressing A2AA205-A206-Rluc, D2-GFP2, and CB1-YFP receptors, BRET1 and BRET2 between the heteromer partners were significantly reduced, and FRET values between D2-GFP2 and CB1-YFP receptors were increased, compared with cells co-expressing nonmutated receptors (Fig. 3d). Significantly, this outcome is qualitatively the same as the one shown in Fig. 2d with CB1A467-A468-YFP receptor, as it would be expected if both mutants disrupt the same intermolecular interaction.
FIGURE 3.

A2AA205-A206-CB1-D2 receptor heteromerization in living cells. Assays were performed 48 h post-transfection in cells expressing the following: a, A2A-Rluc or A2AA205-A206-Rluc receptors (1 or 0.8 μg of cDNA respectively; ∼100,000 luminescence units) and increasing amounts of the cDNA of the CB1-YFP receptor (8,000–18,000 fluorescence units). mBu, milli-BRET unit. b, A2A-Rluc or A2AA205-A206-Rluc (1 or 0.8 μg of cDNA, respectively; ∼100,000 luminescence units) and increasing amounts of the cDNA for D2-YFP. c and d, A2AA205-A206-Rluc receptor (1 μg of cDNA; ∼100,000 luminescence units), D2-GFP2 receptor (3 μg of the cDNA; ∼6,000 fluorescence units), and increasing amounts of cDNA of the CB1-YFP receptor (8,000–18,000 fluorescence units). In each sample fluorescence or luminescence was measured before every experiment to confirm similar donor expressions while monitoring the increased acceptor expression. a, BRET1 saturation curves for the A2A-Rluc-CB1-YFP receptor pairs (squares) and for the A2AA205-A206-Rluc-CB1-YFP receptor pair (triangles) were obtained by monitoring the YFP fluorescence emission after coelenterazine H addition, with subtraction of the value obtained with cells expressing the same amount of donor. Data are expressed as means ± S.D. of five different experiments grouped as a function of the amount of BRET1 acceptor. b, BRET1 saturation curves for the A2A-Rluc-D2-YFP receptor pairs (triangles) and for the A2AA205-A206-Rluc-D2-YFP receptor pair (squares) were obtained by monitoring the YFP fluorescence emission after coelenterazine H addition, with subtraction of the value obtained with cells expressing the same amount of donor. Data are expressed as means ± S.D. of five different experiments grouped as a function of the amount of BRET1 acceptor. c, net SRET2 was obtained by monitoring the YFP fluorescence emission after DeepBlueC addition, with subtraction of the value obtained with cells expressing the same amount of A2AA205-A206-Rluc and D2-GFP2 receptors. SRET saturation curves (solid line) were obtained for the coupling of A2AA205-A206Rluc, D2-GFP2, and CB1-YFP receptors and compared with the curve obtained for the coupling of A2A-Rluc, D2R-GFP2, and CB1-YFP receptors (dotted line, see Fig. 1). SRET data are expressed as means ± S.D. of five different experiments grouped as a function of the amount of SRET acceptor. d, BRET1, BRET2, and FRET were measured as indicated in Fig. 1 legend. Data are expressed as % of values obtained in cells expressing A2A-Rluc, D2-GFP2, and CB1-YFP receptors (control, Fig. 1b), in mean ± S.E. of five independent experiments performed in duplicate. One-way ANOVA followed by Bonferroni test showed significant increases or decreases with respect to the control (**, p < 0.01; ***, p < 0.005). Linear unmixing of the emission signals was applied to the data for BRET2 and FRET values (d) and for YFP quantification in saturation curves (a–c). e, spectrum of a mixture of the following three peptides LRIFLAAAA, LRIFLAARR, and SVSTDpTpSAE, shows only one NCX between SVSTDpTpSAE and LRIFLAARR at 2171.7 atomic mass units (see text).
Electrostatic Interaction between Phosphorylated Thr321–Ser322 in Intracellular Loop 3 of the CB1 Receptor and an Arg-rich Epitope in Intracellular Loop 3 of the D2 Receptor
Because the Thr467(CT)-Ser468(CT)-containing epitope of the CB1 receptor was found to interact with Arg205(5.66)–Arg206(5.67) of the A2A receptor, it was expected that Thr321(IL3)–Ser322(IL3) of the CB1 receptor could interact with the D2 receptor. In fact, when co-expressing the mutant CB1A321-A322-YFP and D2-Rluc receptors, the BRET1 energy transfer between Rluc and YFP was reduced when compared with BRET1 values obtained with CB1-YFP and D2-Rluc receptors (Fig. 4a). On the other hand, the BRET1 values obtained in cells expressing CB1A321-A322-YFP and A2A-Rluc receptors were similar to those obtained with cells expressing CB1-YFP and A2A-Rluc (Fig. 4b). These results therefore show that the Thr321(IL3)–Ser322(IL3) motif of the CB1 receptor is selectively involved in the intermolecular interactions with the D2 receptor in the CB1-D2 receptor heteromer. The fact that BRET1 is still measurable between CB1A321-A322-YFP and D2-Rluc receptors indicates that, once more, other epitopes are also involved in CB1-D2 receptor heteromerization. Also, the same Thr321(IL3)–Ser322(IL3) epitope of the CB1 receptor interacted with the D2 receptor in the A2A-CB1-D2 receptor heteromer. Compared with nonmutated receptors, co-expression of CB1A321-A322-YFP receptor with A2A-Rluc and D2-GFP2 receptors showed a reduction in SRET values (Fig. 4c), and FRET values were significantly decreased, and BRET2 values were increased, whereas BRET1 values were not modified (Fig. 4d). This suggests that replacement of Thr321(IL3) and Ser322(IL3) by Ala in CB1 receptor induces a modification of the quaternary structure of the A2A-CB1-D2 receptor heteromer with separation of the CT of the CB1 and D2 receptors and an approximation of the CT of the D2 and A2A receptors. Thus, CB1 receptor uses two different CK1/2-dependent phosphorylatable epitopes, located in their CT (Thr467–Ser468) and IL3 (Thr321–Ser322) domains, to establish simultaneous electrostatic interactions with the A2A and D2 receptors, respectively, in the A2A-CB1-D2 receptor heteromer.
FIGURE 4.

A2A-CB1A321-A322-D2 receptor heteromerization in living cells. Assays were performed 48 h post-transfection in cells expressing the following: a, D2-Rluc receptor (1 μg of cDNA; ∼100,000 luminescence units) and increasing amounts of the cDNA for CB1-YFP or CB1A321-A322-YFP receptors (8,000–18,000 fluorescence units); b, A2A-Rluc (1 μg of cDNA; ∼100,000 luminescence units) and increasing amounts of the cDNA for CB1-YFP or CB1A321-A322-YFP; c and d, A2A-Rluc receptor (1 μg of cDNA; ∼100,000 luminescence units), D2-GFP2 receptor (3 μg of the cDNA; ∼6,000 fluorescence units), and increasing amounts of cDNA of the CB1A321-A322-YFP receptor (8,000–18,000 fluorescence units). In each sample fluorescence or luminescence was measured before every experiment to confirm similar donor expressions while monitoring the increased acceptor expression. a, BRET1 saturation curves for the D2-Rluc-CB1-YFP receptor pair (squares) and for D2-Rluc-CB1A321-A322-YFP receptor pair (triangles) were obtained by monitoring the YFP fluorescence emission after coelenterazine H addition, with subtraction of the value obtained with cells expressing the same amount of A2A-Rluc receptor. Data are expressed as means ± S.D. of six different experiments grouped as a function of the amount of BRET1 acceptor. b, BRET1 saturation curves for the A2A-Rluc-CB1-YFP receptor pair (triangles) and for A2A-Rluc-CB1A321-A322-YFP receptor pair (squares) were obtained by monitoring the YFP fluorescence emission after coelenterazine H addition, with subtraction of the value obtained with cells expressing the same amount of A2A-Rluc receptor. Data are expressed as means ± S.D. of six different experiments grouped as a function of the amount of BRET1 acceptor. c, net SRET2 was obtained by monitoring the YFP fluorescence emission after DeepBlueC addition, with subtraction of the value obtained with cells expressing the same amount of A2A-Rluc and D2-GFP2 receptors. SRET saturation curves (solid line) were obtained for the coupling of A2A-Rluc, D2-GFP2, and CB1A321-A322-YFP receptors and compared with the curve obtained for the coupling of A2A-Rluc, D2-GFP2, and CB1-YFP receptors (dotted line, see Fig. 1). SRET data are expressed as means ± S.D. of six different experiments grouped as a function of the amount of SRET acceptor. d, BRET1, BRET2, and FRET were measured as indicated in Fig. 1b legend. Data are expressed as percent of values obtained in cells expressing A2A-Rluc, D2-GFP2, and CB1-YFP receptors (control, Fig. 1b), in mean ± S.E. of six independent experiments performed in duplicate. One-way ANOVA followed by Bonferroni test showed significant increases or decreases with respect to the control (*, p < 0.05; **, p < 0.01). Linear unmixing of the emission signals was applied to the data for BRET2 and FRET values (d) and for YFP quantification in saturation curves (a–c). e, the spectrum of a mixture of the following three peptides AAEDGKVQVT, pTpSEDGKVQVT, and VLRRRRKRVN shows only one NCX between pTpSEDGKVQVT and VLRRRRKRVN at 2575.6 atomic mass units (see text). mBu, milli-BRET unit.
Next step was finding out which intracellular epitope of the D2 receptor is involved in CB1-D2 receptor heteromerization. D2 receptor contains two highly conserved Arg-rich epitopes (supplemental Table 1), 215(5.64)VLRRRRKRVN224, located at the end of TM5 in the cytoplasm (according to the homology modeling using the β2-adrenergic receptor as a template; see under “Experimental Procedures”), and 266NRRRVEAARR275, in the middle of IL3. Because the VLRRRRKRVN epitope is most probably involved in A2A-D2 receptor heteromerization (28, 29), we explored the possibility that IL3 of the D2 receptor could interact with IL3 of the CB1 receptor (phosphorylated Thr321–Ser322), The D2 short isoform (D2S), an alternative splicing that lacks 29 amino acid residues of IL3 (30), including 266NRRRVEAARR275, was used. SRET values were clearly reduced when D2S-GFP2 receptor was co-expressed with A2A-Rluc and CB1-YFP receptors (Fig. 5c). Significantly, the D2S receptor led to the same qualitative modifications of the quaternary structure of the A2A-CB1-D2 receptor heteromer as those induced by CB1A321-A322-YFP receptor (Fig. 5d). Thus, in cells expressing A2A-Rluc, CB1-YFP, and D2S-GFP2 receptors, FRET values between D2S-GFP2 and CB1-YFP receptors were significantly decreased, whereas BRET2 values between A2A-Rluc and D2S-GFP2 receptors were increased, and BRET1 values between A2A-Rluc and CB1-YFP receptors were not modified, when compared with cells co-expressing A2A-Rluc, D2-GFP2, and CB1-YFP receptors (Fig. 5d). These results indicate that in the A2A-CB1-D2 receptor heteromer, CB1 receptors interact with the Arg-rich domain located in IL3 of the D2 receptor.
FIGURE 5.

A2A-CB1-D2S receptor heteromerization in living cells. Assays were performed 48 h post-transfection in cells expressing the following: a, D2S-GFP2 receptor (1.5 μg of cDNA; ∼5,000 fluorescence units) or D2-GFP2 receptor (2 μg of cDNA; ∼5,000 luminescence units), and increasing amounts of cDNA of CB1-YFP receptor (8,000–18,000 fluorescence units); b, A2A-Rluc (1 μg of cDNA; ∼100,000 luminescence units) and increasing amounts of cDNA for D2-GFP2 or D2S-GFP2; c and d, A2A-Rluc receptor (1 μg of cDNA; ∼100,000 luminescence units), D2S-GFP2 receptor (3 μg of the cDNA; ∼6,000 fluorescence units) and increasing amounts of the cDNA for CB1-YFP receptor (8,000–18,000 fluorescence units). mBu, milli-BRET unit. In each sample fluorescence or luminescence was measured before every experiment to confirm similar donor expressions while monitoring the increased acceptor expression. a, FRET saturation curves for the D2-GFP2-CB1-YFP receptor pair (squares) and for D2S-GFP2-CB1-YFP receptor pair (triangles) were obtained by monitoring the YFP fluorescence emission at 530 nm after excitation of GFP2 at 400 nm, with subtraction of the value obtained with cells expressing the same amount of donor protein. Data are expressed as means ± S.D. of seven different experiments grouped as a function of the amount of FRET acceptor. b, BRET2 saturation curves for the A2A-Rluc-D2-GFP2 receptor pair (triangles) and for A2A-Rluc-D2S-GFP2 receptor pair (squares) were obtained by monitoring the YFP fluorescence emission after DeepBlueC addition, with subtraction of the value obtained with cells expressing the same amount of A2A-Rluc receptor. Data are expressed as means ± S.D. of six different experiments grouped as a function of the amount of BRET2 acceptor. c, net SRET2 was obtained by monitoring the YFP fluorescence emission after DeepBlueC addition, with subtraction of the value obtained with cells expressing the same amount of A2A-Rluc and D2S-GFP2 receptors. SRET saturation curves (solid line) were obtained for the coupling of A2A-Rluc, D2S-GFP2, and CB1-YFP receptors and compared with the curve obtained for the coupling of A2A-Rluc, D2-GFP2, and CB1-YFP receptors (dotted line, see Fig. 1). SRET data are expressed as means ± S.D. of five different experiments grouped as a function of the amount of SRET acceptor. d, BRET1, BRET2, and FRET were measured as indicated in Fig. 1 legend. Data are expressed as % of values obtained in cells expressing A2ARluc, D2-GFP2, and CB1-YFP receptors (control, Fig. 1b), in mean ± S.E. of five independent experiments performed in duplicate. One-way ANOVA followed by Bonferroni test showed significant increases or decreases with respect to the control (***, p < 0.005). Linear unmixing of the emission signals was applied to the data for BRET2 and FRET values (a, b, and d) and for YFP quantification in saturation curves (a and c). e, spectrum of a mixture of the following three peptides AAEDGKVQVT, pTpSEDGKVQVT, and NRRRVEAARR, shows only one NCX between pTpSEDGKVQVT and NRRRVEAARR at 2506.8 atomic mass units (see text).
Notably, expression of D2S-GFP2 or D2-GFP2 receptors with either CB1-YFP or A2A-Rluc or receptors gives similar FRET (Fig. 5a) or BRET2 (Fig. 5b) values, respectively. This indicates that in the absence of the 266NRRRVEAARR275 epitope in D2S-GFP2, the CB1 receptor can potentially interact with the other Arg-rich domain, 215(5.64)VLRRRRKRVN224, present in both isoforms of the D2 receptor. As expected, mass spectrometric analysis demonstrated that a synthetic peptide of the epitope located in IL3 of the CB1 receptor (321pTpSEDGKVQVT330), but not its equivalent Ala-containing peptide (AAEDGKVQVT), formed stable noncovalent complexes with the two Arg-rich epitopes of the D2 receptor (215(5.64)VLRRRRKRVN224 and 266NRRRVEAARR275) (Figs. 4e and 5e).
Electrostatic Interaction between Phosphorylated Ser374 in the C Terminus of the A2A Receptor and an Arg-rich Domain in the Cytoplasm at the End of Transmembrane Helix 5 of the D2 Receptor
The 215(5.64)VLRRRRKRVN224 epitope of the D2 receptor was shown to be involved in A2A-D2 receptor heteromerization by interacting with the CT domain of the A2A receptor (19, 20). We found a dramatic reduction of BRET1 values in cells co-expressing a mutant A2A-Rluc receptor, in which Ser374(CT) was replaced by Ala (A2AA374-Rluc receptor), and D2-YFP receptor (Fig. 6a). On the other hand, co-expression of A2AA374-Rluc and CB1-YFP receptors gave similar BRET1 values than WT receptors (Fig. 6b). These results confirm that Ser374(CT) of the A2A receptor is involved in the molecular interaction with the D2 receptor. Not surprisingly, Ser374(CT) of the A2A receptor was also found to be involved in providing the quaternary structure of the A2A-CB1-D2 receptor heteromer. Low SRET values were obtained when A2AA374-Rluc was co-expressed with D2-GFP2 and CB1-YFP receptors (Fig. 6c), compared with cells co-expressing the nonmutated receptors. From the analysis of BRET1, BRET2, and FRET occurring between partners in cells expressing A2AA374-Rluc, CB1-YFP, and D2-GFP2 receptors, it was observed that BRET2 values were significantly reduced, but FRET and BRET1 values were not significantly modified (Fig. 6d). These results indicate that the CT-mutated A2A receptor induces a modification of the quaternary structure of the A2A-CB1-D2 receptor heteromer, with separation of the CT of the A2A and D2 receptors. Therefore, the A2A receptor uses a double-Arg motif (Arg205(5.66)–Arg206(5.67)) located in the cytoplasm at the end of transmembrane helix 5 and a CK1/2-dependent phosphorylatable epitope located in CT (Ser374) to establish selective electrostatic interactions with the CB1 and D2 receptors, respectively. Hence, mass spectrometric analysis of a mixture of peptides corresponding to the cytoplasmic epitope at the end of TM5 of the D2 (215(5.64)VLRRRRKRVN224) and the CT epitopes of the A2A receptor (370SAQEpSQGNT378) and the mutant A2A receptor (370SAQEAQGNT378) resulted in noncovalent complexes between the D2 and the A2A receptor epitopes, but not in the case of the mutant A2A receptor (Fig. 6e).
FIGURE 6.

A2AA374-CB1-D2 receptor heteromerization in living cells. Assays were performed 48 h post-transfection in cells expressing the following: a, A2A-Rluc or A2AA374-Rluc receptors (1 or 0.8 μg of cDNA respectively; ∼100,000 luminescence units) and increasing amounts of cDNA of the D2-YFP receptor (8,000–18,000 fluorescence units); b, A2A-Rluc or A2AA374-Rluc (1 or 0.8 μg of cDNA respectively; ∼100,000 luminescence units) and increasing amounts of the cDNA for CB1R-YFP; c and d, A2AA374-Rluc receptor (1 μg of cDNA; ∼100,000 luminescence units), D2-GFP2 receptor (3 μg of the cDNA; ∼6,000 fluorescence units), and increasing amounts of cDNA of CB1-YFP receptor (8,000–18,000 fluorescence units). In each sample fluorescence or luminescence was measured before every experiment to confirm similar donor expressions while monitoring the increased acceptor expression. a, BRET1 saturation curves for the A2A-Rluc-D2-YFP receptor pair (squares) and for the A2AA374-Rluc-D2-YFP receptor pair (triangles) were obtained by monitoring the YFP fluorescence emission after coelenterazine H addition, with subtraction of the value obtained with cells expressing the same amount of donor. Data are expressed as means ± S.D. of five different experiments grouped as a function of the amount of BRET1 acceptor. b, BRET1 saturation curves for the A2A-Rluc-CB1-YFP receptor pair (triangles) and for the A2AA374-Rluc-CB1-YFP receptor pair (squares) were obtained by monitoring the YFP fluorescence emission after coelenterazine H addition, with subtraction of the value obtained with cells expressing the same amount of donor. Data are expressed as means ± S.D. of five different experiments grouped as a function of the amount of BRET1 acceptor. c, net SRET2 was obtained by monitoring the YFP fluorescence emission after DeepBlueC addition, with subtraction of the value obtained with cells expressing the same amount of A2AA374-Rluc and D2-GFP2 receptors. SRET saturation curves (solid line) were obtained for the coupling of A2AA374-Rluc, D2-GFP2, and CB1-YFP receptors and compared with the curve obtained for the coupling of A2A-Rluc, D2-GFP2, and CB1-YFP receptors (dotted line, see Fig. 1). SRET data are expressed as mean ± S.D. of five different experiments grouped as a function of the amount of SRET acceptor. d, BRET1, BRET2, and FRET were measured as indicated in Fig. 1 legend. Data are expressed as % of values obtained in cells expressing A2A-Rluc, D2-GFP2, and CB1-YFP (control, Fig. 1b) in mean ± S.E. of five independent experiments performed in duplicate. One-way ANOVA followed by Bonferroni test showed significant increases or decreases with respect to the control (*, p < 0.05; **, p < 0.01; ***, p < 0.005). Linear unmixing of the emission signals was applied to the data for BRET2 and FRET values (e) and for YFP quantification in saturation curves (a and b). e, spectrum of a mixture of the following three peptides SAQEAQGNT, SAQEpSQGNT, and VLRRRRKRVN shows only one NCX between SAQEpSQGNT and VLRRRRKRVN at 2353.6 atomic mass units (see text). mBu, milli-BRET unit.
Role of Casein Kinase 1/2-mediated Phosphorylation in the Quaternary Structure of A2A-CB1-D2 Receptor Heteromer
To demonstrate the actual involvement of casein kinase-induced phosphorylation in the electrostatic interactions between A2A, CB1, and D2 receptors in the A2A-CB1-D2 receptor heteromer, we studied the effects of co-administration of casein kinase 1 inhibitor IC 261 and casein kinase 2 inhibitor TBAC on SRET saturation experiments in HEK-293T cells co-transfected with A2A-Rluc, D2-GFP2, and CB1-YFP receptors. As expected, the casein kinase inhibitors significantly decreased SRET values (Fig. 7), supporting a role of casein kinases on maintaining a phosphorylated state of the intracellular domains of A2A and CB1 receptors involved in A2A-CB1-D2 receptor heteromerization.
FIGURE 7.
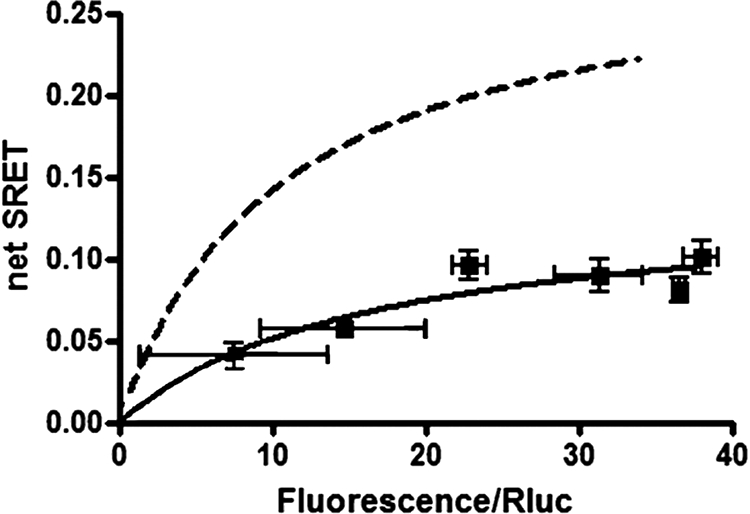
A2A-CB1-D2 receptor heteromerization in living cells treated with casein kinase 1/2 inhibitors. SRET2 saturation experiments were performed 48 h post-transfection in cells expressing A2A-Rluc receptor (1 μg of cDNA), D2-GFP2 receptor (3 μg of cDNA),and increasing amounts of CB1-YFP receptor cDNA, treated with the casein kinase 1 inhibitor IC 261 (50 μm) and casein kinase 2 inhibitor TBAC (10 μm) as described under “Experimental Procedures.” In each sample fluorescence or luminescence was measured before every experiment to confirm similar donor expressions (∼100,000 luminescence units) and similar GFP2 fluorescence (∼6,000 fluorescence units) while monitoring the increased acceptor expression (8,000–18,000 YFP fluorescence units). Net SRET2 was obtained by monitoring the emission of YFP fluorescence after DeepBlueC addition, with subtraction of the value obtained with cells expressing the same amount of receptor Rluc and receptor GFP2. SRET2 saturation curves (solid lines) were compared with the curve obtained for the coupling of A2A-Rluc, D2-GFP2, and CB1-YFP receptors in cells not treated with casein kinase inhibitors (dotted line, see Fig. 1). SRET data are expressed as means ± S.D. of five different experiments grouped as a function of the amount of SRET acceptor.
Computational Model of the Quaternary Structure of the A2A-CB1-D2 Receptor Heteromer
Biochemical and biophysical studies have suggested that oligomerization of class A GPCRs primarily involves TM1, -4, and/or -5 (7, 9–15). Thus, the structure of the A2A-CB1-D2 receptor heteromer was modeled using the following dimeric interfaces: TM1-TM1, TM4-TM4invago, TM4-TM4ago, and TM5-TM5 (see under “Experimental Procedures”). TM4-TM4invago and TM4-TM4ago stand for the proposed rearrangement of the oligomerization interface that has been observed for the dopamine D2 receptor upon inverse agonist and agonist binding, respectively (12).
Modeling the CB1-D2 Receptor Heteromer
Initially, to discern which of these TM interfaces most favorably permits the proposed electrostatic interaction between phosphorylated Thr321(IL3)–Ser322(IL3) of CB1 and 266NRRRVEAARR275(IL3) of D2 in the CB1-D2 receptor heteromer, all possible dimeric interfaces were constructed (supplemental Fig. 1). It is important to acknowledge the difficulty of modeling IL3 of either CB1 or D2 receptors unambiguously (see under “Experimental Procedures”); thus, the exact location of these epitopes in IL3 cannot be determined. Nevertheless, it seems clear to us that the TM1-TM1, TM4-TM4invago, and TM4-TM4ago interfaces position IL3 of CB1 and D2 receptors in opposite sides of the TM bundles (supplemental Fig. 1, a–c), which makes the proposed electrostatic interaction difficult. In contrast, the TM5-TM5 interface places IL3 of the CB1 receptor contiguous to IL3 of the D2 receptor (supplemental Fig. 1d), facilitating their electrostatic interaction. It thus seems reasonable to propose that the Arg-rich epitope of the D2 receptor located in the cytoplasm at the end of TM5 is involved in CB1-D2 receptor heteromerization.
Modeling the A2A-CB1 Receptor Heteromer
The A2A-CB1 receptor heteromer was also modeled through the entire set of TM interfaces (supplemental Fig. 2) to reproduce the electrostatic interaction between phosphorylated Thr467–Ser468 in the CT of the CB1 receptor and Arg205(5.66)–Arg206(5.67) in the cytoplasm at the end of TM5 of the A2A receptor. CT of the CB1 receptor is made of 59 amino acids (Ser414–Leu472), in addition to the conserved Hx8 that runs parallel to the membrane (Ser401–Pro413). It is thus difficult to determine with precision the position of Thr467(CT)–Ser468(CT). However, although GPCRs CT vary greatly in length and sequence, we have assumed that the CT of CB1 unfolds toward TM6 as found in the crystal structure of squid rhodopsin (22). Taking these facts into account, TM4-TM4invago, TM4-TM4ago, and TM5-TM5 interfaces between CB1 and A2A receptors would allow the electrostatic interaction between Thr467(CT)–Ser468(CT) and Arg205(5.66)–Arg206(5.67) in the A2A receptor (supplemental Fig. 2, b–d), whereas the TM1-TM1 interface would not (supplemental Fig. 2a).
Modeling the A2A-CB1-D2 Receptor Heteromer
The quaternary structure of the A2A-CB1-D2 heteromer was finally obtained by combining the CB1-D2 (TM5-TM5 interface) and CB1-A2A (TM4-TM4invago) models described above (Fig. 8a). This combination of TM-TM interactions was selected among the others because it best reproduces the distance between GFP and YFP in the proposed A2A-CB1-D2 receptor heteromer within the 5.7–6.1-nm range experimentally determined from FRET efficiencies (see above). Fig. 8b shows a molecular model of the A2A-CB1-D2 heteromer, in which GFP was fused to Cys443(CT) of the D2 receptor at the end of the conserved Hx8; YFP was fused to Leu472(CT) of the CB1 receptor, only four amino acids apart from the phosphorylated Ser468(CT); and Thr467(CT)–Ser468(CT) of the CB1 receptor could interact with Arg205(5.66)–Arg206(5.67) of the A2A receptor. In addition, this computational model of the A2A-CB1-D2 receptor heteromer positioned the CT of the A2A receptor toward the D2 receptor epitope located in the cytoplasm at the end of TM5, so that phosphorylated Ser374(CT) can interact with the (5.64) 215VLRRRRKRVN224 epitope (Fig. 8, a and c).
FIGURE 8.

Molecular model of the A2A-CB1-D2 receptor heteromer. a, schematic model of the heteromerization of A2A (gold), CB1 (red), and D2 (cyan) receptors. Solid lines between TM5 and -6 symbolize IL3 of CB1 (red line, 29 amino acids long) or D2 (cyan line, 142 amino acids long) receptors, which were not modeled; solid lines after HX8 represent CT of CB1 (red line) or A2A (gold line), which were arbitrarily modeled as in squid rhodopsin; red spheres represent either phosphorylated Thr321(IL3)–Ser322(IL3) or Thr467(CT)–Ser468(CT) of CB1 or phosphorylated Ser374(CT) of A2A; and blue half-circles represent either Arg205(5.66)–Arg206(5.67) of A2A or the 215(5.64)VLRRRRKRVN224 or 266NRRRVEAARR275(IL3) epitopes of D2. b, lateral and cytoplasmic views of the computational model of the A2A-CB1-D2 receptor heteromer. GFP fused to Cys443(CT) of the D2 receptor (cyan surface) and YFP fused to Leu472(CT) of the CB1 receptor (red surface) are shown. IL3 of CB1 (red line) and D2 (cyan line) receptors are shown in solid lines to illustrate their proximity. c, cytoplasmic view of the computational model of the A2A-CB1-D2 receptor heteromer. CT of the CB1 receptor is depicted in the following manner: amino acids Ser414–Asn437 of (red tube ribbon) are modeled as in the crystal structure of squid rhodopsin, amino acids Asn437–Asp466 (not modeled) are shown as a red solid line to illustrate the position of Thr467–Ser468, and amino acids Ala469–Leu472 (red solid line) are arbitrarily modeled to position YFP. CT of the A2A receptor is depicted in the following manner: amino acids Ser305–Gly328 (golden tube ribbon) are modeled as in the crystal structure of squid rhodopsin; amino acids Ser329–Ser412 (not modeled) are shown as a yellow solid line, and phosphorylated Ser374 is shown as a red circle. Helices are shown as cylinders with the following color codes: TM4 in gray, TM5 in green, TM6 in blue, and the other helices in yellow for A2A, in red for CB1, and cyan for D2 receptors.
As shown above, expression of the CB1A467-A468-YFP or A2AA374-Rluc mutant receptors leads to a separation of the CT of CB1 from A2A and the CT of A2A from D2, respectively. This clearly suggests that phosphorylated Thr467(CT)–Ser468(CT) in CB1 or Ser374(CT) in A2A serves to maintain the large and flexible CT of the receptors in the proper conformation by interacting with the Arg-rich epitope of the corresponding promoter. It thus seems reasonable to suggest that the absence of Thr467(CT)–Ser468(CT) in CB1 or Ser374(CT) in A2A modifies the CT of the mutant receptors, whereas the packing of the TMs in the A2A-CB1-D2 heteromer remains similar.
Structure-Function Relationship in the A2A-CB1-D2 Receptor Heteromer
We explored the possibility that changes in the quaternary structure of A2A-CB1-D2 receptor heteromer after disruption of the electrostatic interactions could correlate with changes in the receptor heteromer function. We first looked for differences in signaling (activation of the MAPK pathway) in cells co-expressing A2A and D2 receptors in the absence and presence of CB1 receptors (Fig. 9). In cells co-expressing A2A and D2 receptors, co-activation of both receptors with their respective selective agonists CGS 21680 (200 nm) and quinpirole (1 μm) produced a similar degree of ERK1/2 phosphorylation than activation of either A2A or D2 receptors. As shown in Fig. 9a, the additional co-expression of CB1 receptor produced a qualitatively different pattern with a significantly higher effect of co-activation of A2A and D2 receptors compared with cells expressing only A2A and D2 receptors. We then demonstrated that this pattern of MAPK activation is a biochemical characteristic of the A2A-CB1-D2 receptor heteromer, because it depends on the integrity of its quaternary structure. In fact, we found that it particularly depends on the integrity of the intracellular electrostatic interactions that the CB1 receptor forms with the D2 receptor in A2A-CB1-D2 receptor heteromer. Thus, in cells expressing CB1A321-A321 or D2S receptors (which lose the ability to establish electrostatic interactions with the D2 or the CB1 receptors, respectively, in the A2A-CB1-D2 receptor heteromer), the pattern of MAPK activation was significantly altered and qualitatively similar to that observed in cells only co-expressing A2A and D2 receptors (Fig. 9b).
FIGURE 9.

Agonist-induced ERK1/2 phosphorylation by the A2A-D2-CB1 receptor heteromer. a and b, assays were performed 48 h post-transfection in cells expressing the indicated receptors (1.2 μg of cDNA of the A2A or the A2AA205-A206 receptors, 1 μg of cDNA of the D2, 0.8 μg of cDNA of the D2S receptor, and 1 μg of cDNA of the CB1, CB1A467-A468, or the CB1A321-A322 receptors). Cells were treated for 5 min with 200 nm CGS 21680 (CGS), 1 μm quinpirole (Quinp), or both (CGS+Quinp) and ERK1/2 phosphorylation was determined as indicated under “Experimental Procedures.” The immunoreactive bands from four experiments performed in duplicate were quantified, and the values represent the mean ± S.E. of % of phosphorylation relative to the basal levels found in untreated cells. c, assays were performed in striatal slices from wild-type (WT) or CB1 knock-out mice (CB1-KO). The slices were treated for 10 min with 1 μm CGS 21680 (CGS), 1 μm quinpirole (quinpirole) or both, and ERK1/2 phosphorylation was determined as indicated under “Experimental Procedures.” The immunoreactive bands from four to eight slices obtained from five to nine animals were quantified, and values represent the mean ± S.E. of the % of phosphorylation relative to basal levels found in untreated slices. Significant differences respect to the wild-type mice were calculated by bifactorial ANOVA followed by post hoc Bonferroni's tests (**, p < 0.01; ***, p < 0.001).
The pattern of MAPK activation could then be used as a biochemical fingerprint of the A2A-CB1-D2 receptor heteromer to detect its presence in the brain (3). In fact, comparing the pattern of ERK1/2 phosphorylation upon activation of A2A and D2 receptors in striatal slices from wild-type mice and CB1 receptor knock-out mice, we found the same qualitative differences as those observed in co-transfected cells with and without CB1 receptors (compare Fig. 8, a and c). Thus, in striatal slices from CB1 receptor knock-out mice, there was a significantly lower ERK1/2 phosphorylation upon co-activation of A2A and D2 receptors compared with that obtained from striatal slices from wild-type animals. A bifactorial ANOVA demonstrated a significant genotype effect (p < 0.05) and significant treatment/genotype interaction (p < 0.05), and post hoc Bonferroni tests only showed a significant difference between both groups when the striatal slices were co-treated with CGS 21680 (1 μm) and quinpirole (1 μm) (Fig. 9c).
DISCUSSION
This study shows, for the first time, that GPCR heteromers display emerging properties that depend on their folding into a certain quaternary structure, determined not only by interactions between TM domains but also involving interactions between hydrophilic intracellular domains. Significantly, we have found that each receptor, A2A, CB1, and D2, contains two key intracellular domains to interact in a selective manner with intracellular domains of the other two receptors by means of electrostatic interactions in the formation of the quaternary structure of the A2A-D2, A2A-CB1, CB1-D2, and A1-CB1-D2 receptor heteromers. Thus, the D2 receptor contains two Arg-rich epitopes, 215VLRRRRKRVN224 and 266NRRRVEAARR275, that interact with potential CK1/2-dependent phosphorylatable Ser/Thr residues in CT (Ser374) of the A2A receptor and in IL3 (Thr321–Ser322) of the CB1 receptor, respectively; CB1 receptor contains adjacent phosphorylatable Ser and Thr residues in IL3 (Thr321 and Ser322) and the CT (Thr467 and Ser468) that interact with Arg residues in IL3 (266NRRRVEAARR275) of the D2 receptor and Arg205–Arg206 of the A2A receptor, respectively; and the A2A receptor contains Arg residues at the end of TM5 in the cytoplasm at Arg205–Arg206 and a phosphorylatable Ser residue in the CT (Ser374), which interact with phosphorylatable Ser/Thr residues in the CB1 receptor CT (Thr467 and Ser468) and an Arg-rich epitope of the D2 receptor located in the cytoplasm at the end of TM5 (215VLRRRRKRVN224), respectively. The fact that each of these three receptors forms electrostatic interactions involving evolutionarily conserved adjacent Arg residues and CK1/2-dependent phosphorylatable Ser and Thr residues with the other two receptors suggests that these particular electrostatic interactions constitute a general mechanism for receptor heteromerization. In studies using synthetic peptides, it has been shown that these electrostatic interactions are particularly stable. Thus, the Arg-phosphate interaction is so stable that when using collision-induced dissociation, the noncovalent interactions between the Arg guanidinium groups and the phosphate group remain intact even though the covalent bond between the serine and phosphate breaks (16, 31–33).
Using bioluminescence resonance energy transfer techniques with mutant receptors, we propose for the first time the quaternary structure for three interacting GPCRs. Characterization of protomer organization within the A1-CB1-D2 receptor heteromer requires, in addition to our findings, integration of information from a variety of different approaches. Most compelling are studies that apply disulfide cross-linking to map TM interfaces between protomers (10, 12, 13). Modeling of the CB1-D2, A2A-CB1, and A2A-D2 receptor heterodimers was performed through the entire set of proposed TM interfaces (i.e. TM1, TM4, or TM5). Our results are compatible with models proposed for other family A GPCRs, where oligomerization involves primarily TM4 and TM5 interfaces (Fig. 8). Thus, our study supports a triangular rather than a linear arrangement of receptors in the A2A-CB1-D2 heteromer. This arrangement allows the possibility of simultaneous homodimerization of each receptor unit using the TM1 interface, which is a well established phenomenon in the GPCR field. Thus, this study opens up a new conceptual challenge in the field of receptor heteromerization, which is the idea that GPCRs can form not only heteromultimers of three different receptor units but also higher order heteromultimers or “receptor nets.”
The interactions of the intracellular domains of the CB1 receptor with A2A and D2 receptors were found to be fundamental for the correct formation of the quaternary structure needed for the function of the A2A-CB1-D2 receptor heteromers. Thus, mutant receptors lacking the interacting amino acids significantly disrupted RET and a specific qualitative pattern of ERK1/2 phosphorylation induced by co-activation of A2A and D2 receptors. The fact that such a disruption of the quaternary structure of the A2A-CB1-D2 receptor heteromer (as demonstrated by SRET experiments) was associated with a significant qualitative change in signaling indicates that electrostatic interactions between intracellular domains are also key determinants for the specific biochemical properties of the A2A-CB1-D2 receptor heteromer. These biochemical characteristics and the specific qualitative pattern of MAPK activation could be used as a biochemical fingerprint of the A2A-CB1-D2 receptor heteromer presence in the brain. CB1 receptor KO mice experiments provided strong support for the existence of A2A-CB1-D2 receptor heteromer in the striatum. It has been hypothesized that A2A-CB1-D2 receptor heteromers are mostly located in one subtype of striatal neuron, the GABAergic enkephalinergic neuron, where the three receptors are highly co-expressed and exert a significant control of basal ganglia function (34). Most probably, the results obtained with MAPK signaling are just a minor but the first described example of many of the potential properties of the A2A-CB1-D2 receptor heteromers.
Supplementary Material
Acknowledgments
We thank Prof. Olga Valverde and Prof. Catherine Ledent (Department of Experimental and Health Sciences, Biomedical Research Park, Barcelona University Pompeu Fabra, Barcelona, Spain) for generously supplying wild-type and CB1 receptor KO mice. We thank the Office of National Drug Control Policy and Jodie Franklin (The Johns Hopkins Synthesis and Sequencing Facility) for the peptide synthesis. We acknowledge the technical help obtained from Jasmina Jiménez (Molecular Neurobiology Laboratory, Barcelona University).
This work was supported, in whole or in part, by a National Institutes of Health grant from intramural funds to NIDA. This work was also supported by Spanish Ministerio de Ciencia y Tecnología Grants SAF2008-00146, SAF2006-05481, and SAF2008-03229-E/ for ERA-NET Coordination of Research Activities and Instituto de Salud Carlos III (RD07/0067/0008) Grant 060110 from Fundació La Marató de TV3.

The on-line version of this article (available at http://www.jbc.org) contains supplemental Figs. 1 and 2 and Table 1.
- GPCR
- G protein-coupled receptor
- SRET
- sequential resonance energy transfer
- ANOVA
- analysis of variance
- PDB
- Protein Data Bank
- BRET
- bioluminescence resonance energy transfer
- TM
- transmembrane
- IL3
- intracellular loop 3.
REFERENCES
- 1.Ferré S., Ciruela F., Woods A. S., Lluis C., Franco R. (2007) Trends Neurosci. 30, 440–446 [DOI] [PubMed] [Google Scholar]
- 2.Pin J. P., Neubig R., Bouvier M., Devi L., Filizola M., Javitch J. A., Lohse M. J., Milligan G., Palczewski K., Parmentier M., Spedding M. (2007) Pharmacol. Rev. 59, 5–13 [DOI] [PubMed] [Google Scholar]
- 3.Ferré S., Baler R., Bouvier M., Caron M. G., Devi L. A., Durroux T., Fuxe K., George S. R., Javitch J. A., Lohse M. J., Mackie K., Milligan G., Pfleger K. D., Pin J. P., Volkow N. D., Waldhoer M., Woods A. S., Franco R. (2009) Nat. Chem. Biol. 5, 131–134 [DOI] [PMC free article] [PubMed] [Google Scholar]
- 4.Dalrymple M. B., Pfleger K. D., Eidne K. A. (2008) Pharmacol. Ther. 118, 359–371 [DOI] [PubMed] [Google Scholar]
- 5.Carriba P., Navarro G., Ciruela F., Ferré S., Casadó V., Agnati L., Cortés A., Mallol J., Fuxe K., Canela E. I., Lluís C., Franco R. (2008) Nat. Methods 5, 727–733 [DOI] [PubMed] [Google Scholar]
- 6.Gandia J., Galino J., Amaral O. B., Soriano A., Lluís C., Franco R., Ciruela F. (2008) FEBS Lett. 582, 2979–2984 [DOI] [PubMed] [Google Scholar]
- 7.Davies A., Gowen B. E., Krebs A. M., Schertler G. F., Saibil H. R. (2001) J. Mol. Biol. 314, 455–463 [DOI] [PubMed] [Google Scholar]
- 8.Maurel D., Comps-Agrar L., Brock C., Rives M. L., Bourrier E., Ayoub M. A., Bazin H., Tinel N., Durroux T., Prézeau L., Trinquet E., Pin J. P. (2008) Nat. Methods 5, 561–567 [DOI] [PMC free article] [PubMed] [Google Scholar]
- 9.Fotiadis D., Liang Y., Filipek S., Saperstein D. A., Engel A., Palczewski K. (2003) Nature 421, 127–128 [DOI] [PubMed] [Google Scholar]
- 10.Klco J. M., Lassere T. B., Baranski T. J. (2003) J. Biol. Chem. 278, 35345–35353 [DOI] [PubMed] [Google Scholar]
- 11.Liang Y., Fotiadis D., Filipek S., Saperstein D. A., Palczewski K., Engel A. (2003) J. Biol. Chem. 278, 21655–21662 [DOI] [PMC free article] [PubMed] [Google Scholar]
- 12.Guo W., Shi L., Filizola M., Weinstein H., Javitch J. A. (2005) Proc. Natl. Acad. Sci. U.S.A. 102, 17495–17500 [DOI] [PMC free article] [PubMed] [Google Scholar]
- 13.Guo W., Urizar E., Kralikova M., Mobarec J. C., Shi L., Filizola M., Javitch J. A. (2008) EMBO J. 27, 2293–2304 [DOI] [PMC free article] [PubMed] [Google Scholar]
- 14.González-Maeso J., Ang R. L., Yuen T., Chan P., Weisstaub N. V., López-Giménez J. F., Zhou M., Okawa Y., Callado L. F., Milligan G., Gingrich J. A., Filizola M., Meana J. J., Sealfon S. C. (2008) Nature 452, 93–97 [DOI] [PMC free article] [PubMed] [Google Scholar]
- 15.Han Y., Moreira I. S., Urizar E., Weinstein H., Javitch J. A. (2009) Nat. Chem. Biol. 5, 688–695 [DOI] [PMC free article] [PubMed] [Google Scholar]
- 16.Woods A. S., Ferré S. (2005) J. Proteome Res. 4, 1397–1402 [DOI] [PMC free article] [PubMed] [Google Scholar]
- 17.Zimmermann T., Rietdorf J., Girod A., Georget V., Pepperkok R. (2002) FEBS Lett. 531, 245–249 [DOI] [PubMed] [Google Scholar]
- 18.Ledent C., Valverde O., Cossu G., Petitet F., Aubert J. F., Beslot F., Böhme G. A., Imperato A., Pedrazzini T., Roques B. P., Vassart G., Fratta W., Parmentier M. (1999) Science 283, 401–404 [DOI] [PubMed] [Google Scholar]
- 19.Aso E., Ozaita A., Valdizán E. M., Ledent C., Pazos A., Maldonado R., Valverde O. (2008) J. Neurochem. 105, 565–572 [DOI] [PubMed] [Google Scholar]
- 20.Jaakola V. P., Griffith M. T., Hanson M. A., Cherezov V., Chien E. Y., Lane J. R., Ijzerman A. P., Stevens R. C. (2008) Science 322, 1211–1217 [DOI] [PMC free article] [PubMed] [Google Scholar]
- 21.Cherezov V., Rosenbaum D. M., Hanson M. A., Rasmussen S. G., Thian F. S., Kobilka T. S., Choi H. J., Kuhn P., Weis W. I., Kobilka B. K., Stevens R. C. (2007) Science 318, 1258–1265 [DOI] [PMC free article] [PubMed] [Google Scholar]
- 22.Rasmussen S. G., Choi H. J., Rosenbaum D. M., Kobilka T. S., Thian F. S., Edwards P. C., Burghammer M., Ratnala V. R., Sanishvili R., Fischetti R. F., Schertler G. F., Weis W. I., Kobilka B. K. (2007) Nature 450, 383–387 [DOI] [PubMed] [Google Scholar]
- 23.Ballesteros J. A., Weinstein H. (1995) in Methods in Neurosciences, Vol. 25, pp. 366–428, Elsevier, San Diego, CA [Google Scholar]
- 24.Park J. H., Scheerer P., Hofmann K. P., Choe H. W., Ernst O. P. (2008) Nature 454, 183–187 [DOI] [PubMed] [Google Scholar]
- 25.Murakami M., Kouyama T. (2008) Nature 453, 363–367 [DOI] [PubMed] [Google Scholar]
- 26.Li J., Edwards P. C., Burghammer M., Villa C., Schertler G. F. (2004) J. Mol. Biol. 343, 1409–1438 [DOI] [PubMed] [Google Scholar]
- 27.Blom N., Gammeltoft S., Brunak S. (1999) J. Mol. Biol. 294, 1351–1362 [DOI] [PubMed] [Google Scholar]
- 28.Ciruela F., Burgueño J., Casadó V., Canals M., Marcellino D., Goldberg S. R., Bader M., Fuxe K., Agnati L. F., Lluis C., Franco R., Ferré S., Woods A. S. (2004) Anal. Chem. 76, 5354–5363 [DOI] [PubMed] [Google Scholar]
- 29.Azdad K., Gall D., Woods A. S., Ledent C., Ferré S., Schiffmann S. N. (2009) Neuropsychopharmacology 34, 972–986 [DOI] [PMC free article] [PubMed] [Google Scholar]
- 30.Missale C., Nash S. R., Robinson S. W., Jaber M., Caron M. G. (1998) Physiol. Rev. 78, 189–225 [DOI] [PubMed] [Google Scholar]
- 31.Jackson S. N., Wang H. Y., Woods A. S. (2005) J. Proteome Res. 4, 2360–2363 [DOI] [PubMed] [Google Scholar]
- 32.Jackson S. N., Moyer S. C., Woods A. S. (2008) J. Am. Soc. Mass Spectrom. 19, 1535–1541 [DOI] [PMC free article] [PubMed] [Google Scholar]
- 33.Jackson S. N., Wang H. Y., Yergey A., Woods A. S. (2006) J. Proteome Res. 5, 122–126 [DOI] [PMC free article] [PubMed] [Google Scholar]
- 34.Ferré S., Goldberg S. R., Lluis C., Franco R. (2009) Neuropharmacology 56, Suppl. 1, 226–234 [DOI] [PMC free article] [PubMed] [Google Scholar]
Associated Data
This section collects any data citations, data availability statements, or supplementary materials included in this article.