

Abstract
ATP-citrate lyase (ACLY) catalyzes the conversion of citrate and CoA into acetyl-CoA and oxaloacetate, coupled with the hydrolysis of ATP. In humans, ACLY is the cytoplasmic enzyme linking energy metabolism from carbohydrates to the production of fatty acids. In situ proteolysis of full-length human ACLY gave crystals of a truncated form, revealing the conformations of residues 2–425, 487–750, and 767–820 of the 1101-amino acid protein. Residues 2–425 form three domains homologous to the β-subunit of succinyl-CoA synthetase (SCS), while residues 487–820 form two domains homologous to the α-subunit of SCS. The crystals were grown in the presence of tartrate or the substrate, citrate, and the structure revealed the citrate-binding site. A loop formed by residues 343–348 interacts via specific hydrogen bonds with the hydroxyl and carboxyl groups on the prochiral center of citrate. Arg-379 forms a salt bridge with the pro-R carboxylate of citrate. The pro-S carboxylate is free to react, providing insight into the stereospecificity of ACLY. Because this is the first structure of any member of the acyl-CoA synthetase (NDP-forming) superfamily in complex with its organic acid substrate, locating the citrate-binding site is significant for understanding the catalytic mechanism of each member, including the prototype SCS. Comparison of the CoA-binding site of SCSs with the similar structure in ACLY showed that ACLY possesses a different CoA-binding site. Comparisons of the nucleotide-binding site of SCSs with the similar structure in ACLY indicates that this is the ATP-binding site of ACLY.
Keywords: Diseases/Obesity, Enzymes/Catalysis, Enzymes/Inhibitors, Enzymes/Mechanisms, Metabolism/Energy, Methods/X-ray Crystallography
Introduction
ATP-citrate lyase (ACLY, EC 2.3.3.8)3 catalyzes the reaction, citrate + CoA + ATP → acetyl-CoA + oxaloacetate + ADP + Pi, in the presence of magnesium ions (1). ACLY is the cytoplasmic enzyme linking energy metabolism from carbohydrates to the production of fatty acids. Acetyl-CoA produced in the mitochondria cannot be exported to the cytoplasm. Instead, acetyl-CoA in mitochondria is transformed to citrate by citrate synthase, and citrate is exported to the cytoplasm where ACLY regenerates acetyl-CoA. This acetyl-CoA is an important precursor for fatty acid synthesis. In addition, ACLY has been shown to signal the metabolic state of cells, likely by providing acetyl-CoA for histone acetyltransferases in the cells' nuclei (2). The physiological importance of the enzyme is supported by knock-out experiments in which mice embryos lacking ATP-citrate lyase could not be obtained (3).
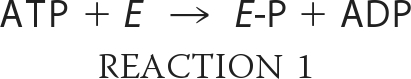
Our understanding of the reaction mechanism of ACLY has been based on studies of this enzyme and of two enzymes with sequence similarity to ACLY. The first is succinyl-CoA synthetase (SCS), which catalyzes the formation of succinyl-CoA from succinate and CoA using ATP (4). The second is citrate synthase, the enzyme that generates citrate from acetyl-CoA and oxaloacetate in mitochondria. The reaction catalyzed by ACLY is thought to occur in four steps (Reactions 1–4):
 |
 |
 |
where E represents ACLY. Like SCS, ACLY is phosphorylated by ATP on an active site histidine residue to give E-P in step 1 (Reaction 1) (5, 6). The phosphoryl group is transferred to citrate in step 2 (Reaction 2). Citryl-phosphate is thought to remain bound to the enzyme, symbolized by E·citryl-P. Phosphate is released in the attack by CoA to form the citryl-CoA thioester bond in step 3 (Reaction 3) (7). In the last step (Reaction 4), citryl-CoA is cleaved to give acetyl-CoA and oxaloacetate, the reverse reaction to that catalyzed by citrate synthase.
ACLY, like SCS, is a member of the acyl-CoA synthetase (NDP-forming) superfamily (8). There are five domains common to all members of this superfamily (see Fig. 1). The domains are numbered according to their order in Escherichia coli SCS, because this enzyme was the first member of the superfamily to have its structure determined using x-ray crystallography (9). As depicted in Fig. 1, domains 1 and 2 occur in the α-subunit of E. coli SCS. Domain 1 binds CoA and domain 2 contains the phosphorylated histidine residue. Domains 3–5 occur in the β-subunit of E. coli SCS. Domains 3 and 4 adopt an ATP-grasp fold (10) and bind nucleotide (11, 12). Domain 5 interacts with domain 2, providing one of the two “power helices” at whose N termini the phosphohistidine residue is bound in structures of the phosphorylated protein (9, 13, 14). Isoform 1 of human ACLY is an 1101-residue protein (15) with all five domains in the N-terminal portion of a single polypeptide chain. The order of the domains is 3, 4, 5, 1, and 2 (Fig. 1). Between domains 5 and 1 lies a stretch of residues that can be phosphorylated on three serine or threonine residues (16–18). The second isoform of human ACLY is 10 residues shorter in this region. The C-terminal portion of ACLY shows sequence similarity to the large domain of citrate synthase (19).
FIGURE 1.

Domain arrangements in members of the acyl-CoA synthetase (NDP-forming) superfamily.
The crystal structure of ACLY is as yet unknown and would be important for the design of enzyme inhibitors. ACLY has been suggested as a drug target in the treatment of excess cholesterol and fat, because it is upstream of the production of both cholesterol and fatty acids (20, 21). The enzyme has also been suggested as a drug target for cancer, because cancer cells rely to a large extent on glucose both as their energy source and for the de novo synthesis of fatty acids (22–25). As a step in obtaining the crystal structure of full-length ACLY, we crystallized a truncated form that contains residues from domains 1–5. The crystals were grown in the presence of tartrate or citrate and reveal both the structure of two-thirds of ACLY and the binding site of the substrate citrate.
MATERIALS AND METHODS
Cloning, Production, and Purification of Human ACLY
For production of human ACLY (hACLY) in E. coli, the gene was inserted in the pET-42b(+) vector (Novagen®). The gene was obtained from the Mammalian Gene Collection of ATCC® as MGC-1812. The pET-42b(+) vector would add a C-terminal His8 tag to simplify purification. A C-terminal tag was chosen, because a previous attempt using an N-terminal His8 tag for purification of hACLY was unsuccessful (26). This was probably because the N terminus of the protein is likely to be buried, as is the N terminus of the β-subunit of SCS. Oligonucleotides KB2.1 5′-CTCTCTCTGCACATATGTCGGCCAAGG-3′ and KB2.2 5′-GCTAAGCTTCATGCTCATGTGTTCCGGAAGAACGTATG-3′ were the forward and reverse primers used to clone the gene. KB2.1 added an NdeI cleavage site (highlighted in bold), whereas KB2.2 was designed to add a HindIII cleavage site (highlighted in bold) and remove an NdeI cleavage site near the 3′-end of the gene. The gene was amplified using these primers and the Platinum® Pfx DNA polymerase (Invitrogen) with an annealing temperature of 57 °C and an extension temperature of 67 °C. The PCR product was purified using a 1% agarose gel and the QIAquick Gel Extraction Kit. NdeI and HindIII were used to cleave both the PCR product and the vector, which was subsequently purified to remove the smaller fragment. The PCR product and vector were ligated using T4 DNA ligase. Inoue-competent (27) E. coli DH5α cells were transformed with the ligation mixture, and five colonies were tested for the presence of insert using restriction enzyme digests. Two of the five were positive, and their plasmid DNA was sequenced and transformed into the E. coli strain, BL21(DE3). Sequencing confirmed the presence of the gene, but showed that it still contained the NdeI restriction enzyme site near the 3′-end. Once inserted in the vector, the gene for hACLY had an additional 45 bases coding for the residues KLAAALEH8 at the C terminus of the protein.
A previous work where hACLY was overproduced in E. coli had shown that the protein was insoluble unless coproduced with the molecular chaperone, GroEL/ES (26). 1 liter of Luria-Bertani (LB) broth containing 25 mg/liter kanamycin and 35 mg/liter chloramphenicol was inoculated with 5 ml of an overnight culture of BL21(DE3) containing plasmids with the genes for hACLY, pET-42b(+)hACLY (kanamycin resistance), and GroEL/ES (chloramphenicol resistance). The culture was grown at 310 K to an optical density at 600 nm (A600 nm) of 0.6, and then the temperature was dropped to 291 K, and protein production was induced with 0.1 mm isopropyl-β-d-thiogalactopyranoside. After 4–10 h at 291 K, the cells were harvested by centrifugation for 15 min at 5000 rpm in a Sorvall SLA-3000 rotor. Cells were stored at 193 K in lysis buffer containing 0.1 m KH2PO4, 0.1 m KCl, 1 mm disodium EDTA, 1% glycerol, 10 mm 2-mercaptoethanol, 1 mm benzamidine, 0.1 mm PMSF, and 0.05 m Tris-HCl (pH 7.4).
When hACLY was to be purified, the stored cells were thawed on ice and lysed by sonication. The soluble fraction was separated by centrifugation at 15,000 rpm in a Sorvall SS34 rotor at 277 K for 30 min. hACLY in the soluble fraction was precipitated with 20% ammonium sulfate and collected by centrifugation. The pellet was dissolved in a minimal volume of desalting buffer containing 10 mm sodium citrate, 10 mm 2-mercaptoethanol, 10% glycerol, 1 mm benzamidine, 10 mm Tris-HCl, pH 8.0, and desalted on a Sephadex G-25 column. The sample was loaded on a nickel-nitrilotriacetic acid-agarose (Qiagen) column and eluted with 150 mm imidazole. The final column was a DEAE-Sephacel column equilibrated with the desalting buffer. The protein was loaded on the column, and then eluted with a linear gradient of 0–0.5 m NaCl in desalting buffer. 9% SDS-PAGE gels were used to select fractions to be concentrated for crystallization trials. The protein was concentrated to 10 mg/ml and quick frozen in 20-μl aliquots in thin-walled PCR tubes (28).
Crystallization
Crystallization trials were begun with the purified protein, but cleavage products interfered with the experiments. To crystallize a stable cleavage product, chymotrypsin was added to the protein solution, and the protein solution was immediately used in crystallization trials (29). The crystals were grown in hanging drops by vapor diffusion after mixing 0.5 μl of the protein solution with 0.5 μl of the precipitant solution. The concentration of hACLY at which the crystals grew best was 5 mg/ml. The precipitant solution that gave good microcrystals consisted of 12.5% (w/v) PEG 3350, 100 mm sodium tartrate, 100 mm Tris-HCl (pH 7.0). Macroseeding using a precipitant solution containing 10% (w/v) PEG 3350, 100 mm sodium tartrate, 100 mm Tris-HCl (pH 7.1) gave crystals large enough for x-ray diffraction experiments.
Peptide Mass Spectrometry
Peptide mass fingerprinting was used to confirm that the crystals contained fragments of hACLY. Small crystals were collected and washed with precipitant solution. The crystals were dissolved in SDS-PAGE loading buffer and run on a 9% gel. Two bands were excised from the gel and submitted to the Southern Alberta Mass Spectrometry Centre for peptide mass fingerprinting. The polypeptides extracted from the gel were digested using trypsin and subjected to matrix-assisted laser desorption/ionization time-of-flight (MALDI-TOF) mass spectrometry. The spectra were used to identify the sequences of the peptides by comparing the masses obtained experimentally to the theoretical masses calculated for trypsin-cleaved proteins (30).
Production, Purification, and Crystallization of the Selenomethionyl Protein
To determine whether the truncated version of selenomethionyl hACLY could also be crystallized, full-length selenomethionyl protein was produced and purified. The protein was produced in the same way that selenomethionyl human succinyl-CoA:3-ketoacid CoA transferase had been produced (31), using the method of Doublié to inhibit the production of methionine and incorporate selenomethionine (32). The only differences from the purification of native hACLY were that the buffers were degassed and the samples were stored under argon to minimize oxidization of the selenomethionine residues. Prior to setting up the crystallization trials, the selenomethionyl protein at a concentration of 5 mg/ml was mixed with chymotrypsin. 0.5 μl of the protein solution was added to 0.5 μl of the precipitant solution to form the hanging drop. The precipitant solution used to grow crystals contained 10% PEG 3350, 75 mm potassium citrate, 100 mm Tris-HCl (pH 7.0).
X-ray Diffraction Analysis
X-ray diffraction data were collected at two synchrotrons. The native data were collected at beamline 8.3.1 of the Advanced Light Source, Berkeley, CA using an ADSC Quantum 315r charge-coupled device detector. Data from crystals of the selenomethionyl protein were collected at the PX beamline of the Canadian Light Source, Saskatoon, SK using a Rayonix MX225 charge-coupled device detector. Prior to the data collection, crystals of the native protein were cryoprotected in solution containing 10% (v/v) glycerol, 15% (w/v) PEG 3350, 100 mm sodium tartrate, and 100 mm Tris-HCl (pH 7.2). Crystals of the selenomethionyl protein were cryoprotected in 10% (v/v) glycerol, 15% (w/v) PEG 3350, 100 mm Tris-HCl (pH 7.0), and 75 mm potassium citrate. The crystals were vitrified in the cold stream of gaseous nitrogen at 100 K and shipped to the synchrotron at low temperature. The x-ray diffraction data collected at the synchrotrons were processed using the ELVES scripts (33) and MOSFLM (34), as well as programs from the CCP4 package (35). Matthews probabilities (36) were calculated using a web applet (37).
For phasing, the best results were obtained using the single-wavelength anomalous dispersion data set collected at the peak wavelength, 0.98055 Å, and processed to 2.5 Å-resolution. The phase problem was solved using the program PHENIX (38) by locating 16 selenium atoms using phases from molecular replacement, then using these selenium sites to determine phases for the protein. The model used for the molecular replacement (39) was the α-subunit of E. coli SCS (12), identified as 1CQI in the Protein Data Bank (40). The initial partial model for the selenomethionyl protein built by PHENIX was rebuilt using the program COOT (41). The quality of the model was judged using the programs PROCHECK (42) and MOLPROBITY (43) and the validation tools in COOT. After each round of rebuilding using COOT, the model was submitted to PHENIX for refinement. Citrate and water molecules were also fitted into the electron density. At this point, the x-ray diffraction data were reprocessed to 2.1 Å-resolution, the diffraction limit for this crystal, and the refinement was completed.
To determine the structure of tartrate bound to truncated hACLY, the model of the selenomethionyl protein was modified to describe the native protein without citrate, and this model was refined against the native data. Tartrate was fitted into the electron density in the same region as the citrate-binding site. Programs from the CCP4 package (35) as well as COOT (41), SPDBV (44), and O (45) were used to analyze the resulting models.
Inhibition of Human ACLY by Tartrate
To test whether the enzyme activity of hACLY is inhibited by tartrate, cell lysate containing full-length hACLY was assayed in the presence of 0, 30, and 60 mm sodium tartrate. The kinetics assay is a coupled enzyme assay using malate dehydrogenase and NADH to reduce oxaloacetate. The loss of NADH is measured spectrophotometrically (46). All reaction mixtures contained 0.2 mm CoA, 10 mm ATP, 10 mm MgCl2, 4 mm DTT, 0.2 mm NADH, 3.5 units/ml malate dehydrogenase, and 20 mm Tris-HCl (pH 8.4). The concentration of potassium citrate varied from 0.05 to 5 mm, and the reactions were performed in triplicate at 310 K. The low background activity measured using cell lysate that did not contain hACLY was subtracted from each measured initial velocity. Plots of the corrected initial velocities versus citrate concentrations were analyzed using nonlinear regression in the program PRISM 5 (GraphPad Software, Inc.) to determine V and apparent Km values for citrate at the different tartrate concentrations. These values were used to draw double reciprocal plots. Ki for tartrate was determined by linear regression from the plot of apparent Km values at different tartrate concentrations.
Cloning, Production, and Purification of the 817 N-terminal Residues of Human ACLY
The gene for hACLY was truncated to produce the 817 N-terminal residues, because this was approximately the limit seen in the crystal structure. In the pET42b(+)hACLY plasmid, a unique EagI restriction site lies upstream of the sequence coding for the His8 tag. A second EagI site was inserted after the region coding for the 817 N-terminal residues using the QuikChange® II XL site-directed mutagenesis kit (Stratagene) and oligonucleotides TS3.1 5′-AGGAGGTGCCGGCCGCAACCGTGCCC-3′ and TS3.2 5′-GGGCACGGTTGCGGCCGGCACCTCCT-3′. Digestion of the mutated plasmid with EagI and re-ligation generated the plasmid pET42b(+)N′hACLY, which codes for the 817 N-terminal residues of hACLY followed by AALEH8, referred to as N-terminal hACLY. The sequence of the gene was confirmed by DNA sequencing.
For protein production, the pET42b(+)N′hACLY plasmid was transformed into E. coli BL21(DE3). 1 liter of LB broth containing 30 mg/liter kanamycin was inoculated with 20 ml of an overnight culture of BL21(DE3) containing the pET42b(+)N′hACLY plasmid. The culture was grown at 310 K to an A600 nm of 0.6, the temperature was then dropped to 291 K, and isopropyl-β-d-thiogalactopyranoside was added to a concentration of 0.5 mm to induce protein production. After 18 h, cells were harvested by centrifugation and lysed by sonication in buffer containing 50 mm KCl, 10 mm MgCl2, 10 mm sodium citrate, 1% glycerol, 10 mm 2-mercaptoethanol, 1 mm benzamidine, and 10 mm potassium phosphate (pH 7.5). The soluble fraction was loaded onto a nickel-nitrilotriacetic acid-agarose (Qiagen) column and eluted with 200 mm imidazole, 0.3 m NaCl, 10 mm MgCl2, 10 mm sodium citrate, 1% glycerol, 10 mm 2-mercaptoethanol, 1 mm benzamidine, and 50 mm potassium phosphate (pH 7.5). The eluate was dialyzed against buffer containing 10 mm MgCl2, 10 mm sodium citrate, 1% glycerol, 10 mm 2-mercaptoethanol, 1 mm benzamidine, and 6 mm potassium phosphate (pH 7.5) then loaded onto a Q-SepharoseTM Fast Flow (Amersham Biosciences) column previously equilibrated with the same buffer solution. The protein was eluted with a linear gradient of 0–0.75 m NaCl in the same buffer solution. SDS-PAGE was used to detect fractions containing N-terminal hACLY and to judge protein purity.
ITC
Isothermal titration calorimetry (ITC) was used to detect the binding of CoA to hACLY and to N-terminal hACLY. The protein samples were concentrated and dialyzed against buffer solution containing 10 mm MgCl2, 10 mm sodium citrate, 1% glycerol, 8 mm 2-mercaptoethanol, 1 mm benzamidine, and 10 mm potassium phosphate (pH 7.5), then centrifuged to remove any aggregates. Protein concentrations were measured using the Bradford assay. A 20 mm stock solution of CoA was prepared and diluted to 1 mm in the dialysis solution. Measurements were performed on a VP-ITC isothermal titration calorimeter (MicroCal) at 298 K. 0.014 mm hACLY (measured as the concentration of tetramers) was loaded into the cell for the detection of the binding of CoA to hACLY, whereas 0.056 mm N-terminal hACLY was used for the detection of the binding of CoA to N-terminal hACLY so that the concentration of active sites would be identical. Each titration consisted of a single 2-μl injection of 1 mm CoA followed by 24 8-μl injections at 5-min intervals. Titrations of 1 mm CoA into buffer were also performed to subtract the heat of dilution. The data were analyzed using ORIGIN 7 (OriginLab).
RESULTS
Crystals of chymotrypsin-truncated hACLY contained two polypeptide chains, as shown by SDS-PAGE (supplemental Fig. S1). The approximate relative molecular weights of the two polypeptides were 50 and 35 kDa. Peptide mass fingerprinting identified 10 peptides in the 50-kDa band and 12 in the 35-kDa band that matched (with differences of 1–22 ppm) peptides predicted to be cleaved from hACLY, confirming that the crystals contained truncated hACLY. An 11th peptide from the 50-kDa band showed a difference of 33 ppm, an error higher than is generally acceptable in this type of experiment (47), so it was not considered to be a match. Supplemental Table S1 lists the molecular weights and sequences of these peptides, as well as the residue ranges matched in hACLY. The peptide not considered to be a good match for the 50-kDa band is the final peptide, residues 470–488 of hACLY. This meant that the residue range from 34 to 389 was identified as belonging to the 50-kDa band, and the residue range from 499 to 703 was identified as belonging to the 35-kDa band.
The first structure of truncated hACLY was determined using x-ray diffraction data from a single crystal of the selenomethionyl protein measured at the peak wavelength. The statistics for this data set, processed first to 2.5-Å resolution and later to 2.1 Å, are presented in Table 1 along with statistics for the data set collected from the native crystal that diffracted to 2.2-Å resolution. 656 residues were automatically fitted into the 2.5-Å resolution electron density map, although many of these residues were not correctly identified. After rounds of rebuilding and refinement, the model included three polypeptide chains consisting of residues 2–425, 487–750, and 767–820 (Fig. 2A). In addition to the protein, the substrate citrate was fitted into the electron density calculated using data from the crystal of the selenomethionyl protein, whereas tartrate was fitted into the electron density calculated using data from the crystal of the native protein. The final models refined against the x-ray diffraction data to 2.1- and 2.2-Å resolution give the statistics that are presented in Table 2. These models and the structure factors have been deposited to the Protein Data Bank (PDB) (40) where they have been assigned PDB codes 3MWD and 3MWE.
TABLE 1.
Statistics for the x-ray diffraction data sets
| Structure | Truncated Se-Met hACLY complex with citrate | Truncated Se-Met hACLY complex with citrate | Truncated hACLY complex with tartrate |
|---|---|---|---|
| X-ray source | CLS PX | CLS PX | ALS 8.3.1 |
| Wavelength (Å) | 0.98055 | 0.98055 | 1.11587 |
| Space group | C2 | C2 | C2 |
| Cell dimensions | a = 169.20 Å | a = 169.20 Å | a = 168.19 Å |
| b = 61.71 Å | b = 61.70 Å | b = 60.79 Å | |
| c = 109.43 Å | c = 109.42 Å | c = 109.18 Å | |
| α = γ = 90° | α = γ = 90° | α = γ = 90° | |
| β = 125.0° | β = 125.0° | β = 125.0° | |
| Resolution range (Å) (high resolution) | 39.90–2.50 (2.64–2.50) | 89.64–2.10 (2.21–2.10) | 55.64–2.20 (2.32–2.20) |
| Rmergea (%) (high resolution) | 7.7 (17.5) | 9.5 (46.1) | 7.9 (45.0) |
| 〈I/σ(I)〉b (high resolution) | 10.8 (5.7) | 8.1 (2.7) | 9.2 (2.4) |
| Number of unique observations (high resolution) | 32,300 (4,666) | 54,277 (7,896) | 45,944 (6,676) |
| Average redundancy (high resolution) | 3.8 (3.8) | 3.8 (3.8) | 2.8 (2.8) |
| Completeness (%) (high resolution) | 100.0 (100.0) | 100.0 (100.0) | 99.4 (99.7) |
a Rmerge = (ΣhΣi|Ihi − 〈Ih〉|)/ΣhΣi〈Ih〉, where Ihi is the intensity of an individual measurement of reflection h and 〈Ih〉 is the mean value for all equivalent measurements of this reflection.
b 〈I/σ(I)〉 is the mean of the ratio of the intensity to the standard deviation for all reflections.
FIGURE 2.

Truncated human ATP-citrate lyase. A, in complex with citrate. The protein is shown as a ribbon diagram, while citrate is shown as a stick model in magenta. Residues 2–31 and 108–243 form domain 4, which is colored green. Domain 3 includes residues 32–107 and is red. Domain 5 includes residues 244–425 and is yellow. Domain 1 includes residues 487–624 and is cyan. Domain 2 includes residues 625–820 and is blue. The terminal residues seen in the electron density are labeled with their residue numbers. The ATP-grasp fold, formed by domains 3 and 4, is at the bottom of the diagram, and ATP/ADP would be expected to bind to the back, as oriented here. B, electron density for citrate bound to the selenomethionyl protein. C, electron density for tartrate bound to human ATP-citrate lyase. Citrate or tartrate and the nearby residues are shown as stick models, colored according to atom type: red for oxygen, blue for nitrogen, and yellow for carbon. Hydrogen bonds are shown as black dashed lines. The electron density, shaded green and contoured at 3σ, is from an Fo − Fc omit map calculated using PHENIX (38) after omitting either citrate or tartrate from the refinement. This figure and Figs. 5 and 6 were drawn using PyMOL (62).
TABLE 2.
Statistics for the final models
| Structure | Truncated Se-Met hACLY complex with citrate | Truncated hACLY complex with tartrate |
|---|---|---|
| Resolution range (Å) (high resolution range) | 44.82–2.10 (2.12–2.10) | 44.74–2.20 (2.24–2.20) |
| Rwork overall (%) (number of data) | 19.1 (99,709) | 17.9 (41,273) |
| Rfree overall (%) (number of data) | 22.9 (6,072) | 22.7 (2,552) |
| Rwork in high resolution shell (%) (number of data) | 30.5 (3,360) | 24.3 (2,101) |
| Rfree in high resolution shell (%) (number of data) | 35.0 (189) | 29.2 (117) |
| Number of protein atoms | 5753 | 5764 |
| Number of water molecules | 359 | 375 |
| Number of atoms in ions or ligands | 13 | 11 |
| r.m.s.d. from ideality | ||
| Bond lengths (Å) | 0.007 | 0.007 |
| Bond angles (°) | 1.1 | 1.1 |
| Chirality (Å3) | 0.068 | 0.071 |
| Planarity (Å) | 0.004 | 0.004 |
| Dihedral angles (°) | 13 | 13 |
| Analysis of Ramachandran plot (MOLPROBITY) | ||
| Ramachandran outliers (%) | 0.1 | 0.3 |
| Ramachandran favored (%) | 97.8 | 97.6 |
An unexpected observation is electron density for two disulfide bonds in the structures. Because ACLY is a cytoplasmic enzyme, it functions in a reducing environment and would not be expected to have disulfide bonds. The first disulfide bond in the crystal structure is between Cys-20 and a symmetry-related Cys-20, related by a 2-fold crystallographic axis. The cysteine residue has been modeled in two alternate conformations to account for the electron density. The disulfide bond is surely an artifact of the experiment, due to the exposure of the protein to an oxidizing environment during crystallization. The second disulfide bond is between Cys-293 and Cys-748. Beyond residue 750, the electron density becomes weak and the residues 751–766 could not be modeled. The chymotrypsin used to truncate hACLY may have cleaved the polypeptide in this region, but it is also possible that the formation of the disulfide bond with Cys-748 has led to repositioning of this residue and disorder of the subsequent residues.
In the structure of the complex with citrate, citrate is bound to a loop that includes residues from Ser-343 to Thr-348. Additional strong hydrogen bonding interactions are formed with the side chain of Arg-379, with the nitrogen atom of Gly-309 and with a water molecule bridging to Ser-343 and Ala-280 (Fig. 2B). Citrate is a small organic acid that contains three carboxyl groups, one hydroxyl group, and one prochiral center. To distinguish between the terminal carboxyl groups, they are referred to as pro-R and pro-S (48). The pro-R carboxyl group accepts two strong hydrogen bonds (2.6 and 2.8 Å) from Arg-379. In contrast, the pro-S carboxyl group does not have hydrogen-bonding interactions with the protein and its electron density is less well defined than the electron density for either of the other carboxyl groups of citrate. Interestingly, the side chain of Phe-347, which lies close to the pro-S carboxyl group, has poor electron density with a break between the backbone and the side chain (data not shown). The central carboxyl group of citrate accepts hydrogen bonds from the side chain of Thr-348 and the backbone nitrogen atoms of Asn-346 and Thr-348. Citrate's hydroxyl group interacts with the side-chain hydroxyl group of Thr-348 and the backbone nitrogen atom of Gly-309.
Tartrate binds to hACLY in the same location as citrate (Fig. 2C). In contrast with citrate, tartrate contains two carboxyl groups and two hydroxyl groups. The carboxyl groups have similar, although not identical, interactions with the protein as the central carboxylate and the pro-R carboxylate of citrate. Two additional interactions exist for the carboxylate of tartrate that binds most like the central carboxylate of citrate, one with the side-chain nitrogen atom of Asn-346 and the second with the backbone nitrogen atom of Phe-347. One hydroxyl group of tartrate interacts with the side chain of Thr-348 just like the hydroxyl of citrate does, but this hydroxyl of tartrate is too far from Gly-309 to form a hydrogen bond. The orientation of the second hydroxyl group of tartrate is defined by the handedness of the compound. l-(+)-Tartrate is the commonly occurring isomer of tartrate, and each of its chiral carbon atoms possesses the R-configuration. Given this configuration, the second hydroxyl group of tartrate must be exposed to the solvent and has no interactions with the protein. One residue of the binding loop, Phe-347, has stronger, more continuous electron density in the complex with tartrate than in the complex with citrate.
Because tartrate binds at the citrate-binding site, it could be a competitive inhibitor. To test this, kinetic studies of tartrate inhibition of hACLY were carried out. Plots of initial velocity versus citrate concentration in the range from 0.05 to 2 mm conform to Michaelis-Menten kinetics. Analysis of the data gave the values of V and Km or apparent Km presented in Table 3. These values can be used to draw double reciprocal plots that show lines having different slopes and intersecting close to the y axis, indicating competitive inhibition. A secondary plot of Km or apparent Km versus tartrate concentration gives a value of 29 mm as the Ki for tartrate.
TABLE 3.
V and Km or apparent Km values for citrate at different concentrations of tartrate
| [Tartrate] | V | Km or apparent Km |
|---|---|---|
| mm | ||
| 0 | 0.202 ± 0.005 | 0.063 ± 0.007 |
| 30 | 0.218 ± 0.006 | 0.150 ± 0.014 |
| 60 | 0.224 ± 0.007 | 0.203 ± 0.021 |
The crystal structure indicated that CoA would not bind to the truncated hACLY (see Discussion). To verify, ITC experiments were performed to detect the binding of CoA to full-length hACLY and to the N-terminal portion seen in the crystal structure. The results are shown in Fig. 3. Fig. 3A shows the binding isotherm and the fitted data for the binding of CoA to hACLY. Based on the curve fitting, the stoichiometry is 4.06 ± 0.04, the enthalpy of binding (ΔH) is −7.19 ± 0.09 kcal/mol, and the dissociation constant (Kd) is 1.98 ± 0.14 μm. Fig. 3B shows the result when CoA was titrated into N-terminal hACLY. In this case, the small uniform peaks indicate the heat of dilution for the CoA solution, rather than binding of CoA to the protein.
FIGURE 3.

Characterization of the binding of CoA to human ATP-citrate lyase or N-terminal human ATP-citrate lyase. A, titration of 1 mm CoA into 0.014 mm human ATP-citrate lyase. B, titration of 1 mm CoA into 0.056 mm human ATP-citrate lyase.
DISCUSSION
Overall Structure of Truncated Human ACLY
The structure of truncated hACLY shows the five domains common to all members of the acyl-CoA synthetase (NDP-forming) superfamily (Fig. 1). The cleaved protein can be thought to contain two subunits: an α-subunit composed of residues 486–818 that correspond to domains 1 and 2 of acyl-CoA synthetases (NDP-forming) and a β-subunit composed of residues 1–424 or domains 3–5 (Fig. 2A). The benefit of thinking of the structure of truncated hACLY as two subunits is that it serves as a reminder that what are defined as the two subunits may indeed be two different polypeptide chains in ACLY. The bacterial and plant enzymes are produced as two subunits (52, 53), whereas the mammalian enzyme is produced as a single polypeptide chain (54). In both cases, the quaternary structure is similar, heterooctamers for the bacterial and plant ACLYs, and homotetramers for the mammalian forms. Because hACLY was produced as the full-length enzyme, then cleaved by chymotrypsin to give the crystallized form, what is being produced in E. coli is the homotetramer. What is seen in the asymmetric unit of the crystal is only one copy of each polypeptide chain, but could come from a single polypeptide chain or from two different chains of the homotetramer. An additional benefit of considering the structure as possessing two subunits is that the domains and subunits are then similar to those of SCS. Supplemental Fig. S2 shows the sequence of truncated hACLY along with alignments with both E. coli SCS (PDB code 2SCU) and pig GTP-specific SCS (PDB code 2FP4), based on superpositions of similar domains in the structures. The root mean squared deviations (r.m.s.d.) for the superpositions are presented in Table 4.
TABLE 4.
r.m.s.d. values for the superpositions of domains of truncated human ATP-citrate lyase with the similar domains of succinyl-CoA synthetase (SCS) from E. coli (2SCU) and pig GTP-specific SCS bound to GTP (2FP4)
The numbers in parentheses are the numbers of Cα atoms that superpose within 2.5 Å, from which the r.m.s.d. values were calculated.
| E. coli SCS | Pig GTP-specific SCS | |
|---|---|---|
| Domains 1 and 2 | 1.14 Å (216) | 1.33 Å (212) |
| Domains 3 and 4 | 1.41 Å (120) | 1.37 Å (137) |
| Domain 5 | 1.33 Å (75) | 1.78 Å (110) |
Each of domains 1 and 2 adopts a Rossmann or nucleotide-binding fold (55). In SCS, the substrate CoA binds at the nucleotide-binding site of domain 1. Domain 2 includes the phosphohistidine loop, and this loop binds in the comparable location, which is at the C termini of the β-strands that form the core of the fold. Residues from Ala-749 to Gln-766 of hACLY correspond to the phosphohistidine loop of SCS (Ala-251α to Lys-268α in the pig GTP-specific enzyme and Ala-238α to Lys-255α in E. coli SCS). In the structure of truncated hACLY, none of the residues between 750 and 767 are modeled, because they were either cleaved by chymotrypsin or they are disordered in the crystal. A possible source of the disorder is the disulfide bond between residues 293 and 748. ACLY is inactivated by oxidation (46) and the formation of a disulfide bond that would prevent the phosphohistidine loop from moving into position to transfer the phosphoryl group would inactivate the enzyme. Although cytoplasmic proteins are commonly thought to be in a reducing environment, evidence that different reduction states control metabolic processes is accumulating (56).
Domains 3 and 4 form the ATP-grasp fold (10). In SCS, these domains are known to have different degrees of closure, and they are closed when binding nucleotide (14). The conformation seen in the structure of truncated hACLY is very similar to that of the GTP-bound form of pig GTP-specific SCS (14), as demonstrated by the r.m.s.d. listed in Table 4.
The final domain, domain 5, possesses the third Rossmann fold (55) seen in the structure. A helix from this domain, residues 282–294, is in intimate contact with the α-subunit. It is comparable to one of the two “power helices” at whose N termini the phosphohistidine residue is found in SCS (9). Cys-293, which forms a disulfide bond with Cys-748, is near the C terminus of this helix. This disulfide bond could affect the orientation of the helix and hence affect the binding site of the phosphohistidine residue.
Residues 425–485, for which there are no equivalent residues in plant or bacterial ACLYs (52, 53), were likely cleaved by chymotrypsin and not part of the protein crystallized. Residues 425–485 include the serine and threonine residues that are phosphorylated by kinases in mammalian ACLYs (16–18). The citrate synthase domain that would follow residue 818 is also not part of the structure, nor is much of the linker between domain 2 and the citrate synthase domain.
Citrate-binding Site
Citrate binds to domain 5 of ACLY where the β-strands forming the core of the domain splay so that the subsequent α-helices are on opposite sides of the β-sheet (Fig. 2A). One of these α-helices is analogous to the power helix supplied by the β-subunit to the binding site for the phosphohistidine residue in SCS. The other α-helix is preceded by a longer loop, residues 343–349, which is responsible for many of the interactions with citrate (Fig. 2B). As documented in Table 4, the domain pairs 1 and 2 and 3 and 4 superpose very well with the similar domains of SCS. The superpositions for domain 5 are not as good, and this is not surprising, because domain 5 of ACLY has to accommodate the binding of citrate, while this domain of SCS would be expected to bind succinate.
Stereospecificity of the Reaction Mechanism
Although the pro-R and pro-S carboxyl groups of the citrate molecule are indistinguishable in non-enzymatic reactions, ACLY allows the pro-S carboxyl group to be reactive but keeps the pro-R carboxyl group inactive (57). This results in the reaction intermediates, citryl-phosphate (7) and citryl-CoA (57), having the S-configuration. The view of the citrate-binding site in the crystal structure of truncated hACLY shows how ACLY discriminates between the pro-R and pro-S carboxyl groups. As shown in Fig. 2B, the pro-R carboxyl group forms strong ionic interactions with Arg-379. In contrast, the pro-S carboxyl group of citrate is exposed and free to react with the phosphohistidine residue. hACLY uses the loop of residues from Ser-343 to Thr-348 as well as the backbone nitrogen atom of Gly-309 to achieve the specific orientation of the citrate molecule. The interactions of the protein with the central carboxyl group and the hydroxyl group of citrate cannot be interchanged. The orientation of these two substituents on the prochirality center forces the pro-R carboxyl group to point toward Arg-379 while the pro-S carboxyl group is exposed and free to react with the phosphohistidine residue. Once citrate is phosphorylated, the free thiol of CoA would react with this pro-S carboxyl group to form S-citryl-CoA.
Identification of the Citrate-binding Motif in Citryl-CoA Synthetases
A citrate-binding motif can be identified from the sequence of the loop binding the citrate residue and specification of the location of the arginine residue that interacts with the pro-R carboxylate. The loop has the sequence Ala-Asn-Phe-Thr, and the arginine residue is located in the subsequent β-strand. Sequence alignments for ACLYs from different species show that the citrate-binding motif is conserved even in the two chain ACLYs from species such as Arabidopsis thaliana (52) and Chlorobium tepidum (53). This is consistent with the idea that functionally important residues are conserved through evolution.
Another enzyme that catalyzes the synthesis of citryl-CoA from citrate and CoA is citryl-CoA synthetase. This enzyme was first identified in Hydrogenobacter thermophilus TK-6 and shown to be a member of the acyl-CoA synthetase (NDP-forming) superfamily based on the analysis of its sequence (58). The organization of the five domains and their distribution into subunits are the same as for SCS (Fig. 1). An alignment of the sequences of domain 5 from hACLY, citryl-CoA synthetase, SCS, and malyl-CoA synthetase reveals that the arginine residue of the citrate-binding motif identified in hACLY is conserved in citryl-CoA synthetase but not in SCS nor malyl-CoA synthetase (Fig. 4). This arginine residue is the second in a pair of arginines in the sequences of hACLY and citryl-CoA synthetase. The first is conserved in all four enzymes and, in the structures of both SCS and truncated hACLY, it provides an interaction with a glutamate residue of the power helix provided by the α-subunit. The citrate-binding loop is not clearly defined by sequence alignments, because the alignment presented here differs from the one published for the large subunits of H. thermophilus succinyl-CoA synthetase, citryl-CoA synthetase, and E. coli succinyl-CoA synthetase (58). It is possible that Gly-332-Thr-Ala-Asn-Asn-Thr-337 of citryl-CoA synthetase aligns with Ser-343-Ile-Ala-Asn-Phe-Thr-348 of ATP-citrate lyase, leading to similar interactions of the loop with citrate in the two citrate-binding enzymes.
FIGURE 4.

Sequence alignments of the citrate-binding domain of human ATP-citrate lyase with similar sequences in E. coli succinyl-CoA synthetase, Methylobacterium extorquens AM1 malyl-CoA synthetase, and H. thermophilus TK-6 citryl-CoA synthetase (49). The citrate-binding loop and Arg-379 of ATP-citrate lyase are highlighted with arrowheads.
The presence of this second arginine residue allows citryl-CoA synthetases to be distinguished from SCSs. Aoshima et al. used the sequence of citryl-CoA synthetase to search for similar proteins (58). In the genome of Aquifex aeolicus, they found two sets of similar genes that had been assigned as hypothetical SCSs. They hypothesized that sucC1 (AAC07285) and sucD1 (AAC07686) were genes for the citryl-CoA synthetase subunits, whereas sucC2 (AAC07508) and sucD2 (AAC07509) were genes for SCS subunits. Looking at these sequences with our knowledge of the citrate-binding motif, we would agree with this assignment, because only the sequence of sucC1 has the pair of arginine residues. Their predictions did not extend to the two sets of hypothetical SCS genes in the Archaeoglobus fulgidus genome, because they thought that those sequences looked more like the sequences of the H. thermophilus SCS genes (58). Our analysis picks out the sequence VVKLA in sucC1 (AF1540) and the sequence VVRLA in sucC2 (AF2186) where citryl-CoA synthetase has VVRRN. We would predict that neither of these genes encodes a subunit with specificity for citrate.
Because ACLY and the citryl-CoA synthetases are likely to have a similar mode of binding citrate, the stereospecificity of these enzymes should be the same: they should all be S-citryl-CoA synthetases. Aoshima et al. proved this by using a coupled enzyme assay with citrate synthase from pig heart to detect citryl-CoA (58). This enzyme is specific for S-citryl-CoA and would not have cleaved the other isomer.
Binding of Tartrate to the Citrate-binding Site
In contrast to citrate, tartrate has only two carboxyl groups and because of how it binds to the citrate-binding site, it is lacking a reactive carboxylate. This suggested that tartrate would not be a substrate of ACLY but an inhibitor, competitive with citrate. This was proven true by kinetic analyses. The differences between the interactions of citrate and tartrate at the binding site emphasize that, even when the organic acids are similar, the binding interactions need not be identical. Both the citrate-binding loop and Arg-379 adjust to accommodate tartrate.
Proposed Organic Acid-binding Site in the acyl-CoA Synthetase (NDP-forming) Superfamily
Prior to the crystallization of citrate bound to truncated hACLY, there were no crystal structures of any enzyme of the acyl-CoA synthetase (NDP-forming) superfamily in complex with its organic acid substrate. These enzymes are all thought to possess a phosphohistidine loop, which swings from the nucleotide-binding site to the site where CoA and the organic acid bind (8, 59). Based on the structure of truncated hACLY with citrate, we can propose a location for the binding site of succinate on SCS, the prototype of the family of acyl-CoA synthetases (NDP-forming).
Succinate possesses two carboxyl groups, in contrast to the three carboxyl groups and central hydroxyl group of citrate. One of the two carboxyl groups of succinate must react with the phosphohistidine in the same way that the reactive pro-S carboxyl group of citrate does, so it must be exposed. The second carboxyl group likely superposes with the central carboxyl of citrate, binding to the backbone amide nitrogen atoms of the loop. Because the equivalent carboxyl group of citrate binds to the backbone of both Asn-346 and Thr-348, the non-reactive carboxyl group of succinate would be expected to bind to the backbone nitrogen atoms of Gly-328β and Val-330β of pig GTP-specific SCS or Gly-321β and Val-323β of E. coli SCS (Fig. 4). In both forms of SCS, the hydrophobic side chain of Ile substitutes for the side chain of Phe-347 in hACLY. Mutagenesis studies of E. coli SCS had suggested that this was the binding site for succinate in SCS (11). When Ile-322β was mutated to Ala, Km(app) for succinate increased from 0.25 mm to 14 mm. The Ala mutant would provide a smaller hydrophobic surface with which the substrate could interact, leading to the larger value of Km(app). The loop from Gly-327β to Val-330β in pig GTP-specific SCS and that from Gly-321β to Val-323β in E. coli SCS do not superpose well, likely because both loops are flexible in the absence of succinate due to the glycine residues. However, the sequence of this loop, Gly-Gly-Ile-Val, is well conserved among SCSs and would be expected to be the binding loop for succinate in all of them.
CoA-binding Site
ACLY could have either one or two CoA-binding sites per subunit. This is because the enzyme possesses similarity to SCS and to citrate synthase, each of which has a distinctive CoA-binding site. The CoA-binding site in the structure of truncated hACLY is similar to that of SCS, and the two were compared, to judge whether CoA is likely to bind at this site. This interpretation was then tested using ITC to detect the enthalpy change on binding CoA.
Comparison with the CoA-binding Site of SCS
A superposition of the possible CoA-binding site of truncated hACLY with the CoA-binding site of E. coli SCS is shown in Fig. 5. The site consists of five loop-containing regions L1–L5 in the structure of E. coli SCS in complex with CoA (PDB ID 2SCU) (59). These loops are highlighted on the sequence alignment, supplemental Fig. S2. L1, L2, and L3 are responsible for the interactions with adenosine 3′,5′,5′-triphosphate, whereas L3, L4, and L5 are responsible for binding the pantetheine portion of CoA.
FIGURE 5.

Stereoview of one of the possible CoA-binding sites of ATP-citrate lyase superposed on the CoA-binding site of E. coli succinyl-CoA synthetase. Stick models are shown for CoA bound to E. coli succinyl-CoA synthetase, for the phosphohistidine residue and for residues of this protein with atoms within 3.6 Å of CoA. These stick models are colored according to atom type: phosphorus in light green, sulfur in magenta, oxygen in red, nitrogen in blue, and carbon in gray. The residues labeled are in the α-subunit of E. coli succinyl-CoA synthetase. Residues of truncated human ATP-citrate lyase that lie in similar positions are shown by stick models for their side chains. The coloring is similar to that used for E. coli succinyl-CoA synthetase, but the carbon atoms are shown in cyan. In addition, citrate is shown as a magenta stick model and parts of ATP-citrate lyase lying within the view are displayed as cyan and yellow ribbon diagrams, as in Fig. 2.
A comparison of L1, L2, and L3 of truncated hACLY with the similar regions of SCS shows that hACLY possesses a novel CoA-binding site. In the structure of the complex of E. coli SCS with CoA, Pro-40α of L2 and Val-72α of L3 form a hydrophobic pocket where the adenine base of CoA binds (Fig. 5). In truncated hACLY, the two equivalent residues, Pro-532 and Ala-573, form a similar hydrophobic pocket, but the indole side chain of Trp-502 lies in this pocket. The indole group would block the binding of the adenine moiety of CoA at this site. This tryptophan residue is highly conserved in ACLYs from many species, suggesting that all ACLYs contain a novel CoA-binding site. In contrast, for SCSs, the residue equivalent to Trp is Gln. Gln forms hydrogen bonds via its side chain, holding it outside the adenine-binding pocket whether CoA is bound as in E. coli SCS (2SCU) or not as in pig GTP-specific SCS (2FP4) (14). This is not the only structural difference at the CoA-binding site. The residues of L1 leading from Trp-502 into the α-helix adopt a different conformation in hACLY than in SCS, changing the binding site for the 5′-diphosphate moiety of CoA. Furthermore, in L2 of hACLY Tyr-531 and Phe-533 would clash with the phosphorylated ribose moiety of CoA if there were no conformational changes in these residues and CoA were to bind to ACLY in the same way as it binds to SCS. The structural evidence indicated that CoA does not bind at this site in ACLY. The ITC experiment substantiated this interpretation. CoA bound to full-length hACLY with the expected stoichiometry of one molecule CoA per monomer, but binding of CoA to N-terminal hACLY could not be detected. Future work could include site-directed mutagenesis to disrupt the proposed binding site in the C-terminal domain of hACLY, which is similar to the CoA-binding site in citrate synthase.
In contrast with the variations in the adenosine 3′,5′,5′-triphosphate-binding site, the pantetheine-binding site in hACLY is very similar to that in SCS. The primary interactions with the pantetheine portion of CoA are hydrophobic interactions between L3 and the two methyl groups of CoA and two hydrogen bonds, one between a carbonyl oxygen atom of Ile-95 of L4 and one of the amide nitrogen atoms of pantetheine and the second from an amide nitrogen atom of Glu-97 of L4 to one of the carbonyl oxygen atoms of pantetheine (Fig. 5). The similarities between the two structures in this region suggest that the pantetheine moiety of CoA binds in this region of hACLY, positioning the free thiol near the active site histidine residue in much the same way as occurs in SCS. To illustrate the proximity of the phosphohistidine residue to the substrates, this residue and the bound citrate molecule are included in Fig. 5.
ATP-binding Site
ACLY uses the high energy bond between the β- and γ-phosphate groups of ATP as the energy source to form the thioester bond between citrate and CoA. This contrasts with some of the other acyl-CoA synthetases (NDP-forming), particularly the SCSs that can use GTP, e.g. pig GTP-specific SCS (60), or either ATP or GTP, e.g. E. coli SCS (61). In ACLY, the two N-terminal domains that adopt the ATP-grasp fold are presumed to form the binding site for Mg2+-ATP. The conformation of the polypeptide chain and the residues at this binding site can be compared with those of pig GTP-specific SCS and E. coli SCS to rationalize the specificity of ACLY for ATP.
Many of the residues in the nucleotide-binding cleft are the same for hACLY, pig GTP-specific SCS (14), and E. coli SCS (12) and would be expected to interact with the nucleotide in the same way (Fig. 6). Arg-66 would interact with the phosphates, as would the backbone amide nitrogen atoms of the two preceding residues. Asp-216 and the carbonyl oxygen of the cis-peptide bond between Asn-203 and Pro-204 would also be expected to interact with the phosphate groups or magnesium ions. All three enzymes have a glutamate residue where ACLY has Glu-118, and this residue is likely to interact weakly with the hydroxyl group of the ribose as in E. coli SCS. All three also have a lysine residue where ACLY has Lys-58, which should interact with the α-phosphate and N7 of the adenine base as in E. coli SCS. Interactions between N6 and N1 of the base and the backbone, as in E. coli SCS, are likely formed by the carbonyl of Pro-109 and the amide of Val-111 of ACLY. The pocket formed by the side chains of Val-56 and Leu-215 is expected to form hydrophobic interactions with the adenine moiety of ATP.
FIGURE 6.

ADP modeled in the ATP-grasp fold of truncated human ATP-citrate lyase. A, a ribbon diagram of the ATP-grasp fold of truncated human ATP-citrate lyase is shown in green. Mg2+-ADP is shown as a stick model with a purple ball for the ion. The stick model is colored according to atom type with phosphorus in light green, oxygen in red, nitrogen in blue, and carbon in gray. A single α-helix and three β-strands at the junction of the two domains of the ATP-grasp fold in E. coli succinyl-CoA synthetase are shown in red. B, enlarged view of the ADP-binding site of human ATP-citrate lyase. The coloring is the same as in A, except that side chains of human ATP-citrate lyase that lie near Mg2+-ADP are drawn with green for the carbon atoms and the carbon atoms of ADP are cyan.
One major difference in the ATP-binding site is the position of the polypeptide chain that extends from domain 3 to domain 4 (Fig. 6A). In pig GTP-specific SCS, Gln-20β is located here, and this residue interacts favorably with O6 of the guanine base, providing a key component of the substrate specificity (14). In E. coli SCS, the equivalent residue is Pro-20β, whose shorter side chain allows adenine to bind deeper in the cleft than guanine does. In contrast to both of the SCSs, the polypeptide backbone from domain 3 to domain 4 in hACLY has a different conformation and is located ∼3 Å further from where the adenine base would bind. This gives an even deeper pocket in ACLY than in E. coli SCS, one that would be suitable for the binding of ATP but could not provide a side chain to interact with O6 of GTP.
CONCLUSION
Crystals of chymotrypsin-truncated human ATP-citrate lyase revealed the binding sites for two of the substrates, citrate and ATP. ITC was used to show that CoA would not bind to the portion of human ATP-citrate lyase crystallized, validating the interpretation from the crystal structure that the CoA-binding site of ATP-citrate lyase is different from that of succinyl-CoA synthetase. In contrast, the ATP-binding site of ATP-citrate lyase is similar to that of the succinyl-CoA synthetases. Most importantly, the mode of binding of citrate to ATP-citrate lyase was revealed, and this is the first structure of any member of the superfamily of acyl-CoA synthetases (NDP-forming) to show how the enzyme binds the organic acid substrate.
Supplementary Material
Acknowledgment
We thank Edward Brownie for technical assistance in the purification of human ATP-citrate lyase used for crystallization.
The work was supported through an operating grant from the Canadian Institutes of Health Research (CIHR) (Grant MOP-42446) and a Discovery Grant from the Natural Sciences and Engineering Research Council of Canada (NSERC). X-ray diffraction data were collected at the Canadian Macromolecular Crystallography Facility, beamline 08ID-1, of the Canadian Light Source (CLS) and at beamline 8.3.1 of the Advanced Light Source (ALS) at Lawrence Berkeley Lab, under an agreement with the Alberta Synchrotron Institute (ASI). The ALS is operated by the Dept. of Energy and supported by the National Institutes of Health. Beamline 8.3.1 was funded by the National Science Foundation, the University of California and Henry Wheeler. The ASI synchrotron access program was supported by grants from the Alberta Science and Research Authority and the Alberta Heritage Foundation for Medical Research. The CLS is supported by NSERC, NRC, CIHR, and the University of Saskatchewan.
The atomic coordinates and structure factors (codes 3MWD and 3MWE) have been deposited in the Protein Data Bank, Research Collaboratory for Structural Bioinformatics, Rutgers University, New Brunswick, NJ (http://www.rcsb.org/).

The on-line version of this article (available at http://www.jbc.org) contains supplemental Figs. S1 and S2 and Table S1.
- ACLY
- ATP-citrate lyase
- hACLY
- human ATP-citrate lyase
- ITC
- isothermal titration calorimetry
- r.m.s.d.
- root mean squared deviation
- SCS
- succinyl-CoA synthetase.
REFERENCES
- 1.Srere P. A., Lipmann F. (1953) J. Am. Chem. Soc. 75, 4874 [Google Scholar]
- 2.Wellen K. E., Hatzivassiliou G., Sachdeva U. M., Bui T. V., Cross J. R., Thompson C. B. (2009) Science 324, 1076–1080 [DOI] [PMC free article] [PubMed] [Google Scholar]
- 3.Beigneux A. P., Kosinski C., Gavino B., Horton J. D., Skarnes W. C., Young S. G. (2004) J. Biol. Chem. 279, 9557–9564 [DOI] [PMC free article] [PubMed] [Google Scholar]
- 4.Kaufman S. (1953) Fed. Proc. 12, 704–708 [PubMed] [Google Scholar]
- 5.Cottam G. L., Srere P. A. (1969) Arch. Biochem. Biophys. 130, 304–311 [DOI] [PubMed] [Google Scholar]
- 6.Inoue H., Suzuki F., Tanioka H., Takeda Y. (1967) Biochem. Biophys. Res. Commun. 26, 602–608 [DOI] [PubMed] [Google Scholar]
- 7.Wells T. N. (1991) Eur. J. Biochem. 199, 163–168 [DOI] [PubMed] [Google Scholar]
- 8.Sánchez L. B., Galperin M. Y., Müller M. (2000) J. Biol. Chem. 275, 5794–5803 [DOI] [PubMed] [Google Scholar]
- 9.Wolodko W. T., Fraser M. E., James M. N., Bridger W. A. (1994) J. Biol. Chem. 269, 10883–10890 [DOI] [PubMed] [Google Scholar]
- 10.Murzin A. G. (1996) Curr. Opin. Struct. Biol. 6, 386–394 [DOI] [PubMed] [Google Scholar]
- 11.Joyce M. A., Fraser M. E., Brownie E. R., James M. N., Bridger W. A., Wolodko W. T. (1999) Biochemistry 38, 7273–7283 [DOI] [PubMed] [Google Scholar]
- 12.Joyce M. A., Fraser M. E., James M. N., Bridger W. A., Wolodko W. T. (2000) Biochemistry 39, 17–25 [DOI] [PubMed] [Google Scholar]
- 13.Fraser M. E., James M. N., Bridger W. A., Wolodko W. T. (2000) J. Mol. Biol. 299, 1325–1339 [DOI] [PubMed] [Google Scholar]
- 14.Fraser M. E., Hayakawa K., Hume M. S., Ryan D. G., Brownie E. R. (2006) J. Biol. Chem. 281, 11058–11065 [DOI] [PubMed] [Google Scholar]
- 15.Elshourbagy N. A., Near J. C., Kmetz P. J., Wells T. N., Groot P. H., Saxty B. A., Hughes S. A., Franklin M., Gloger I. S. (1992) Eur. J. Biochem. 204, 491–499 [DOI] [PubMed] [Google Scholar]
- 16.Pierce M. W., Palmer J. L., Keutmann H. T., Avruch J. (1981) J. Biol. Chem. 256, 8867–8870 [PubMed] [Google Scholar]
- 17.Ramakrishna S., D'Angelo G., Benjamin W. B. (1990) Biochemistry 29, 7617–7624 [DOI] [PubMed] [Google Scholar]
- 18.Berwick D. C., Hers I., Heesom K. J., Moule S. K., Tavare J. M. (2002) J. Biol. Chem. 277, 33895–33900 [DOI] [PubMed] [Google Scholar]
- 19.Altschul S. F., Madden T. L., Schäffer A. A., Zhang J., Zhang Z., Miller W., Lipman D. J. (1997) Nucleic Acids Res. 25, 3389–3402 [DOI] [PMC free article] [PubMed] [Google Scholar]
- 20.Groot P. H., Pearce N. J., Gribble A. D. (2003) Curr. Med. Chem. Immun. Endocrin. Metab. Agents 3, 211–217 [Google Scholar]
- 21.Clapham J. C., Arch J. R. (2007) Diabetes Obes. Metab. 9, 259–275 [DOI] [PubMed] [Google Scholar]
- 22.Bauer D. E., Hatzivassiliou G., Zhao F., Andreadis C., Thompson C. B. (2005) Oncogene 24, 6314–6322 [DOI] [PubMed] [Google Scholar]
- 23.Hatzivassiliou G., Zhao F., Bauer D. E., Andreadis C., Shaw A. N., Dhanak D., Hingorani S. R., Tuveson D. A., Thompson C. B. (2005) Cancer Cell 8, 311–321 [DOI] [PubMed] [Google Scholar]
- 24.Garber K. (2006) Science 312, 1158–1159 [DOI] [PubMed] [Google Scholar]
- 25.Migita T., Narita T., Nomura K., Miyagi E., Inazuka F., Matsuura M., Ushijima M., Mashima T., Seimiya H., Satoh Y., Okumura S., Nakagawa K., Ishikawa Y. (2008) Cancer Res. 68, 8547–8554 [DOI] [PubMed] [Google Scholar]
- 26.Potapova I. A., El-Maghrabi M. R., Doronin S. V., Benjamin W. B. (2000) Biochemistry 39, 1169–1179 [DOI] [PubMed] [Google Scholar]
- 27.Sambrook J., Russell D. W. (2001) Molecular Cloning: A Laboratory Manual, 3rd Ed., Cold Spring Harbor Laboratory Press, Cold Spring Harbor, NY [Google Scholar]
- 28.Deng J., Davies D. R., Wisedchaisri G., Wu M., Hol W. G., Mehlin C. (2004) Acta Crystallogr. D Biol. Crystallogr. 60, 203–204 [DOI] [PubMed] [Google Scholar]
- 29.Dong A., Xu X., Edwards A. M., Chang C., Chruszcz M., Cuff M., Cymborowski M., Di Leo R., Egorova O., Evdokimova E., Filippova E., Gu J., Guthrie J., Ignatchenko A., Joachimiak A., Klostermann N., Kim Y., Korniyenko Y., Minor W., Que Q., Savchenko A., Skarina T., Tan K., Yakunin A., Yee A., Yim V., Zhang R., Zheng H., Akutsu M., Arrowsmith C., Avvakumov G. V., Bochkarev A., Dahlgren L. G., Dhe-Paganon S., Dimov S., Dombrovski L., Finerty P., Jr., Flodin S., Flores A., Graslund S., Hammerstrom M., Herman M. D., Hong B. S., Hui R., Johansson I., Liu Y., Nilsson M., Nedyalkova L., Nordlund P., Nyman T., Min J., Ouyang H., Park H. W., Qi C., Rabeh W., Shen L., Shen Y., Sukumard D., Tempel W., Tong Y., Tresagues L., Vedadi M., Walker J. R., Weigelt J., Welin M., Wu H., Xiao T., Zeng H., Zhu H. (2007) Nat. Methods 4, 1019–1021 [DOI] [PMC free article] [PubMed] [Google Scholar]
- 30.Traini M., Gooley A. A., Ou K., Wilkins M. R., Tonella L., Sanchez J. C., Hochstrasser D. F., Williams K. L. (1998) Electrophoresis 19, 1941–1949 [DOI] [PubMed] [Google Scholar]
- 31.Bateman K. S., Brownie E. R., Wolodko W. T., Fraser M. E. (2002) Biochemistry 41, 14455–14462 [DOI] [PubMed] [Google Scholar]
- 32.Doublié S. (1997) Methods Enzymol. 276, 523–530 [PubMed] [Google Scholar]
- 33.Holton J., Alber T. (2004) Proc. Natl. Acad. Sci. U.S.A. 101, 1537–1542 [DOI] [PMC free article] [PubMed] [Google Scholar]
- 34.Leslie A. G. (1992) Joint CCP4 + ESF-EAMCB Newsletter on Protein Crystallography, No. 26 [Google Scholar]
- 35.Collaborative Computational Project, No. 4 (1994) Acta Crystallogr. Sect. D 50, 760–76315299374 [Google Scholar]
- 36.Matthews B. W. (1968) J. Mol. Biol. 33, 491–497 [DOI] [PubMed] [Google Scholar]
- 37.Kantardjieff K. A., Rupp B. (2003) Protein Sci. 12, 1865–1871 [DOI] [PMC free article] [PubMed] [Google Scholar]
- 38.Adams P. D., Afonine P. V., Bunkoczi G., Chen V. B., Davis I. W., Echols N., Headd J. J., Hung L.-W., Kapral G. J., Grosse-Kunstleve R. W., McCoy A. J., Moriarty N. W., Oeffner R., Read R. J., Richardson D. C., Richardson J. S., Terwilliger T. C., Zwart P. H. (2010) Acta Crystallogr. D Biol. Crystallogr. 66, 213–221 [DOI] [PMC free article] [PubMed] [Google Scholar]
- 39.McCoy A. J., Grosse-Kunstleve R. W., Storoni L. C., Read R. J. (2005) Acta Crystallogr. D Biol. Crystallogr. 61, 458–464 [DOI] [PubMed] [Google Scholar]
- 40.Berman H. M., Westbrook J., Feng Z., Gilliland G., Bhat T. N., Weissig H., Shindyalov I. N., Bourne P. E. (2000) Nucleic Acids Res. 28, 235–242 [DOI] [PMC free article] [PubMed] [Google Scholar]
- 41.Emsley P., Lohkamp B., Scott W. G., Cowtan K. (2010) Acta Crystallogr. D Biol. Crystallogr. 66, 486–501 [DOI] [PMC free article] [PubMed] [Google Scholar]
- 42.Laskowski R. A., MacArthur M. W., Moss D. S., Thornton J. M. (1993) J. Appl. Crystallogr. 26, 283–291 [Google Scholar]
- 43.Davis I. W., Leaver-Fay A., Chen V. B., Block J. N., Kapral G. J., Wang X., Murray L. W., Arendall W. B., 3rd, Snoeyink J., Richardson J. S., Richardson D. C. (2007) Nucleic Acids Res. 35, W375–W383, web server issue [DOI] [PMC free article] [PubMed] [Google Scholar]
- 44.Guex N., Peitsch M. C. (1997) Electrophoresis 18, 2714–2723 [DOI] [PubMed] [Google Scholar]
- 45.Jones T. A., Zou J.-Y., Cowan S. W., Kjeldgaard M. (1991) Acta Crystallogr. A 47, 110–119 [DOI] [PubMed] [Google Scholar]
- 46.Inoue H., Suzuki F., Fukunishi K., Adachi K., Takeda Y. (1966) J. Biochem. 60, 543–553 [Google Scholar]
- 47.Clauser K. R., Baker P., Burlingame A. L. (1999) Anal. Chem. 71, 2871–2882 [DOI] [PubMed] [Google Scholar]
- 48.Hanson K. R. (1966) J. Am. Chem. Soc. 88, 2731–2742 [Google Scholar]
- 49.Larkin M. A., Blackshields G., Brown N. P., Chenna R., McGettigan P. A., McWilliam H., Valentin F., Wallace I. M., Wilm A., Lopez R., Thompson J. D., Gibson T. J., Higgins D. G. (2007) Bioinformatics 23, 2947–2948 [DOI] [PubMed] [Google Scholar]
- 50.Deleted in proof
- 51.Deleted in proof
- 52.Fatland B. L., Ke J., Anderson M. D., Mentzen W. I., Cui L. W., Allred C. C., Johnston J. L., Nikolau B. J., Wurtele E. S. (2002) Plant Physiol. 130, 740–756 [DOI] [PMC free article] [PubMed] [Google Scholar]
- 53.Kim W., Tabita F. R. (2006) J. Bacteriol. 188, 6544–6552 [DOI] [PMC free article] [PubMed] [Google Scholar]
- 54.Singh M., Richards E. G., Mukherjee A., Srere P. A. (1976) J. Biol. Chem. 251, 5242–5250 [PubMed] [Google Scholar]
- 55.Rao S. T., Rossmann M. G. (1973) J. Mol. Biol. 76, 241–256 [DOI] [PubMed] [Google Scholar]
- 56.Dalle-Donne I., Rossi R., Colombo G., Giustarini D., Milzani A. (2009) Trends Biochem. Sci. 34, 85–96 [DOI] [PubMed] [Google Scholar]
- 57.Srere P. A., Bhaduri A. (1964) J. Biol. Chem. 239, 714–718 [PubMed] [Google Scholar]
- 58.Aoshima M., Ishii M., Igarashi Y. (2004) Mol. Microbiol. 52, 751–761 [DOI] [PubMed] [Google Scholar]
- 59.Fraser M. E., James M. N., Bridger W. A., Wolodko W. T. (1999) J. Mol. Biol. 285, 1633–1653 [DOI] [PubMed] [Google Scholar]
- 60.Sanadi D. R., Gibson D. M., Ayengar P., Jacob M. (1956) J. Biol. Chem. 218, 505–520 [PubMed] [Google Scholar]
- 61.Weitzman P. D. J. (1981) Adv. Microb. Physiol. 22, 185–244 [DOI] [PubMed] [Google Scholar]
- 62.DeLano W. L. (2002) The PyMOL Molecular Graphics System, DeLano Scientific LLC, San Carlos, CA [Google Scholar]
Associated Data
This section collects any data citations, data availability statements, or supplementary materials included in this article.