

Abstract
In mice, nonvolatile social cues are detected and analyzed by the accessory olfactory system (AOS). Here we provide a first view of information processing in the AOS with respect to individual chemical cues. 12 sulfated steroids, recently-discovered mouse AOS ligands, caused widespread activity among vomeronasal sensory neurons (VSNs), yet VSN responses clustered into a small number of repeated functional patterns or processing streams. Downstream neurons in the accessory olfactory bulb (AOB) responded to these ligands with enhanced signal/noise compared to VSNs. Whereas the dendritic connectivity of AOB mitral cells suggests the capacity for broad integration, most sulfated steroid responses were well-modeled by linear excitatory drive from just one VSN processing stream. However, a significant minority demonstrated multi-stream integration. Most VSN excitation patterns were also observed in the AOB, but excitation by estradiol sulfate processing streams was rare, suggesting AOB circuit organization is specific to the biological relevance of sensed cues.
Keywords: accessory olfactory system, accessory olfactory bulb, mitral cells, vomeronasal neurons, sulfated steroids, sensory coding
In mice and other terrestrial mammals, social interactions such as aggression, reproduction, and maternal care are mediated by chemical cues that are detected and analyzed by the olfactory systems1-3. Two of these are the main and accessory olfactory systems, which detect volatile and nonvolatile odors, respectively. The main olfactory system executes both social and non-social functions, whereas the accessory olfactory system (AOS) seemingly specializes in social interactions. In the quest to understand the principles of neural encoding and decoding of social odorants, a major challenge is to decipher how neurons along the AOS neural pathway process information about specific odors.
The mouse AOS begins in the vomeronasal organ (VNO), a blind-ended tube in the nasal cavity. In the VNO, each vomeronasal sensory neuron (VSN) expresses one, or a few4, of approximately 300 G protein-coupled vomeronasal receptors. Vomeronasal receptors are classified broadly into two families, called V1R and V2R, with a dozen sub-families recognized among the V1Rs5. Axons from VSNs expressing the same receptor type project to pooled synaptic structures called glomeruli in the accessory olfactory bulb (AOB), at the posterior face of the olfactory bulb6, 7. There, they provide glutamatergic input to their postsynaptic partners in the AOB, including the projection neurons, which we will call “mitral cells” by convention (but see 8).
In contrast to their analogs in the MOB, mitral cells in the AOB possess dendrites that innervate multiple glomeruli9. In principle, this could allow AOB mitral cells to integrate excitatory signals from multiple receptor types. Two anatomical studies have traced the dendrites of mitral cells innervating glomeruli targeted by individual vomeronasal receptors10, 11. These studies tagged different vomeronasal receptor sub-types, and came to opposing conclusions about the degree to which mitral cells receive inputs from VSNs expressing different receptor types. Given our ignorance of the ligand-binding properties of different vomeronasal receptors, and the possibility that homologous receptors might have similar or identical ligand-binding properties, anatomical studies do not directly address the core issue: whether, or how often, mitral cells integrate input from processing streams that differ functionally, generating new patterns of stimulus responses not observed in VSNs.
A functional understanding of sensory integration in the AOS is lacking for a straightforward reason: there has never been a report of the sensory responses of AOB mitral cells to individual chemical compounds. Aside from technical barriers that have only recently been overcome12-14, the major impediment has been a lack of identified ligands exciting more than a small percentage of VSNs. Recently it was discovered that sulfated steroids, present in female mouse urine, activate VSNs; furthermore, a collection of synthetic sulfated steroids excited a large percentage of VSNs, exceeding the combined activity of previously-identified ligands by many-fold15. The effectiveness and diversity of synthetic sulfated steroid molecules makes them an attractive set of ligands to use to investigate the physiological principles of odorant encoding in the VNO and processing in the AOB.
We chose a battery of 12 synthetic sulfated steroids, including sulfated androgens, estrogens, pregnanolones, and glucocorticoids, and recorded spiking responses to these stimuli from VSNs and AOB mitral cells. 26% of VSNs responded to this battery, yet their responses clustered into just 8 common patterns, suggesting the sensory capacity of this VSN population focuses into a few functional “processing streams”. From AOB neuron responses to these stimuli, we identified several principles of sensory transformation. First, we observed enhanced signal-to-noise in the AOB neurons, a feature which may have aided detection of response patterns in AOB recordings that were near threshold in VSN recordings. Second, linear models suggested most AOB neurons are excited by a single VSN steroid processing stream; only 10% of neurons demonstrated multi-stream excitatory integration. However, an additional 14% of AOB neurons were co-activated by steroid processing stream(s) and urinary cues, suggesting some capacity for diverse functional integration. Finally, most steroids excited similar percentages of VSNs and AOB neurons, with the exception of sulfated estrogens, for which anterior AOB responses were rare. These results reveal major principles of organization in a behaviorally important, but little-explored, neural circuit.
Results
1) AOB neurons respond to synthetic sulfated steroids
There exist only a few reports of the sensory responses of mammalian AOB neurons13, 14, 16, 17, and none have examined responses to single compounds. We selected a group of 12 sulfated steroids15 including members of the androgen, estrogen, pregnanolone, and glucocorticoid families as a test battery for eliciting responses in AOB mitral cells (Fig. 1a; Supplementary Table 1). These 12 sulfated steroids were delivered to the lumen of the VNO at 10 μM while recording spiking activity from the external cellular layer8 (where mitral and tufted cells reside) of the anterior AOB in an ex vivo preparation14 (Fig. 1b).
Figure 1.
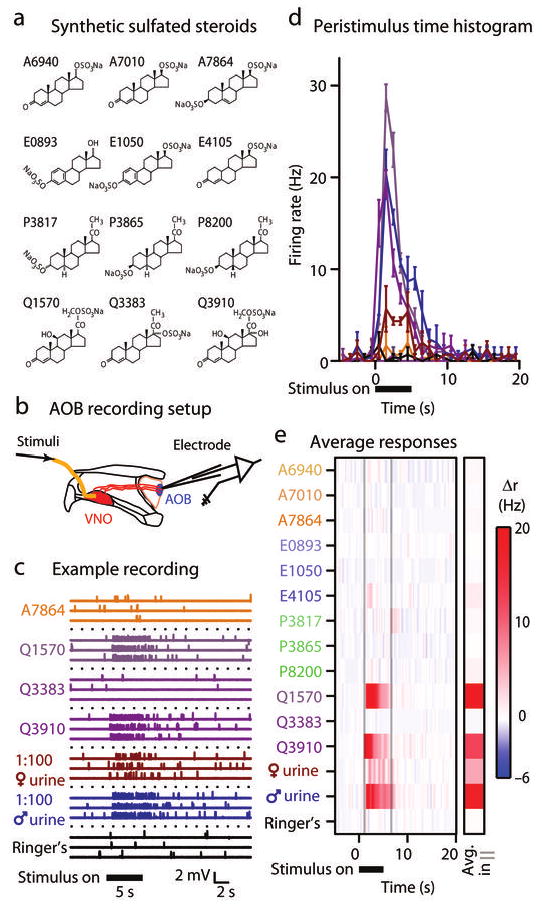
AOB cells respond strongly to sulfated steroids. (a) Structures of the 12 synthetic sulfated steroids used in our study, identified by their catalog number. (b) Ex vivo recording preparation. We isolated and maintained one hemisphere of the mouse skull containing the intact, connected VNO and AOB in a tissue chamber at 33-35° C. We made extracellular recordings from the AOB while delivering stimuli to the VNO. (c) Example extracellular voltage recording from a single cell in response to 4 of the 12 synthetic sulfated steroids used in the study (all at 10 μM), 1:100 dilute BALB/c female and male urine, and control Ringer's saline solutions. Responses to 3 presentations are shown for these stimuli. Upward ticks correspond to single action potentials. (d) Peristimulus time histogram from the same neuron. Solid horizontal bar shows time of stimulus delivery to the VNO. Error bars represent standard error of the mean across trials (6 trials per stimulus). (e) Colorized plot of the change in firing rate (Δr) during stimulus trials. The single column marked “Avg in | |” indicates the average change in firing rate inside the window between the faint vertical lines. This cell responded strongly to BALB/c male urine and two sulfated glucocorticoids (Q1570: corticosterone 21-sulfate; Q3910: hydrocortisone 21-sulfate) that differ in their structure only by a hydroxyl group at carbon 17.
AOB neurons responded to particular sulfated steroids as well as dilute urine stimuli, and the pattern of activity was reproducible across randomized, interleaved presentations (Fig. 1c). Firing rates closely tracked the time course of the stimulus (Fig. 1d, e). Cells typically displayed temporal modulation, reaching peak firing rates during the stimulus and decreasing with a variable time course. We recorded from 103 AOB cells in this study, encountering neurons that were excited by just one compound (Fig. 2a), neurons that were inhibited by multiple compounds (Fig. 2b), and neurons displaying a mix of excitation and inhibition (Fig. 2c) to different sulfated steroids. A few neurons were excited by diverse classes of steroids, including both 19-carbon (androgen) and 21-carbon (pregnanolone and glucocorticoid) steroids (Fig. 2d). In total, 58% (60/103) of the neurons encountered in the anterior AOB external cellular layer responded significantly to at least one test stimulus (Fig. 2e), and 41% (42/103) responded to sulfated steroids at 10 μM. 71% (30/42) of steroid-responsive AOB neurons responded significantly to two or more sulfated steroids (Fig. 2f), and 45% (19/42) co-responded to both urine and at least one sulfated steroid. These data further demonstrate the propensity of the sulfated steroid class to drive activity in the AOS.
Figure 2.
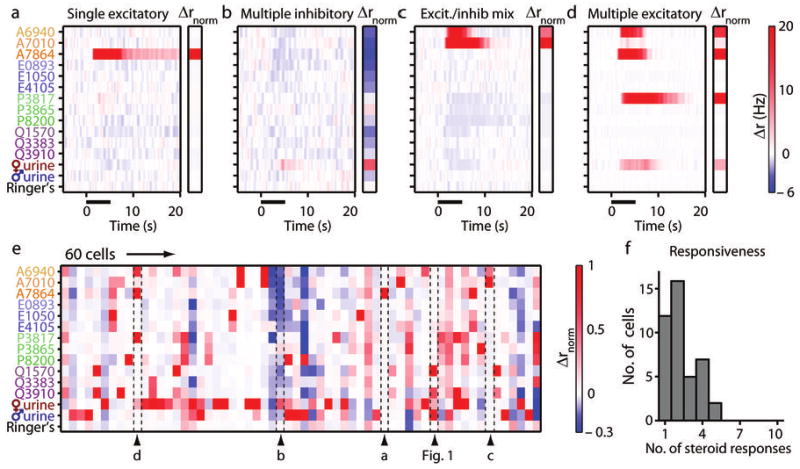
AOB cell population responses to synthetic sulfated steroids. (a-d) Colorized average Δr responses from 4 example AOB neurons. Stimulus presentation is marked by solid black bar. Insets to the right of each plot indicate the normalized Δr response (Δrnorm) of the neuron for each stimulus. The color scale for Δrnorm is shown to the right of panel e. (a) A cell that responded to a single sulfated androgen, A7864 (5-androsten-3β, 17β-diol disulfate). (b) A cell inhibited by several sulfated steroids with little excitatory input. (c) A cell strongly activated by A6940 (epitestosterone sulfate) and A7010 (testosterone sulfate), and broadly inhibited by other steroids and BALB/c female urine. (d) A cell that responded to the same compound as the cell in panel a, another 19-carbon sulfated steroid (A6940), and a 21-carbon sulfated steroid (P3817: allopregnanolone sulfate). (e) Δrnorm during the window from 1 to 6 seconds post-stimulus for the 60 responsive AOB neurons in this study. Labeled arrowheads indicate the position in the array of the cells shown in panels a-d and Figure 1. (f) Histogram of the total number of significant responses to sulfated steroids per cell (42 steroid-responsive AOB neurons total).
The range of response patterns indicated that AOB neurons have diverse chemical receptive fields. Lifetime sparseness, a metric that represents relative sharpness of molecular tuning18, indicated a bimodal distribution of tuning (Supplementary Fig. 1). The diverse activity patterns we observed in AOB neurons suggest that these cells may combine several types of inputs about different molecular features. However, without knowing how these molecules activate sensory input cells in the vomeronasal organ, it would be difficult to draw conclusions about how or whether the representation of sensory information changes due to processing in the bulb. We therefore sought to determine how molecular features of this battery of sulfated steroids are encoded by vomeronasal sensory neurons.
2) VSNs respond to sulfated steroids with higher variance
Using planar multi-electrode arrays, we isolated the spiking responses of individual VSNs during interleaved stimulation with the 12-steroid battery at 100 nM, 1 μM, and 10 μM (Fig. 3). Some VSNs responded to just one of the 12 compounds (Fig. 3a), while others responded to multiple compounds, with graded responses as a function of concentration (Fig. 3b). At 10 μM, many VSNs were activated strongly, and the resulting depolarization caused extracellular spike amplitudes to decrease in a way that prevented distinguishing later spikes from noise or from spikes fired by other cells (Supplementary Fig. 2). VSN responses were therefore quantified using a variable time window, where the boundaries of the time window are set by utilizing information about the response across concentrations (see Methods).
Figure 3.
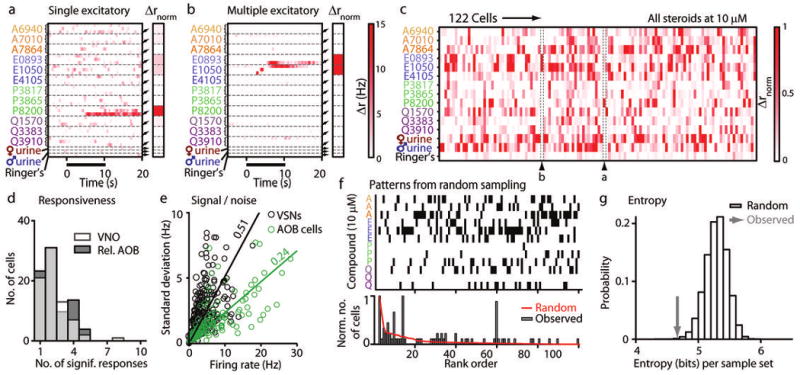
VSN population responses to synthetic sulfated steroids. (a-b) Colorized average Δr responses from 2 example VSNs to 3 concentrations of each steroid (100 nM, 1 μM, and 10 μM, from top to bottom within each dashed boundary). Stimulus presentation is marked by solid black bar. Insets indicate the Δrnorm response of the neuron to 10 μM steroids, male and female urine, and Ringer's control solution. (a) A cell that responded only to the sulfated pregnanolone, P8200. (b) A cell that responded to E0893 and E1050. (c) Colorized, Δrnorm for 122 responsive VSNs. Labeled arrowheads indicate the position in the array of the cells shown in panels a and b. (d) Histogram of the total number of significant responses to individual sulfated steroids at 10 μM per VSN (transparent white bars in foreground). The relative responsiveness histogram for AOB neurons from Figure 2f is re-plotted in gray in the background. (e) Plot of the response amplitude (abscissa) versus the standard deviation of that response across trials (ordinate) of all statistically significant VSN and AOB responses to stimulation (black and green circles, respectively). Solid lines indicate linear regression lines (VSN slope: 0.51; AOB slope: 0.24). (f) Comparison of observed binary response patterns with expectations from random sampling. Top: the most frequently expected binary response patterns in VSNs expected from random sampling (sorted by rank). Bottom: distribution of occurrences of each pattern above for simulated data (red trace) and observed data (filled gray bars). (g) Entropy of simulated (open bars) and observed data (gray arrow). The probability of encountering a data set with such a low entropy value is less than 10−3 by random sampling.
42% of sorted VSNs (122/293) responded significantly to at least one stimulus (including urine; Fig. 3c), and 26% (75/293) responded to at least one sulfated steroid at 10 μM. Similar to AOB neurons, 72% of VSNs responded to more than one sulfated steroid at 10 μM (54/75; Fig. 3d; p = 0.53, one-tailed, unpaired Student's t-test).
Comparing lifetime sparseness values between the two populations revealed little more about the nature of the information processing at this stage, perhaps due to a differential influence of trial-trial variability (Supplementary Fig. 1). Indeed, analysis of trial-trial signal-noise in our VSN population showed that VSN responses were more than two times as variable across trials as AOB responses (0.51 standard deviation/mean linear regression slope for VSNs vs. 0.24 for AOB neurons; Fig. 3e and Supplementary Fig. 3). We encountered higher variability in VSN responses compared to AOB responses at all integration windows and durations tested (Supplementary Fig. 3), suggesting the source of this variability is biological (not dependent on the specific firing rate metrics used). The increase in signal-noise in the AOB suggests that AOB mitral cells perform signal enhancement, a feature observed in other olfactory circuits19, 20.
3) VSN responses to sulfated steroids are stereotyped
VSNs express a single allele of one of the major families of vomeronasal receptors6, 7 so the response profiles of individual VSNs to the sulfated steroids in our battery should reflect the affinities of the expressed vomeronasal receptors. We therefore wondered whether we could identify any structure or pattern across the recorded VSN population (Fig. 3c). To evaluate this possibility, we first compared the observed collection of responses to a simulation in which a response was generated randomly according to the percentage of neurons responding to each odorant (Supplementary Table 1). In this particular analysis, we discarded the actual firing rate and instead represented each neuron/ligand pair as a yes/no response (Fig. 3f); this allowed us to catalog both observed and simulated responses into 212 = 4096 different bins.
In the actual data set, certain response patterns were observed much more frequently than expected by chance (Fig. 3f); similarly, other patterns that were common in a random model were absent in the observed data set. These apparent differences were evaluated statistically by computing a measure of the “disorder,” the entropy, for both the observed set of responses and 106 simulated data sets containing the same number of neurons (Fig. 3g). The observed data set was more ordered (entropy of 4.7 bits) than the simulated data sets (entropy 5.3 ± 0.2 bits, p < 0.001). The lower entropy indicates more structure to the observed population of responses than expected from probabilistic sampling; in particular, the observation that certain responses occurred repeatedly (Fig. 3f) suggested that the responses might be analyzed in terms of distinct types.
4) Identification of VSN functional processing streams
Normalized (analog) responses of 75 steroid-responsive VSNs at 10 μM were analyzed with an automated clustering algorithm (see Methods). The algorithm identified 8 clusters based on these activity patterns (Fig. 4a); all steroid-responsive VSNs were associated with one of the 8 clusters. Inspecting these clusters revealed several suggestive patterns connecting physiological response to steroid molecular identity (Fig. 4b). 5 of the 8 clusters involved strong responses to one or more androsten- or estradiol-based sulfated steroids (Fig. 4a). Collectively, these accounted for 64% (48/75) of the steroid-responsive VSNs. The high percentage of responses to these compounds, as well as the diversity of response profiles within this sub-class of molecules, indicate that VSNs express vomeronasal receptors capable of detecting small structural differences within these sulfated steroid sub-families (Fig. 4b). One cluster responded selectively to P8200 (epipregnanolone sulfate), one of 3 stereoisomers in our battery from the pregnanolone class of sulfated steroids (Fig. 4a, cluster 2). The two remaining clusters responded to sulfated glucocorticoids (Q1570 and Q3910, Fig. 4a, clusters 1 and 4), similar to neurons identified previously15. Within cluster 1 we observed multiple neurons that were co-activated by 1:100 dilute BALB/c female urine (Fig. 4a), and others that were insensitive. To acknowledge that these may represent unique populations, we split cluster 1 into a female urine-unresponsive and female urine-responsive subpopulations (cluster 1a and 1b, respectively). Among steroid-responsive neurons, no other cluster contained a substantial number of neurons responsive to 1:100 dilute BALB/c urine.
Figure 4.
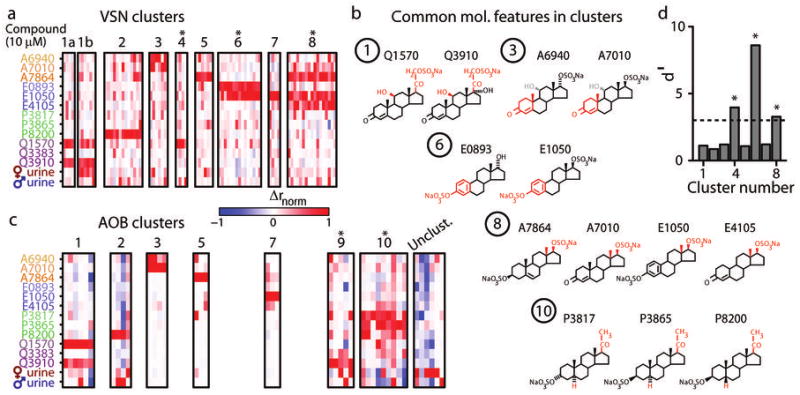
Sensory responses to sulfated steroids can be grouped into functional categories. (a) We identified 8 clusters of similar responsiveness to sulfated steroids at 10 μM identified in the VSN data set. We show normalized Δrmonotonic responses of the 75 steroid-responsive VSNs in their respective clusters. Asterisks indicate clusters we did not encounter in the AOB data set. Cluster 1 included several neurons that responded to 1:100 female mouse urine, and others that did not. As these may represent functionally separable populations, we separated them into urine-unresponsive (cluster 1a) and urine-responsive (cluster 1b) subgroups. (b) Molecular features that, for clusters 1, 3, 6, 8, and 10, distinguished active from inactive steroids. Common features are highlighted in red. The grayed groups in cluster 3 indicated that a distinguishing feature of steroids that activate neurons in this cluster is the lack of a hydroxyl group at carbon 13. (c) We identified clusters of responsiveness to sulfated steroids at 10 μM in the AOB neuron data set independently of the VSN cluster identities. We show Δrnorm responses of AOB neurons in their respective clusters. The “unclustered” region shows the neurons most associated with marginally-responsive neurons. Asterisks indicate clusters we did not encounter in the VSN data set. (d) Discriminability index (d′) comparing the steroid response patterns found in the VSN data set to the AOB data set along the first 3 linear discriminant eigenvectors. The dotted line indicates d′ = 3, corresponding to a high degree of separability. Asterisks indicate clusters not present in the AOB data set.
These commonly-observed patterns represent “processing streams,” and comprise the input received by neurons in the AOB. We therefore revisited our mitral cell recordings to investigate whether these patterns were maintained or modified in the AOB.
5) Identifying functional integration modes in the AOB
We studied information transformation from the defined VSN input types to AOB neurons using several complementary approaches. The primary analyses were cluster analysis and linear modeling (Fig. 4c-d and Fig. 5). We performed separate cluster analysis on the 42 steroid-responsive AOB neurons, revealing 7 distinct categories, 5 of which closely resembled patterns observed in VSNs (Fig. 4c). Projecting the AOB dataset onto the coordinate space defined by the first 3 linear discriminators for VSN clusters revealed that response patterns of AOB neurons with apparent VSN homologs (clusters 1, 2, 3, 5, and 7) were statistically indistinguishable from those defining the VSN clusters (Fig. 4d). AOB clusters, like VSN clusters, included some heterogeneity. However, comparison of intra- and inter-cluster Euclidean distances for these populations revealed no systematic difference in cluster tightness or separation (Supplementary Fig. 4). A straightforward explanation for the homologous VSN and AOB clusters might be that these AOB neurons act as “functional relay” neurons for these stimuli, effectively copying the stereotyped activity patterns identified in the VSN population.
Figure 5.
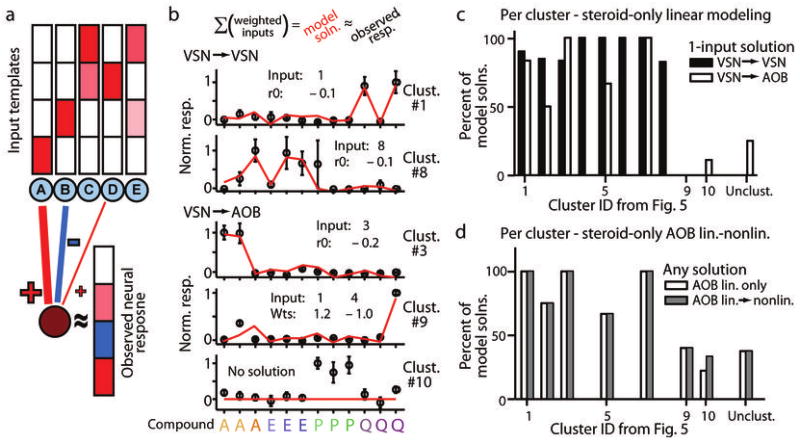
A linear integration model indicates most AOB neurons receive functional input from a single defined processing stream. (a) Model schematic. We supplied VSN cluster means as potential inputs to AOB cells. Hypothetical responses to 4 single molecules are shown above each hypothetical input template (blue circles labeled A-E). The maroon circle at the bottom represents a hypothetical observed AOB cell, and its response to all 4 single molecules is displayed to the right. We modeled AOB cell responses by adding one weighted template at a time until a fit reached our statistical criterion. Red hues indicate positive changes in firing rate, or an excitatory coupling, and blue hues indicate negative changes in firing rate, or an inhibitory coupling. (b) Examples of linear model solutions for two VSNs and three AOB cells. Open circles designate mean observed responses; error bars represent standard errors of the mean. The red line indicates the linear model solution with the fewest linear inputs. “Input” refers to the identity of the VSN input types (by cluster ID in Fig. 4a). “r0” refers to the linear offset. “Wts” refers to the linear weights assigned to respective inputs. (c) Percentage of linear modeling attempts for VSNs (filled bars) and AOB cells (open bars) that satisfactorily fit observed responses using a single template. Model performance is grouped by cluster number from Figure 4. (d) Percentage of linear and linear-nonlinear model attempts (open and gray bars, respectively) that successfully accounted for AOB response patterns with any number of inputs.
To test this hypothesis, we implemented a linear integration model (Fig. 5a) that attempted to reconstruct activation patterns of individual neurons using weighted linear inputs from the 8 VSN cluster means (Fig. 5b and Supplementary Fig. 5). For steroid-only modeling, clusters 1a and 1b were grouped together. Overall, the linear input model satisfactorily accounted for the steroid responses of 91% of VSNs using a single input, and 95% of VSNs overall, indicating that, once trial-to-trial variability of the responses is taken into account, individual VSNs were well-represented by the cluster means. Linear modeling of AOB steroid responses indicated that, in the five homologous clusters, 80% of the neurons (16/20) were well-modeled as receiving a single input from the corresponding VSN cluster (Fig. 5c), and we designated these neurons “functional relays” with respect to these stimuli. However, this analysis also confirmed that the homologous AOB clusters included some responses that differed from VSN cluster means. For example, the cell highlighted in Figure 2d (assigned to cluster 5 in Fig. 4c) was not adequately modeled by a single input from the corresponding VSN cluster mean. Cell responses that could not be explained by a single input are analyzed more thoroughly below.
We analyzed each of the AOB neurons in the emergent AOB clusters (clusters 9 and 10; Fig. 4c) using linear modeling. The first, cluster 9, had a steroid response pattern that was, in 2 of 5 cases, satisfactorily modeled by linear combination of one excitatory and one inhibitory input (from VSN cluster 1 and cluster 4, respectively; Fig. 5b). These cells and others that required integration from just one excitatory input in addition to one or more inhibitory inputs were designated “single integrators” to acknowledge that their responses were influenced by more than one identified processing stream.
The other emergent steroid-specific activity pattern observed in the AOB neural population (cluster 10, Fig. 4c) included broad pregnanolone responses, and did not appear to be derived from a recorded VSN population. Indeed, linear modeling failed to satisfactorily account for the steroid responses of a majority of the cells in this population (7/9 or 78%; Fig. 5d). Since AOB neurons perform signal/noise enhancement (Fig. 3e), we hypothesized that these AOB neurons may enhance responses not readily evident in the VSN recordings. We explored this possibility using three complementary approaches: inspection of VSN responses to sulfated steroids at expanded concentration ranges (Fig. 6a), linear-nonlinear modeling (Fig. 5d; see also Methods), and model residual analysis (Fig. 6b).
Figure 6.

Residuals of model fitting reveal input patterns missing in the VSN data set. (a) The AOB responses identified as cluster 10 showed excitation to multiple members of the pregnanolone class of steroids at 10 μM, but we did not observe such a response profile in VSNs at 10 μM. Investigation of VSN responses in a separate dataset revealed broad pregnanolone responses, shown on the log-linear plot, but only at concentrations > 10 μM. These neurons tended also to respond to 1:100 BALB/c female urine. The gray shaded region indicates the concentration range sampled in the main VSN dataset used for clustering analysis. (b) Cluster analysis of linear-nonlinear model fit residuals indicated 3 common patterns unaccounted for in the VSN input population (labeled A-C). Heat map indicates the power in the residuals for each of the 12 sulfated steroids, measured in terms of the ratio between the value and uncertainty (z-score).
If our VSN recordings missed a population of near-threshold pregnanolone responses, we hypothesized that the “missing” VSN patterns might be observed at concentrations greater than 10 μM. We therefore examined a separate set of experiments on VSNs in which we had co-applied at least 3 sulfated pregnanolones (including stereoisomers of those used in the main study) over a large range of concentrations (10−9 to 10−1 M; Fig. 6a). 4 of the 100 sorted VSNs displayed a pattern of activation reminiscent of the broad pregnanolone responses in AOB cluster 10 (3 of these 4 also responded to female urine; Fig. 6a). For these neurons, the threshold for a detectable pregnanolone response was essentially at 10 μM, the concentration used for comparing VSN and AOB neuron responses (Fig. 6a). Given these data, it seemed likely that the pregnanolone-responsive AOB neurons in cluster 10, perhaps as a result of signal/noise enhancement, identified a population of near-threshold VSN responses.
We examined whether these responses could be extracted from the main data set by adding a nonlinear gain term to the linear model. Despite its additional flexibility, this term was ineffective at increasing the number of satisfactory model solutions in cluster 10 (achieving just one additional satisfactory solution; Fig. 5d). The failure of a nonlinear model to account for the discrepancy further confirmed the apparent absence of a VSN cluster containing suitable pregnanolone responses. Further evidence was found in z-score residuals from linear-nonlinear modeling attempts, which suggested that the strongest deficit in the explanatory power of VSN cluster means was associated with the two sulfated pregnanolones not represented in cluster 2 (Fig. 6b). We concluded that AOB neurons sharing these residual patterns likely receive excitatory input from a pregnanolone-sensitive processing stream, making them likely “functional relays” or “single integrators” (in the absence or presence of inhibitory steroid responses, respectively). A third residual pattern was dominated by the sulfated androgen A7010 (testosterone sulfate). This residual pattern was, however, adequately modeled as receiving input from the mean of VSN cluster 3. This may indicate that VSN cluster 3 actually contains two subpopulations with different affinities for A6940 and A7010, but for which more VSNs would have been required to statistically justify separation into distinct clusters.
After considering the results from clustering, linear-nonlinear modeling, and residual analyses, 33 of the 42 AOB neural responses (78.5%) were classified as either functional relays or single integrators. The remaining 9 neurons remained without satisfactory model solutions for their sulfated steroid responses. Many of these neurons (5) had broad inhibitory responses to steroids and were not assigned to one of the AOB clusters (Fig. 4c); given the lack of information about these neurons' excitatory responsiveness, we did not assign them to any particular functional class. Finally, we identified 4 neurons that were either (a) best modeled as receiving more than one excitatory input or (b) best modeled with a single defined input and lacking a large excitatory component (Fig. 7a). These neurons represented 9.5% of the AOB population (4/42 neurons), and suggested that a small percentage of AOB neurons receive excitatory input from two or more of the steroid processing streams excited by our stimulus set. Because these cells were excited by multiple processing streams, we designated them “multi-integrators”.
Figure 7.
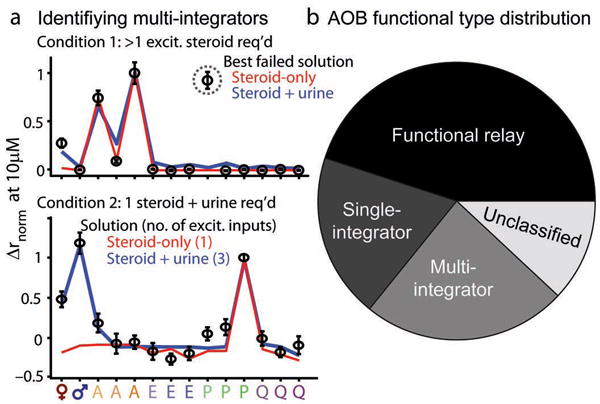
Summary of observed response patterns in AOB neurons. (a) Identification of “multi-integrator” AOB neurons receiving excitatory inputs from two or more processing streams. (top) Best unsuccessful linear-nonlinear model fitting for steroid-only (red trace) and steroid-plus-urine (blue trace) data. Open black symbols indicate the observed normalized firing rates; error bars represent standard errors of the mean. Neither attempt was able to account for the large excitatory response to P3817 (dotted gray circle). (bottom) Linear-nonlinear solutions for a cell identified as a “single integrator” by steroid-only fits (red trace) and as a “multi-integrator” when urine responses were included (blue trace). (b) Proportion of AOB neurons falling into four categories based on linear-nonlinear model results. “Unclassified” cells did not meet the criteria for classification in the three main categories.
6) Urine-and-steroid responses reveal more multi-integrators
Although 78.5% of AOB response patterns indicated exclusive excitatory integration from just one defined functional processing stream, many of these same neurons were co-excited by male and/or female mouse urine (Fig. 1 and Fig. 2d). In some cases (5 of 19 urine- and steroid-sensitive neurons), the urine responsiveness of the corresponding VSN processing stream predicted the AOB responses (Fig. 4a, cluster 1b, Fig. 6a), and therefore did not suggest any additional excitatory integration. Another 5 of the 19 were the “unclassified” neurons; because urine is a diverse ligand source, excitation by urine alone cannot distinguish single integrators from multi-integrators, and these neurons thus remained “unclassified”.
The remaining 9 urine- and steroid-sensitive neurons could not be explained by the urine responsiveness of the steroid-defined processing streams. 3 of these were already classified as multi-integrators based on their steroid responses, but the other 6 neurons had appeared as “functional relays” or “single integrators” by their steroid response patterns alone (Fig. 7a). Because their response patterns indicate integration from one defined processing stream in addition to unknown cues in urine, these 6 neurons are most appropriately designated “multi-integrators”. The final numbers of assigned functional types were 19 functional relay (45%), 8 single-integrator (19%), 10 multi-integrator (24 %), with 5 neurons (12%) remaining unclassified for lack of a clear excitatory steroid response (Fig. 7b).
7) Anterior AOB responses to estrogen sulfates are rare
Finally, perhaps the most surprising aspect of the VSN-AOB comparison was the apparent absence of anterior AOB responses corresponding to two prominent VSN types, clusters 6 and 8. The neurons in these two clusters, along with those in cluster 7, all responded to at least one sulfated estrogen. In the VSN population, these represented 48% of the responsive cells; we encountered only 5 sulfated estrogen-responsive cells in our AOB population (12%) (p < 10−6 assuming random sampling from the VSN population).
The relative lack of sulfated estrogen-sensitive neurons in the anterior AOB may have important implications for mouse accessory olfactory system function and its role in behavior. We analyze possible explanations for the absence of these response types in the anterior AOB in the discussion.
Discussion
These results represent the first use of individual compounds to study sensory processing in the AOB. We found that 12 sulfated steroids collectively excite a large percentage of cells in the VNO and AOB. We encountered the same response patterns repeatedly across recordings, allowing responses to the 12 steroids to be grouped into distinct processing streams. Because of these stereotyped response profiles, we were able to meaningfully compare sensory responses in VSNs with those of AOB neurons, yielding several new insights into the computations, and perhaps connectivity, of the AOB. The stereotypy of the recorded responses enabled a depth of analysis that has only recently become possible in the much longer-studied main olfactory bulb21-24. We expect that the stereotypy of response profiles in the accessory olfactory system will remain a powerful asset in future studies. Below we consider the main implications of these findings in greater detail.
1) VSN responses cluster into a few processing streams
Olfactory receptor neurons in several species are sensitive to multiple odorants20, 24-28, but the response properties of VSNs to many individual compounds have not yet been systematically investigated. We found evidence for both narrowly-tuned (Fig. 3a) and more broadly tuned VSNs (Fig. 3b-e). The responsiveness of many VSNs (Fig. 3c) indicates that vomeronasal receptors are sensitive to multiple sulfated steroids. This result confirms that vomeronasal receptors, like olfactory receptors in other systems, allow VSNs to represent odors using combinatorial codes. The most striking feature of the responses of the VSN population is its apparent structure: patterns of cross-stimulus responsivity were far from random (Fig. 3f-g). The precise form of organization was revealed most directly by a cluster analysis.
Because individual VSNs express one, or at most a few, vomeronasal receptors, the AOS has hundreds of molecularly distinct sensory neuron types4, 6, 7. However, it is possible that different receptor types have significantly-overlapping functional properties; for example, the ∼180 members of the V1R family have been grouped into just 12 defined sub-families29 based on amino acid sequence homology. We found that responses to the 12 sulfated steroids were highly stereotyped and could be clustered into just 8 distinguishable patterns. One interpretation of this result is that all the cells within the identified clusters express the same receptor type. Because these patterns account for the stimulus-selectivity of all steroid-responsive neurons, 26% of the recorded VSNs, this interpretation would require that a quarter of VSNs collectively express just 8 out of approximately 300 receptor types3. This is plausible in light of the observation that, in the main olfactory system, a few receptor types are expressed by a sizable percentage of sensory neurons30, 31. Alternatively, it is possible that a single identified processing stream includes multiple receptor types that have very similar ligand-binding properties. The small heterogeneity in several clusters (particularly in clusters 1, 2, 3, and 8; Fig. 4a) is consistent with this explanation. If this is the case, a yet-larger collection of VSN recordings might provide sufficient statistical evidence to justify splitting some of these into sub-clusters. Furthermore, we performed clustering on steroid responses at a fixed concentration (10 μM); it seems possible that a more extensive investigation of concentration-tuning may reveal functional differences among cells within a single cluster. To unambiguously determine whether these response clusters originate from a small number of receptor types or from much of the V1R family will ultimately require studies that match ligands to their receptors.
Whatever its underlying mechanism, the stereotypy of VSN responses has profound implications for our understanding of the downstream circuitry of the AOS. By comparison with the olfactory system of insects20, 32, fish33, and the main olfactory system in mammals23, 24 it is striking that the steroid-responsive VSNs, a quarter of the VSNs recorded in this study, have sensory properties that can be broadly classified into so few functional types. Given that there are on the order of 300 molecularly distinct VSN types, stimulation of ∼25% of these neurons might, in principle, reveal ∼75 unique response patterns. Thus, even if future studies provide evidence for sub-types among some of the 8 clusters identified here, it seems clear that much of the information about these stimuli can be captured by a relatively modest number of functional processing streams.
This stereotyped representation of olfactory information by VSNs is the main characteristic that permitted a detailed comparison of VSN and AOB sensory responses. While these results in no way obviate the importance of developing markers for particular cell types, we suspect that the mammalian AOS will prove to be unusually amenable to circuit dissection through careful analysis of responses to defined ligands.
2) Multi-stage analysis reveals principles of AOS processing
The AOB modifies the representation of sensory information from VSNs in several important respects. Most straightforwardly, AOB neurons encode sensory information with a signal-to-noise ratio that, on average, is more than two-fold higher than VSNs (Fig. 3e). The difference in trial-trial variability may partially derive from the difference in preparations, but was evident across several analytical approaches. One obvious biological explanation for this increase is averaging across the inputs from multiple VSNs; in this regard, the glomerular architecture of the AOB serves as a natural anatomic substrate. In theory, given N identical VSN inputs, an optimal encoder (in particular, one not constrained by spiking) could improve the signal-to-noise by a factor of . If we estimate (based on volume) ∼105 VSNs in the VNO, then each receptor type might be expressed by ∼300 VSNs on average. Thus, the number of VSNs is clearly more than adequate to account for the two-fold observed improvement in signal-to-noise. Incomplete sampling of the VSN input population, spike encoding, or other bottlenecks may account for the fact that noise reduction falls short of the ideal.
AOB mitral cells have been observed to be capable of integrating from multiple receptor types11, but it has been unclear whether the multiplicity of glomerular innervation results in a substantial functional broadening of excitatory receptivity. Using cluster analysis and linear-nonlinear modeling, we found that 64% anterior AOB neurons could be described as receiving excitatory input from a single steroid-defined input stream. Rare AOB neurons (4/42, 9.5%) required excitatory integration from multiple identified processing streams, and many of these neurons were sensitive to different classes of steroids. More evidence for excitatory integration came from AOB neurons that were co-excited by both urine and sulfated steroids, of which 6 were also likely multi-integrators, bringing the total number of these neurons to 10/42 (24%). The 4 multi-integrators identified by steroid responsiveness alone provide clearest evidence that some neurons integrate across broad classes of steroidal ligands; the 6 additional cells identified through their co-activation by steroids and urine might be further examples of integration of divergent molecular features, or alternatively might be due to unknown urinary sulfated steroids with similar structures to the pure ligands that also activated these neurons. A complete description of the nuances of mitral cell integration awaits more comprehensive identification of the molecules that comprise the AOS stimulus space.
These data provide the first direct physiological evidence of functional diversity among the AOB mitral cell population (Supplementary Fig. 6), complementing the dendritic diversity observed across several anatomical studies10, 11, 34. The prominence of apparent functional relays and single integrators in the anterior AOB suggests that most of these neurons contact glomeruli with similar chemical sensitivities. These neurons might correspond to those with “simple” or “strip type” dendritic connectivity patterns34 and possibly neurons sending dendrites to glomeruli labeled by the same or similar vomeronasal receptor types10, 11. The multi-integrator population, on the other hand, confirms the long-hypothesized mitral cell capacity for functional recombination, possibly as a consequence of direct excitatory input from distinct receptor types11.
Finally, it is noteworthy that two prominent clusters of VSN responses, both signaling the presence of estrogen-family compounds, are “missing” from our recorded responses in the anterior AOB (Fig. 4c). One interpretation of this result is that we did not target our recording electrodes to the part of the AOB responding to these stimuli; if so, these estrogen-responsive cells are localized in the AOB differently from other steroid-responsive cells, implying functional spatial organization in the AOB. Alternatively, it is possible that responses to these compounds are “masked” by circuit properties of the AOB. Given recent observations of disproportionate inhibition of male urine-selective mitral cells by compounds in female urine13, these may hint that sulfated estrogen-responsive pathways serve a largely inhibitory role in the AOB.
Methods
Solutions and stimuli
In all experiments, vomeronasal neurons were exposed to continuous superfusion with Ringer's saline solution, in which all urine and sulfated steroid stimuli were diluted to experimental concentrations. The composition of Ringer's solution was (in mM): NaCl 115, KCl 5, CaCl2 2, MgCl2 2, NaHCO3 25, HEPES 10, glucose 10. In experiments utilizing the ex vivo preparation described below, artificial cerebrospinal fluid (aCSF) was superfused directly over the exposed accessory olfactory bulb and vomeronasal axons. The composition of aCSF was (in mM): NaCl 125, KCl 2.5, CaCl2 2, MgCl2 2, NaHCO3 25, NaH2PO4 1.25, myo-inositol 3, Na-pyruvate 2, Na-ascorbate 0.4, glucose 25. We purchased all chemicals from Sigma (St. Louis, MO) unless otherwise noted.
We collected BALB/c male and female urine from ∼30 individual mice of both sexes for 5 consecutive days by flash-freezing fresh urine in liquid nitrogen as described previously12. Frozen urine pellets were passed through a wire mesh to remove large particles, and later thawed, pooled, and centrifuged at 500-1000 rpm for 2 minutes to remove large particles. Urine was aliquoted in small volumes and stored at −80 °C until dilution into oxygenated Ringer's solution immediately prior to each experiment.
We purchased sulfated steroid compounds (Table 1) from Steraloids, Inc. (Newport, RI) and stored them at −20 °C in solid form. 100 mM stock solutions of all steroids were made using methanol or water as the solvent and stored at 4 °C until dilution into oxygenated Ringer's solution immediately before each experiment. We included 0.01% methanol in each stimulus solution as a vehicle control.
Animals and ex vivo tissue preparation
The Washington University Animal Studies Committee approved all procedures. Male B6D2F1 mice aged 8-12 weeks postnatal were used in all experiments. Prior to dissections, mice were anesthetized with isofluorane and decapitated. For AOB recordings, we prepared the tissue for ex vivo recording as described previously14. We isolated a single hemisphere of the anterior, dorsal mouse skull containing one bony capsule of the vomeronasal organ and connected ipsilateral AOB in oxygenated, ice-cold aCSF containing an additional 7 mM MgCl2 to limit excitotoxicity. The preparation was adhered to a small delrin plastic plank with tissue adhesive, then placed into a custom-designed physiology chamber. The tissue was superfused with oxygenated, room-temperature aCSF while the septal cartilage, septal bone, and blood vessels overlaying the AOB were carefully removed, exposing the vomeronasal axons and AOB surface to the superfusion solution. We attached a small polyimide cannula (0.0056″ inner diameter, A-M Systems Inc., Carlsborg, WA, USA) to a pneumatic stimulus-delivery device (AutoMate, Berkeley, CA, USA) and inserted the open end into the lumen of the VNO. Oxygenated Ringer's-based solutions were pumped constantly into the VNO at 0.2-0.3 mL/min. During the 4-6 hour recording periods, warmed (33-35 °C), oxygenated aCSF was superfused at a constant rate of ∼8 mL/min.
For VSN recordings, we dissected the vomeronasal epithelium away from the VNO and basal lamina, placing its basal layer on a planar multi-electrode array (MEA) with 60 microelectrodes arranged in two groups of 6×5 spaced 30 μm apart35. A continuous stream of oxygenated, warmed Ringer's solution was directed at the neuroepithelium at 3 mL/min. for the 4-5 hour duration of the experiments. Each minute, the flow of Ringer's was substituted with a 0.5 mL pulse of stimulus using a microinjection robot (Gilson, Middleton, WI, USA). A total of 39 mice were utilized to acquire these data, with 24 for AOB experimental preparations and 15 for VSN experimental preparations.
Electrophysiology
We made AOB recordings using single glass electrodes with 4-8 MΩ tip resistance similar to previous studies13, 14. Microelectrodes were filled with filtered aCSF and advanced into the AOB from the dorsal surface using a micromanipulator (Siskiyou Design Instruments, Grants Pass, OR). Distance from the point of entry was measured with a digital micrometer attached to the micromanipulator (Siskiyou). We frequently encountered AOB cells with large positive-polarity spikes and complex waveforms (with multiple peaks and/or points of inflection) between 200-400 μm from the AOB surface13. Recordings were made between 150 and 400 μm from the AOB surface, consistent with the boundaries of the external cellular layer8 in which mitral cells and their dendrites reside. Voltages were amplified with an extracellular head stage attached to a dual-mode amplifier (Dagan, Minneapolis, MN, USA), high pass filtered at 30 Hz, and digitized using an analog-digital converter (National Instruments, Austin, TX, USA). Stimuli were delivered in randomized, interleaved blocks using custom acquisition software, and a precise analog copy of stimulus valve opening and closing times was recorded in separate acquisition channels to insure synchronization. Stimuli were delivered to the VNO lumen for 5s, which we found to be sufficient to elicit strong responses in AOB neurons (Fig. 1).
VSN signals were acquired with a planar MEA (Multichannel Systems, Reutlingen, Germany), amplified (Multichannel Systems), and digitized (National Instruments). We controlled robotic stimulus delivery using custom multichannel recording software15. As with AOB recordings, we recorded the stimulus timing in a dedicated channel.
We analyzed extracellular recordings to extract single-unit activity. AOB neurons were sorted as described previously13, 14; VSN waveforms were sorted using a multichannel template algorithm36 modified to allow simultaneous (rather than sequential-greedy) waveform fitting (T.E. Holy, data not shown). To be included in the analysis, single units had to have separable waveforms and evident refractory periods.
Statistical and firing rate analysis
We grouped the spike times of sorted waveforms from AOB recordings by stimulus identity and aligned them so that time 0 corresponded to valve opening (Fig. 1c). For heat-map representations of the peristimulus time histogram (PSTH), spike times were grouped in 100 ms bins (10 Hz) and low pass filtered at 1 Hz (Fig. 1e). We summarized the responses of mitral cells to each stimulus by computing the average change in firing rate above spontaneous levels in the time window beginning 1 second post stimulus onset and ending 1 second post stimulus offset (Δr).
We similarly aligned spike times of sorted waveform peaks from VSN recordings. Because intense stimulation can lead to a large decrease in VSN spike amplitude (sometimes down to the noise level of the recordings, see Supplementary Fig. 2), firing rate could not always be determined from extracellular recordings at later times of the response, particularly at the highest concentrations. Consequently, Δr was computed using a time window that was fixed at its onset (set to be one second prior to the earliest response of any cell in the preparation to any stimulus, typically 1-2 s after valve opening), but variable in its duration (for significant responses, most frequently 2.5-3.5 s, median 6.4 s). The length of the averaging window was set to maximize the total change in firing rate, subject to the constraint that the end points had to decrease monotonically with concentration. We call the resulting metric Δrmonotonic; it will be described in detail elsewhere (H.A. Arnson et al, unpublished data).
The criteria chosen for determining statistical significance were Wilcoxon rank sum test p < 0.05 compared to Ringer's controls and Δrmonotonic (VSNs) or |Δr| (AOB neurons) > 1 Hz. We used Wilcoxon rank sum tests to determine statistical significance (p < 0.05) unless otherwise indicated.
Calculating the entropy of VSN responses
For entropy analysis, we converted VSN responses to all sulfated steroids at 10 μM to binary signals (1 = responsive, 0 = nonresponsive; see Fig. 3g). We simulated a population of 105 neurons with the same statistical probability of responding to each of the 12 ligands as our observed dataset (Supplementary Table 1). To calculate entropy, we used the same probabilistic sampling method to simulate 106 datasets of the same size as our VSN dataset (75 responsive neurons). The Shannon entropy, H, was calculated as described37:
where
n is the number of unique binary response patterns
and
pi is the probability of observing a response to the ith compound.
Statistical probability was determined by comparing the Shannon entropy of the observed dataset with the cumulative probability of achieving the value in the simulated set.
Neural response pattern classification through clustering
We analyzed neuronal responses with an automated clustering algorithm based on mean shift38, modified to allow the smoothing radius to depend upon the local uncertainty about mean shift step size (T. E. Holy, unpublished data). The clustering algorithm was used to identify patterns in cell responses across all sulfated steroids at 10 μM. We selected neurons achieving statistical significance at the p < 0.1 level (i.e. responsive neurons plus a marginally-responsive group) for initial clustering. All combinations of 6 of the 12 sulfated steroids were passed through the clustering algorithm independently, and clustering results from each combination were tallied in a similarity matrix. Cells that frequently appeared together in clustering trials were thus assigned maximum similarity. Final cluster identities were assigned by using the same algorithm on multidimensional scaling (11-dimensional) of the similarity matrix. Following clustering, we removed marginally-responsive cells (all cells with 0.05 < p < 0.1) from subsequent analysis. Responsive cells that were associated with clusters of marginally-responsive cells were designated as “unclustered”. All 75 responsive VSNs (Wilcoxon rank sum test p < 0.05) were assigned to one of the 8 clusters shown in Figure 4a. In the AOB population, 8 of the 42 responsive cells (19%) were “unclustered”.
To determine whether the differences seen in clustering between the VSN and AOB cell populations were based on identifiable differences in the data sets, we calculated a discriminability index (d′) based on linear discriminant analysis (LDA). AOB data were projected along the first three LDA eigenvectors chosen for the VSN dataset, We computed the centroid of each VSN cluster using Gaussian mixture modeling, then calculated the Euclidean distances between an equal number of VSNs and AOB neurons (typically 3-5 per cluster) and the centroids We then converted distances to z-scores by normalizing by the standard deviation for each dimension. And calculated statistical separation between the AOB and VSN data using d′ analysis (Fig. 4d).
Linear and linear-nonlinear integration models
We designed a linear integration model that constructs normalized firing rate responses ri for all stimuli (12 sulfated steroids at 10 μM) from a weighted linear sum of normalized template responses. Our linear input equation was:
where
r0 is a scalar firing rate offset
Rij is the response to the ith stimulus of input template j
wj is the scalar weight assigned to input template j
For each responsive neuron, we normalized the responses to a unit magnitude, then sought wj for the 8 VSN clusters identified in Figure 4a (with the steroid responses of clusters 1a and 1b pooled for modeling purposes) that best accounted for the responses across all stimuli. The model considered all possible combination of 8 inputs, taken one at a time (255 minimizations per observed cell). We chose the weighted χ2 algorithm as our minimization function:
where
ci is the observation c to the ith stimulus
and
σi is the standard error of a cell's normalized responses to stimulus i
σ0 is the greater of 0.3 units and the root mean square of the cell's across-trial standard errors (normalized units)
The σ0 term was introduced to avoid underestimates of variance (resulting in unreasonably small denominators), given that standard errors were calculated from only 5-6 trials and the number of overall observations (the product of the number of cells and number of stimuli) was in the hundreds. 0.3 units was used as the alternative minimum σ0 for equal percentages of VSN-VSN and VSN-AOB modeling attempts (84 and 83%, respectively). We evaluated each model attempt by comparing goodness of fit measures to the χ2 cumulative distribution function for N−(2+m) degrees of freedom. Because the σ0 term reduces the probability of model rejection (1–p) we chose only to accept model solutions that could be rejected as poor fits at the (1–p) < 0.05 level. To reduce the potential for over-fitting, we accepted model solutions for each neuron with the fewest number of linear inputs satisfying this criterion. Tests with simulated data mimicking the characteristics of real AOB responses demonstrated that this procedure virtually eliminated over-fitting (which occurred 20% of the time if the best fit was chosen, but only 0.6% of the time if the satisfactory model with fewest inputs was chosen). This necessarily increased the false negative rate, but only resulted in a 7% increase in the median z-score residual power (from 8% to 15%). In other words, the signals missed by choosing the lowest-order solution instead of the best overall solution were minor compared to the overall signal.
For linear-nonlinear models, we modified the linear model to include a nonlinear component:
where
s(y) is the “sign” of y
x0 is a scalar offset term bounded between −0.5 and +0.5
and
γ is a scalar exponent between 0.2 and 5.
The nonlinear model allowed linear responses to be thresholded and modulated by the exponent to best fit the observed pattern of responses. We evaluated goodness of fit using the χ2 cumulative distribution function for N−(3+m) degrees of freedom. Examples of linear model fits are presented in Supplementary Figure 5. In cases where our acceptance criterion was not reached, we identified the best fit attempt as the fit with the lowest (1–p) value. Examples of best rejected linear-nonlinear fits are presented in Figure 7a.
Supplementary Material
Acknowledgments
We acknowledge the generous support of the G. Harold and Leila Y. Mathers Foundation (TEH), the U.S. National Institute for Deafness and Other Communication Disorders (R01DC005964, R01DC010381, TEH; F32DC009352, JPM) and the W. M. Keck Foundation (JPM). We thank Daniel Kerschensteiner and the anonymous referees for comments and suggestions, and all members of the Holy laboratory for helpful feedback.
Footnotes
Author contributions: J.P.M. performed all experiments and analyses involving the AOB and most of the VSN recordings. H.A.A. performed and analyzed experiments presented in Fig. 6 that investigated sulfated pregnanolones over large concentration ranges. J.P.M. and T.E.H. wrote the manuscript.
References
- 1.Dulac C, Kimchi T. Neural mechanisms underlying sex-specific behaviors in vertebrates. Curr Opin Neurobiol. 2007;17:675–683. doi: 10.1016/j.conb.2008.01.009. [DOI] [PMC free article] [PubMed] [Google Scholar]
- 2.Keller M, Baum MJ, Brock O, Brennan PA, Bakker J. The main and the accessory olfactory systems interact in the control of mate recognition and sexual behavior. Behav Brain Res. 2009;200:268–276. doi: 10.1016/j.bbr.2009.01.020. [DOI] [PubMed] [Google Scholar]
- 3.Touhara K, Vosshall LB. Sensing odorants and pheromones with chemosensory receptors. Annu Rev Physiol. 2009;71:307–332. doi: 10.1146/annurev.physiol.010908.163209. [DOI] [PubMed] [Google Scholar]
- 4.Martini S, Silvotti L, Shirazi A, Ryba NJ, Tirindelli R. Co-expression of putative pheromone receptors in the sensory neurons of the vomeronasal organ. J Neurosci. 2001;21:843–848. doi: 10.1523/JNEUROSCI.21-03-00843.2001. [DOI] [PMC free article] [PubMed] [Google Scholar]
- 5.Rodriguez I, Del Punta K, Rothman A, Ishii T, Mombaerts P. Multiple new and isolated families within the mouse superfamily of V1r vomeronasal receptors. Nat Neurosci. 2002;5:134–140. doi: 10.1038/nn795. [DOI] [PubMed] [Google Scholar]
- 6.Belluscio L, Koentges G, Axel R, Dulac C. A map of pheromone receptor activation in the mammalian brain. Cell. 1999;97:209–220. doi: 10.1016/s0092-8674(00)80731-x. [DOI] [PubMed] [Google Scholar]
- 7.Rodriguez I, Feinstein P, Mombaerts P. Variable patterns of axonal projections of sensory neurons in the mouse vomeronasal system. Cell. 1999;97:199–208. doi: 10.1016/s0092-8674(00)80730-8. [DOI] [PubMed] [Google Scholar]
- 8.Larriva-Sahd J. The accessory olfactory bulb in the adult rat: a cytological study of its cell types, neuropil, neuronal modules, and interactions with the main olfactory system. J Comp Neurol. 2008;510:309–350. doi: 10.1002/cne.21790. [DOI] [PubMed] [Google Scholar]
- 9.Ramón y Cajal S. Histology of the nervous system of man and vertebrates. Oxford University Press; New York: 1995. [Google Scholar]
- 10.Del Punta K, Puche A, Adams NC, Rodriguez I, Mombaerts P. A divergent pattern of sensory axonal projections is rendered convergent by second-order neurons in the accessory olfactory bulb. Neuron. 2002;35:1057–1066. doi: 10.1016/s0896-6273(02)00904-2. [DOI] [PubMed] [Google Scholar]
- 11.Wagner S, Gresser AL, Torello AT, Dulac C. A multireceptor genetic approach uncovers an ordered integration of VNO sensory inputs in the accessory olfactory bulb. Neuron. 2006;50:697–709. doi: 10.1016/j.neuron.2006.04.033. [DOI] [PubMed] [Google Scholar]
- 12.Holekamp TF, Turaga D, Holy TE. Fast three-dimensional fluorescence imaging of activity in neural populations by objective-coupled planar illumination microscopy. Neuron. 2008;57:661–672. doi: 10.1016/j.neuron.2008.01.011. [DOI] [PubMed] [Google Scholar]
- 13.Hendrickson RC, Krauthamer S, Essenberg JM, Holy TE. Inhibition shapes sex selectivity in the mouse accessory olfactory bulb. J Neurosci. 2008;28:12523–12534. doi: 10.1523/JNEUROSCI.2715-08.2008. [DOI] [PMC free article] [PubMed] [Google Scholar]
- 14.Meeks JP, Holy TE. An ex vivo preparation of the intact mouse vomeronasal organ and accessory olfactory bulb. J Neurosci Methods. 2009;177:440–447. doi: 10.1016/j.jneumeth.2008.11.013. [DOI] [PMC free article] [PubMed] [Google Scholar]
- 15.Nodari F, et al. Sulfated steroids as natural ligands of mouse pheromone-sensing neurons. J Neurosci. 2008;28:6407–6418. doi: 10.1523/JNEUROSCI.1425-08.2008. [DOI] [PMC free article] [PubMed] [Google Scholar]
- 16.Luo M, Fee MS, Katz LC. Encoding pheromonal signals in the accessory olfactory bulb of behaving mice. Science. 2003;299:1196–1201. doi: 10.1126/science.1082133. [DOI] [PubMed] [Google Scholar]
- 17.Zhang JJ, Huang GZ, Halpern M. Firing properties of accessory olfactory bulb mitral/tufted cells in response to urine delivered to the vomeronasal organ of gray short-tailed opossums. Chem Senses. 2007;32:355–360. doi: 10.1093/chemse/bjm005. [DOI] [PubMed] [Google Scholar]
- 18.Willmore B, Tolhurst DJ. Characterizing the sparseness of neural codes. Network. 2001;12:255–270. [PubMed] [Google Scholar]
- 19.Duchamp-Viret P, Duchamp A, Vigouroux M. Amplifying role of convergence in olfactory system a comparative study of receptor cell and second-order neuron sensitivities. J Neurophysiol. 1989;61:1085–1094. doi: 10.1152/jn.1989.61.5.1085. [DOI] [PubMed] [Google Scholar]
- 20.Bhandawat V, Olsen SR, Gouwens NW, Schlief ML, Wilson RI. Sensory processing in the Drosophila antennal lobe increases reliability and separability of ensemble odor representations. Nat Neurosci. 2007;10:1474–1482. doi: 10.1038/nn1976. [DOI] [PMC free article] [PubMed] [Google Scholar]
- 21.Fletcher ML, Wilson DA. Olfactory bulb mitral-tufted cell plasticity: odorant-specific tuning reflects previous odorant exposure. J Neurosci. 2003;23:6946–6955. doi: 10.1523/JNEUROSCI.23-17-06946.2003. [DOI] [PMC free article] [PubMed] [Google Scholar]
- 22.Davison IG, Katz LC. Sparse and selective odor coding by mitral/tufted neurons in the main olfactory bulb. J Neurosci. 2007;27:2091–2101. doi: 10.1523/JNEUROSCI.3779-06.2007. [DOI] [PMC free article] [PubMed] [Google Scholar]
- 23.Fantana AL, Soucy ER, Meister M. Rat olfactory bulb mitral cells receive sparse glomerular inputs. Neuron. 2008;59:802–814. doi: 10.1016/j.neuron.2008.07.039. [DOI] [PubMed] [Google Scholar]
- 24.Soucy ER, Albeanu DF, Fantana AL, Murthy VN, Meister M. Precision and diversity in an odor map on the olfactory bulb. Nat Neurosci. 2009;12:210–220. doi: 10.1038/nn.2262. [DOI] [PubMed] [Google Scholar]
- 25.Bozza T, McGann JP, Mombaerts P, Wachowiak M. In vivo imaging of neuronal activity by targeted expression of a genetically encoded probe in the mouse. Neuron. 2004;42:9–21. doi: 10.1016/s0896-6273(04)00144-8. [DOI] [PubMed] [Google Scholar]
- 26.Wachowiak M, Cohen LB. Correspondence between odorant-evoked patterns of receptor neuron input and intrinsic optical signals in the mouse olfactory bulb. J Neurophysiol. 2003;89:1623–1639. doi: 10.1152/jn.00747.2002. [DOI] [PubMed] [Google Scholar]
- 27.Friedrich RW, Korsching SI. Combinatorial and chemotopic odorant coding in the zebrafish olfactory bulb visualized by optical imaging. Neuron. 1997;18:737–752. doi: 10.1016/s0896-6273(00)80314-1. [DOI] [PubMed] [Google Scholar]
- 28.Hallem EA, Carlson JR. Coding of odors by a receptor repertoire. Cell. 2006;125:143–160. doi: 10.1016/j.cell.2006.01.050. [DOI] [PubMed] [Google Scholar]
- 29.Del Punta K, et al. Deficient pheromone responses in mice lacking a cluster of vomeronasal receptor genes. Nature. 2002;419:70–74. doi: 10.1038/nature00955. [DOI] [PubMed] [Google Scholar]
- 30.Tsuboi A, et al. Olfactory neurons expressing closely linked and homologous odorant receptor genes tend to project their axons to neighboring glomeruli on the olfactory bulb. J Neurosci. 1999;19:8409–8418. doi: 10.1523/JNEUROSCI.19-19-08409.1999. [DOI] [PMC free article] [PubMed] [Google Scholar]
- 31.Grosmaitre X, et al. SR1, a mouse odorant receptor with an unusually broad response profile. J Neurosci. 2009;29:14545–14552. doi: 10.1523/JNEUROSCI.2752-09.2009. [DOI] [PMC free article] [PubMed] [Google Scholar]
- 32.Stopfer M, Jayaraman V, Laurent G. Intensity versus identity coding in an olfactory system. Neuron. 2003;39:991–1004. doi: 10.1016/j.neuron.2003.08.011. [DOI] [PubMed] [Google Scholar]
- 33.Friedrich RW, Laurent G. Dynamics of olfactory bulb input and output activity during odor stimulation in zebrafish. J Neurophysiol. 2004;91:2658–2669. doi: 10.1152/jn.01143.2003. [DOI] [PubMed] [Google Scholar]
- 34.Yonekura J, Yokoi M. Conditional genetic labeling of mitral cells of the mouse accessory olfactory bulb to visualize the organization of their apical dendritic tufts. Mol Cell Neurosci. 2008;37:708–718. doi: 10.1016/j.mcn.2007.12.016. [DOI] [PubMed] [Google Scholar]
- 35.Holy TE, Dulac C, Meister M. Responses of vomeronasal neurons to natural stimuli. Science. 2000;289:1569–1572. doi: 10.1126/science.289.5484.1569. [DOI] [PubMed] [Google Scholar]
- 36.Segev R, Goodhouse J, Puchalla J, Berry MJ., 2nd Recording spikes from a large fraction of the ganglion cells in a retinal patch. Nat Neurosci. 2004;7:1154–1161. doi: 10.1038/nn1323. [DOI] [PubMed] [Google Scholar]
- 37.Shannon CE. A Mathematical Theory of Communication. Bell System Technical Journal. 1948;27:379–423. 623–656. [Google Scholar]
- 38.Comaniciu D, Meer P. Mean shift: A robust approach toward feature space analysis. IEEE Transactions on Pattern Analysis and Machine Intelligence. 2002;24:603–619. [Google Scholar]
Associated Data
This section collects any data citations, data availability statements, or supplementary materials included in this article.