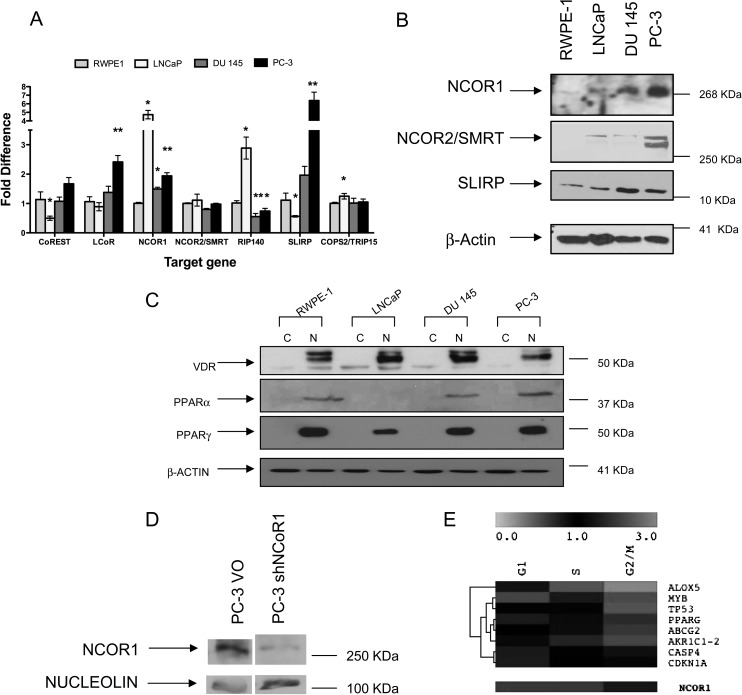
Fig. 2.
Corepressor expression and manipulation in prostate cancer cell lines. Panel (A) differences in corepressor mRNA levels, compared with 18S expression, measured by quantitative real time plolymerase chain reaction in PC-3 and DU 145 cells compared with RWPE-1 cells. Each data point represents the mean of three separate experiments amplified in triplicate wells ±SEM (*P < 0.05, **P < 0.01). Panel (B) total cell proteins were subjected to western immunoblotting. The corepressors are indicated on the left with β-actin used as a control. Panel (C) nuclear and cytoplasmic cell proteins were subjected to western immunoblotting. The NRs are indicated on the left with β-actin used as a control. Panel (D) NCOR1 protein expression levels measured in PC-3 shNCOR1 or empty vector (PC-3 VO). Panel (E) heatmap representation of the significant expression changes through the cell cycle in red (upregulated) and green (downregulated) in PC-3 shNCOR1 compared with PC-3 VO cells. Triplicate biological samples were extracted and analyzed in duplicate and significant expression changes calculated (as measured by one-way analysis of variance analyses P < 0.05). The gene names are indicated on the right. The reduced levels of NCOR1 are indicated underneath.

