Abstract
The osmotic and scattering properties of hyaluronan-based composite hydrogels composed of stiff biopolymer chains (carboxymethylated thiolated hyaluronan (CMHA-S)) crosslinked by a flexible polymer (polyethylene glycol diacrylate (PEGDA)) are investigated and analyzed in terms of the scaling theory. The total pre-gel polymer weight concentration is varied between 0.5 wt.% and 3.2 wt.%, while the mole ratio between the reactive PEG chain ends and the thiolated HA moieties is changed between 0.15 and 1.0. The shear modulus G of the fully swollen gels exhibits a stronger dependence on pre-gel concentration than on the crosslink density. Osmotic deswelling measurements reveal that the osmotic mixing pressure depends on the weight ratio CMHA-S/PEGDA, and is practically unaffected by the pre-gel concentration. Small-angle neutron scattering observations indicate that the thermodynamic properties of these composite gels are governed by total polymer concentration, i.e., specific interactions between the two polymeric components do not play a significant role.
Keywords: elasticity, biopolymer, hydrogel, swelling pressure, osmotic modulus
1. Introduction
Native hyaluronan (HA) is an ultrahigh molecular weight charged linear polysaccharide that is virtually invisible to the body’s immune system. It serves many important physiological roles, such as a lubricant within the synovial fluid and as an osmotic agent within the extracellular matrix [1]. Because of its unique biocompatibility and structure, HA and its derivatives are already used in a number of clinical applications, and many more have been proposed, including tissue engineering, wound healing, surgical adhesion protection, drug delivery, and soft tissue augmentation [2–3]. For many of these in vivo biomedical applications, it is useful to be able to crosslink native HA into gels. This can be accomplished by photoinitiation of a crosslinking reaction after injection of chemically-modified HA with a photoinitiator [4], or by premixing and injecting modified reactive HA molecules with a crosslinker designed to induce HA gelation after a suitable induction period (5–10 minutes). Here we focus on the latter approach, as developed by Shu and co-workers [5]. These authors found that linear HA chains of moderate molecular weight (≈ 200 kDa) can be used to formulate aqueous solutions that have relatively low viscosity as needed for injection and yet have a suitable induction period for gelation (≈10 min). The HA chains are made reactive by thiolating carboxylic acid groups in HA, and then forming crosslinks between thiolated carboxylic acid groups using polyethylene glycol (PEG) with reactive acrylate groups at each chain end. In addition to being useful for tissue engineering applications [5] and vocal cord augmentation [6], this system is also scientifically interesting because the gel is a complex composite containing approximately equal amounts of stiff charged carboxymethylated thiolated hyaluronan (CMHA-S) chains (persistence length ≈ 4–15 nm [7]) and flexible uncharged polyethylene glycol diacrylate (PEGDA) chains (persistence length ≈ 0.4 nm [8]). An important unanswered question is whether or not simple network models developed for flexible polymer gels [9] can describe the mechanical and swelling behavior of these complex systems. To address this question, we measure the elastic modulus G and the osmotic modulus KT for nine different gel formulations obtained by varying the mole ratio between reactive crosslinker chain ends and thiols between 0.15 and 1.0, and varying the pre-gel polymer concentration between 0.5 wt% and 3.2 wt%. We also use SANS technique to determine the structure of these complex gels over a wide range of length scales. The values of G and KT strongly affect the range of potential tissue engineering applications. For example, it is now well documented that a scaffold designed to support tissue growth of a certain type should have an elastic modulus value that approximately matches that of the native tissue [10]. This may range from 102 Pa for nerve tissue to 106 Pa for connective tissue. The osmotic modulus, which is a measure of the pressure required to squeeze water out of a gel, is particularly important for HA-containing hydrogels designed to replace tissues that cushion mechanical forces within the body. As far as we know, the osmotic modulus value has not been reported before for injectable CMHA-S based gels. In addition, there have been no previous reports of the influence of the pre-gel CMHA-S concentration, which we find has a stronger effect on the elastic shear modulus than does the crosslinker mole ratio.
2. Theory
Unconfined neutral hydrogels swell until the total change in free energy, ΔFtot, reaches a minimum or, equivalently, until the chemical potential of each mobile species becomes equal in the coexisting phases. The mixing of water with the polymer chains makes a negative contribution to the free energy (ΔFmix), while the stretching of the hydrogel network makes a positive contribution (ΔFel). Assuming these terms are independent, we can write [11–13]:
| (1) |
In the case of charged polymers such as HA the ions also contribute to ΔFtot. However, several experimental studies on highly swollen polyelectrolyte hydrogels (e.g., polyacrylic acid gels, DNA gels) [13–14] as well as molecular dynamics simulations [15] indicate that in the presence of large amount of added salt (e.g., in buffer) their osmotic behavior can be reasonable approximated by the simple expression derived for neutral polymer gels.
In an osmotic swelling experiment the measurable quantities involve derivatives of the free energy, i.e.
| (2) |
where Πtot is the swelling pressure of the gel, Πmix and Πel are the mixing and elastic contributions of Πtot, respectively, V1 is the molar volume of solvent (water), and n1 is the number of moles of water. At swelling equilibrium with the pure solvent Πtot must equal zero. One can study nonzero values of the total swelling pressure by equilibrating the hydrogel with an osmotic stressing agent of known osmotic pressure [13–14].
The osmotic modulus KT is defined by:
| (3) |
where C is the weight fraction of polymer in the hydrogel.
3. Experimental Methods
3.1 Gel Preparation
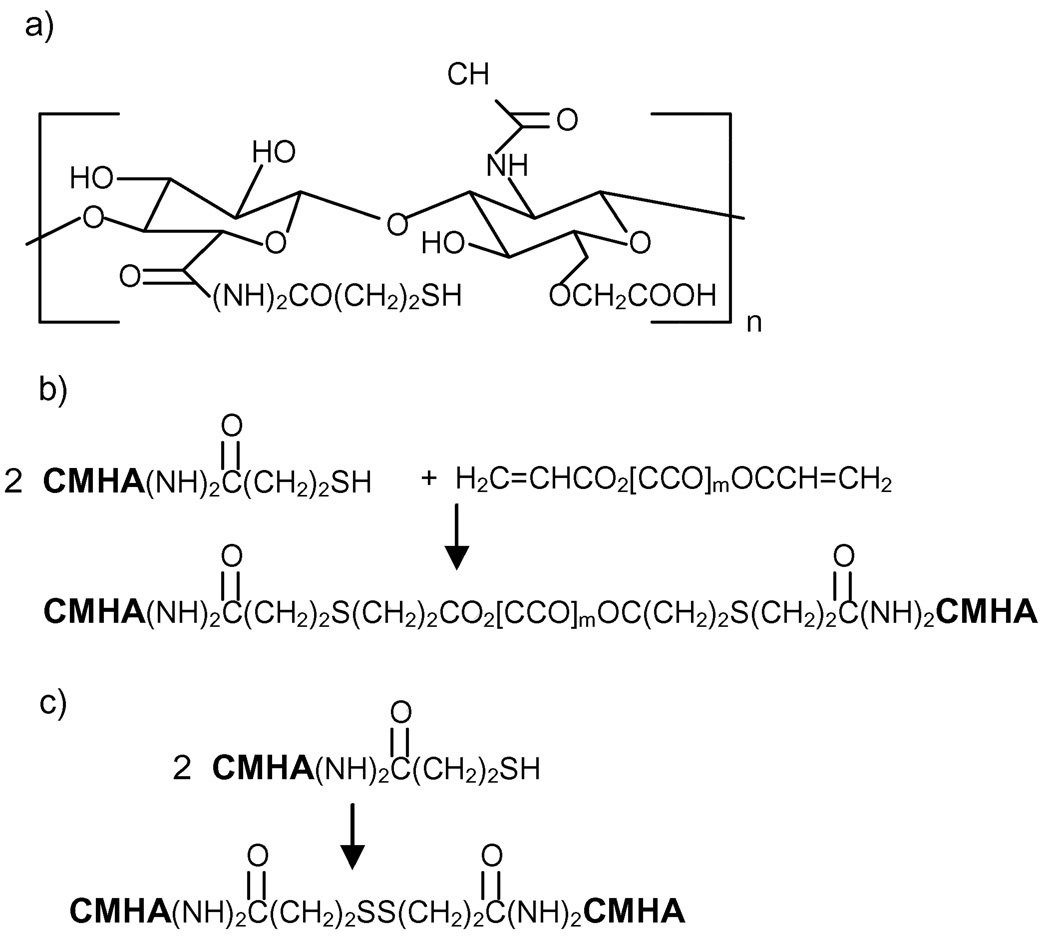
HA biopolymer with a backbone molecular weight of approximately 200 kDa and modified with thiol groups to make it crosslinkable was prepared by Glycosan Biosystems, Inc., Salt Lake City, Utah following a similar reaction procedure as in Reference 5. In brief, the repeat group of HA is a disacharide containing D-glucuronic acid and N-acetyl-D-glucosamine, with one pendant carboxylic acid group in D-glucuronic acid. In order to increase the number of sites available for crosslinking, an additional carboxylic acid group was attached to each glucosamine unit. The primary hydroxyl group in glucosamine was deprotonated by pH adjustment (pH > pKa), and then reacted with chloroacetic acid to obtain the additional carboxylic acid group. Both carboxylic acid groups in the modified HA repeat unit were then available for thiolation via reaction with 3-thiopropanoyl hydrazide, with the degree of thiolation measured using a modified Ellman method [5]. The resulting HA derivative, denoted as CMHA-S, has the repeat unit shown in Figure 1(a). The crosslinker molecule, polyethylene glycol diacrylate (PEGDA) consists of a linear PEG backbone having a molecular weight of 3500 Da with one acrylate group attached to each chain end [5,16]. PEGDA rapidly crosslinks CHMA-S (within 10 minutes) following the reaction scheme shown in Figure 1(b). Even in the absence of PEGDA, CMHA-S crosslinking will occur in the presence of oxygen due to disulfide linkage formation (Figure 1(c), [16–17]). However, the rate of the disulfide crosslinking reaction is slow compared to the PEGDA crosslinking reaction [16].
Figure 1.
Crosslinking reaction scheme showing a) repeat unit of CMHA-S, b) rapid crosslinking of CMHA-S by PEGDA, and c) slow disulfide crosslinking of CMHA-S that occurs in the presence of oxygen.
Cylindrical hydrogel specimens were cast at room temperature in a Teflon® mold of thickness 1 cm and diameter 1 cm. Aqueous solutions containing the PEGDA and CMHA-S were mixed in an adjustable-volume pipette for 30 s to give the pre-gel polymer concentrations listed in Table 1 and then rapidly injected into the mold. For each pre-gel CMHA-S concentration value, the weight ratio PEGDA/CMHA-S was varied between 0.25 to 1.66 giving a reactive functional group mole ratio (acrylate to thiolated carboxylic acid) that varied between 0.15 to 1.0. Since the thiol-acrylate reaction rate is strongly pH sensitive, the crosslinking reaction was carried out at pH = 7.4. To ensure complete crosslinking the samples were kept in closed containers for two weeks before measurements.
TABLE 1.
Composition of hyaluronan hydrogels studied
| Designatio n |
CMHA-S concentration in pre-gel solution (wt%) |
CMHA- S/PEGDA weight ratio in pre-gel solution |
Qa | Ga (Pa) |
|---|---|---|---|---|
| 1/1 | 0.4 | 1/0.25 | 217 | 85 |
| 1/2 | 0.4 | 1/1 | 107 | 270 |
| 1/3 | 0.4 | 1/1.66 | 74 | 610 |
| 2/1 | 0.8 | 1/0.25 | 73 | 740 |
| 2/2 | 0.8 | 1/1 | 43 | 1960 |
| 2/3 | 0.8 | 1/1.66 | 31 | 3380 |
| 3/1 | 1.2 | 1/0.25 | 52 | 1500 |
| 3/2 | 1.2 | 1/1 | 32 | 3570 |
| 3/3 | 1.2 | 1/1.66 | 23 | 6220 |
Measured at zero swelling pressure.
3.2. Osmotic swelling measurements
The reference environmental solution (infinite bath) was chosen to be phosphate-buffered saline (PBS) solution at 25 °C with ionic strength 0.15 M and pH = 7.4. Hydrogels of known dry mass md were equilibrated with this reference solution, at which point gel swelling pressure Πtot must equal zero. Deswelling of the gels was achieved by enclosing them in a semipermeable membrane (dialysis bag, seamless cellulose tubing; cut off molecular weight: 12 kDa, Sigma Chemical Co., St. Louis, MO). Known concentrations of an osmotic deswelling agent [poly(vinyl pyrrolidone), PVP, Mn = 29 kDa] were added to the environmental solution, and equilibrated with the gel for 8 – 10 days. The semipermeable membrane prevented penetration of PVP into the gel. At equilibrium, the swelling pressure Πtot of the gel inside the dialysis bag is equal to the known osmotic pressure of the PVP solution outside [18]. Periodically the mass of the gel mg was measured, and used to calculate the total polymer weight fraction C = md/mg, with hydrogel swelling ratio Q ≈ 1/C. Equilibrium was achieved when no further changes in either gel swelling degree or solution composition were detectable. The gels samples were dried at 95 °C. First, the mass of the salt-containing gel was measured. Then the gel was soaked in large excess of distilled water to remove the salt. The swelling ratio was calculated by correcting the measured mass with the known amount of salt.
Reversibility was checked by transferring gels into PVP solutions at different osmotic pressure values.
3.3. Elastic (shear) modulus measurements
Shear modulus data of fully gelled materials were obtained from uniaxial compression measurements using a TA.XT2I HR Texture Analyser (Stable Micro Systems, UK). As discussed in a standard rubber testing handbook [19], torsional measurements of the shear modulus G of fully-gelled polymers will be erroneous if sample “slip” occurs at the interface between the solid polymer and the steel rheometer plates, because then the true value of the shear strain exerted on the sample will be unknown. Hence the standard rubber testing handbook recommends lubricating the sample interface to ensure that sample slip does occur, and then determining G in the absence of “barrel” distortion by measuring the force needed to apply compressive strains (uniaxial) on the sample [19].
Equilibrated gel samples were rapidly transferred from the dialysis bag into the TA XT21 HR apparatus, which measures the compressive deformation (precision: ± 0.001 mm) as a function of an applied force (precision: ± 0.01 N). Stress-strain isotherms were determined at 25 °C in about 3–5 minutes with no detectable change in gel weight. The absence of sample volume change and barrel distortion was confirmed, and stress-strain isotherms were found to fit the Mooney-Rivlin relation [12, 20–21]
| (4) |
where σ is the nominal stress (related to the undeformed cross-section of the gel), Λ is the deformation ratio (Λ̣= L/Lo, L and Lo are the lengths of the deformed and undeformed specimen, respectively), and C1 an C2 are constants. The stress-strain data were determined in the range of deformation ratio 0.7 < Λ̣< 1.0. The value of C2 proved to be negligibly small for the gel systems studied. In this situation, the constant C1 can be identified with the shear modulus (G) of the swollen network.
The swelling and mechanical measurements were carried out at 25 ± 0.1 °C. Repeated measurements showed a mean change in the osmotic swelling pressure and elastic modulus less than 2–3%.
3.4. Small-angle Neutron Scattering
SANS measurements were made on gels on the NG3 30 m instrument [13] at the National Institute of Standards and Technology (NIST, Gaithersburg MD). Gel samples were prepared in solutions of heavy water in 2 mm thick sample cells. The sample cell consisted of 1 mm thick quartz windows separated by a 2 mm thick spacer. The beam diameter was 20 mm. The measurements were made at three sample-detector distances, 1.3 m, 4 m and 13.1 m, with incident wavelength 8Å. The explored wave vector range was 0.003 Å−1 ≤ q ≤ 0.2 Å−1, and counting times from twenty minutes to two hours were used. The total counts of neutron at the detector varied in the range 0.5–3 million. After radial averaging, corrections for detector response and cell window scattering were applied. The neutron scattering intensities were calibrated using NIST absolute intensity standards. The incoherent background was subtracted following the procedure described in reference 22. All experiments were carried out at 25 ± 0.1°C.
4. Results and discussion
4.1. Mechanical measurements and osmotic pressure observations
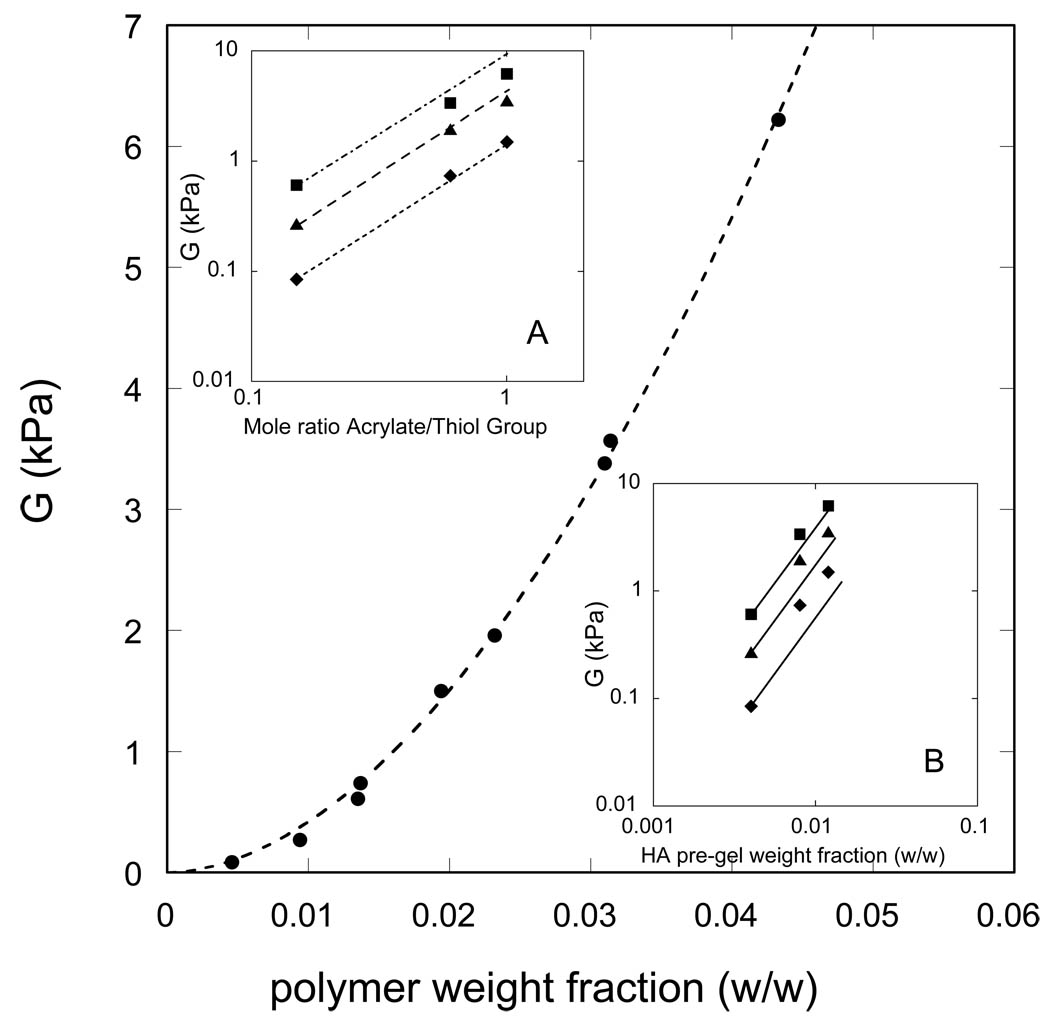
In Figure 2, the shear modulus G is plotted against the total weight fraction of polymer in the fully-swollen hydrogel for each of the nine compositions synthesized (Table 1). Each hydrogel has been equilibrated against the reference environmental solution (PBS buffer), hence the swelling pressure Πtot is zero. As shown in the insets to the figure, the value of G increases with increase in mole ratio of crosslinker (at fixed CMHA-S pre-gel concentration), and with increase in CMHA-S pre-gel concentration (at fixed crosslinker mole ratio). In inset A, the data lies below a line of slope one, indicating that some of the reactions between acrylate and thiolated HA moieties are either incomplete or do not produce crosslinks that contribute to the elastic modulus, i.e., the efficiency of the crosslinking process decreases with increasing crosslinker mole ratio. In inset B, the data lies above the continuous lines that have a slope of two, indicating that the dependence of G on CMHA-S pre-gel concentration is stronger than quadratic. The origin of the strong dependence of G on pre-gel CMHA-S concentration is most likely trapped interchain physical entanglements. Physical entanglements are primarily detected via rheological measurements. For example, solutions of high molecular weight polymer chains exhibit gel-like behavior even in the absence of crosslinking reactions, which is indirect evidence for the presence of physical entanglements. At long times, these physical entanglements are eliminated in un-crosslinked systems by diffusion of the polymer chains along their contour lengths. However, when covalent crosslinking occurs in a polymer solution that is already physically entangled, then the physical entanglements become trapped and make a permanent contribution to G. Experimental evidence for the importance of pre-gel polymer concentration and trapped interchain physical entanglements on the G value of acrylamide-based hydrogels has been reported by Baker et al. [23], and for thiolated chitosan gels crosslinked by PEGDA by Teng et al. [17]. The intermediate time plateau shear modulus of a physically-entangled gel is usually observed to scale as approximately the second power of the polymer concentration. [24]. The theoretical lines shown in inset B have slope of 2.0, which the value based on the simple idea that physical entanglements are random point contacts between two chains. This simple theory appears to underestimate the observed concentration dependence. According to de Gennes [25,26] the concentration dependence of the plateau modulus for neutral polymers in good solvent conditions is given by G ~ c2.3, while in a theta solvent G ~ c7/3 as discussed by Colby and Rubinstein [27,28]. The more advanced scaling theories do a better job of representing the experimental data in inset B.
Figure 2.
Elastic (shear) modulus vs. total polymer weight fraction in the fully-swollen hydrogel; the experimental error of these measurements is comparable to the size of the symbols. Top inset: dependence of G on crosslinker mole ratio for fully-swollen hydrogels synthesized at pre-gel CMHA-S concentrations of 0.4 wt.% (diamonds), 0.8 wt.% (triangles), and 1.2 wt.% (squares). For each pre-gel CMHA-S concentration, the line drawn through the lowest data point has a slope of one as expected for 100 % crosslinking efficiency. Bottom inset: dependence of G on CMHA-S pre-gel concentration for fully-swollen hydrogels synthesized at acrylate/thiol group mole ratios of 0.15 (diamonds), 0.60 (triangles), and 1.0 (squares). For each mole ratio, the line drawn through the lowest data point has a slope of two, as predicted by the simple theory that an entanglement is a random point contact between chains.
In Figure 2, the G values given were measured for each hydrogel in equilibrium with PBS buffer, i.e., Πtot = 0. One observes that under these conditions, all of the fully-swollen hydrogels contain at least 95% water. However, by placing a hydrogel on one side of a dialysis membrane, and by placing an osmotic stressing agent on the other side of the membrane, one can force the hydrogel to adopt a smaller swelling ratio at which the swelling pressure Πtot is greater than zero.
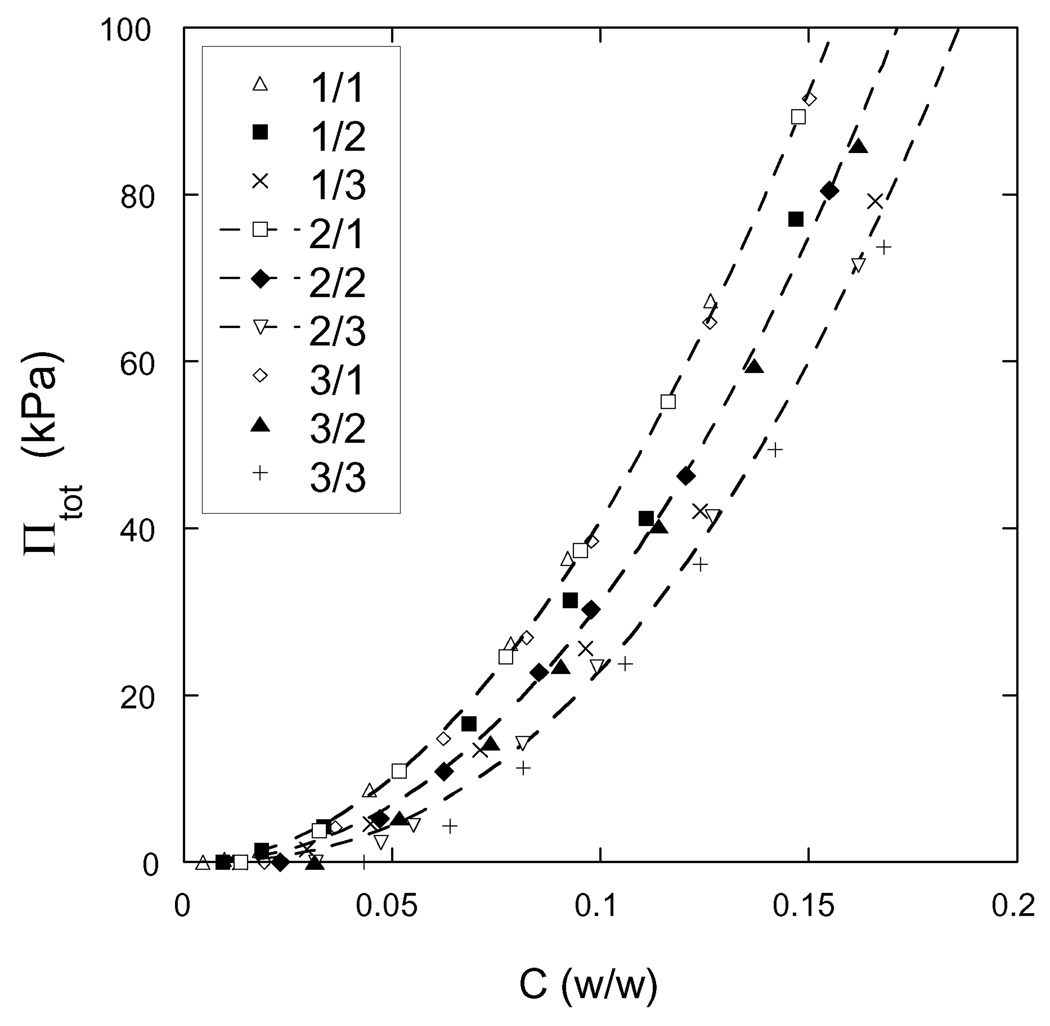
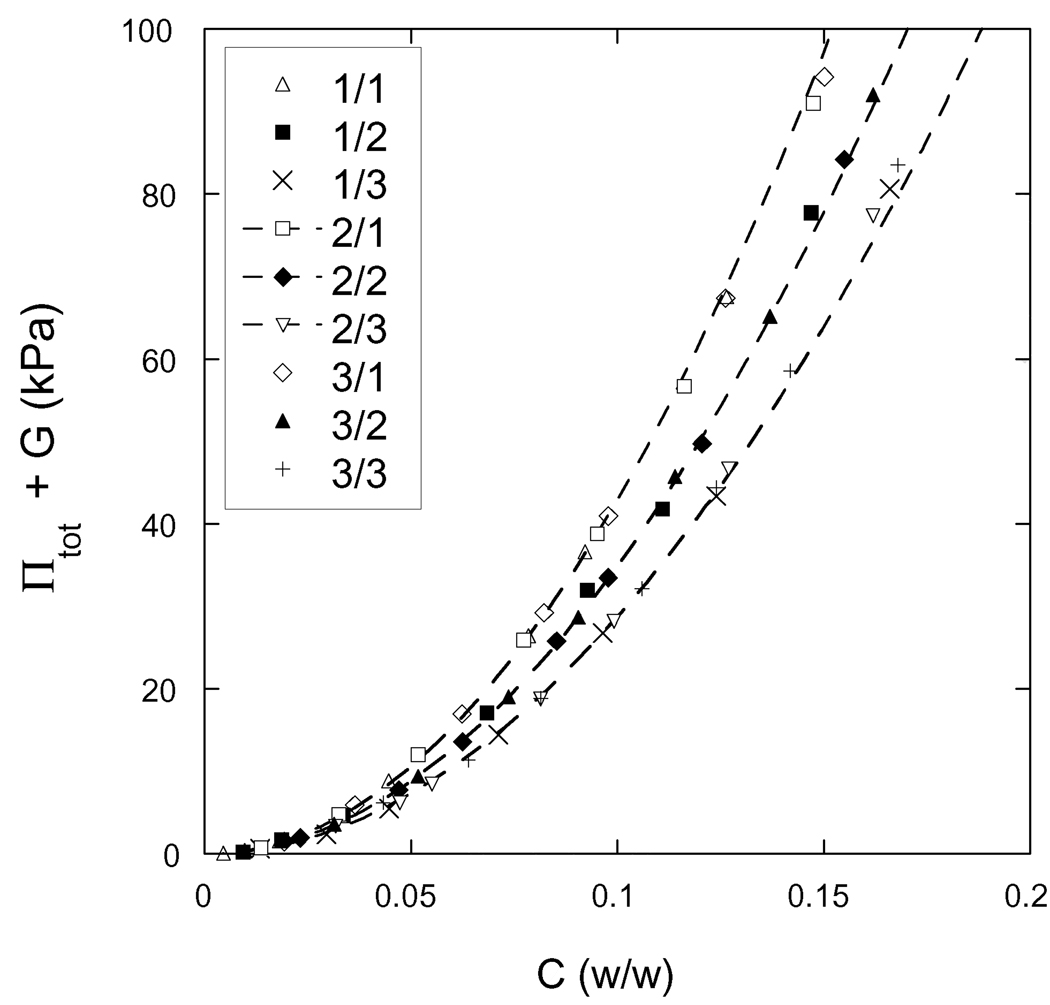
The results of the osmotic deswelling experiments are shown in Figure 3 where the swelling pressure Πtot is plotted against the total polymer weight fraction C for each of the nine different samples. For each hydrogel, it takes at least 60 kPa of pressure to reduce the water content to 85 wt%. It is also apparent that the behavior of gels prepared with the same crosslinker ratio is practically independent of the initial polymer concentration.
Figure 3.
Osmotic swelling pressure vs. total weight fraction of polymer for each of the nine hydrogels synthesized. The designation of each hydrogel, as defined in Table 1, is given in the legend. The dashed curves are drawn as a guide to the eyes and connect gels of the same crosslinker mole ratio. The experimental error of these measurements is comparable to the size of the symbols.
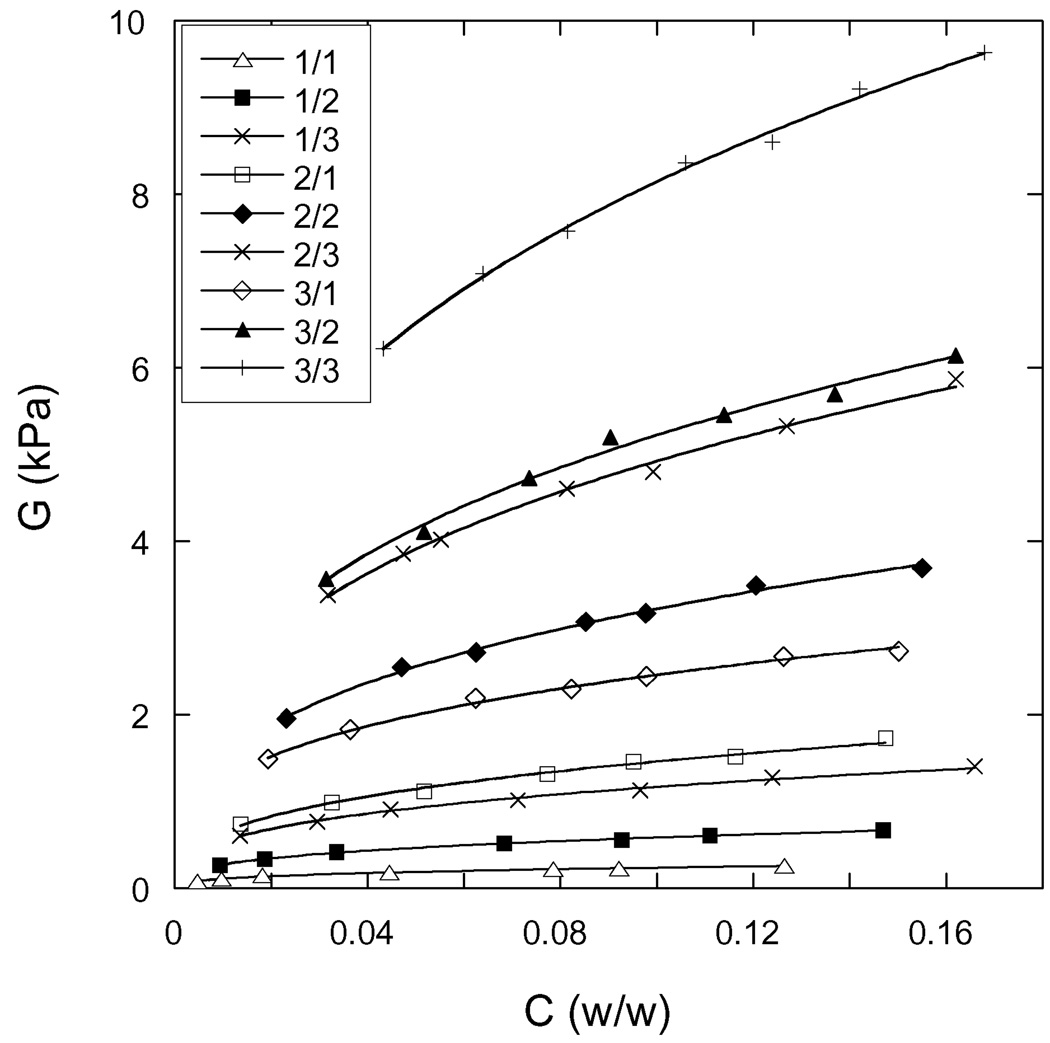
According to Equation (2), Πtot is the sum of a mixing contribution Πmix and an elastic contribution Πel. The elastic contribution is usually taken to be the negative of the shear modulus G [11], which was independently measured as a function of C (see Experimental). Figure 4 shows the variation of the shear modulus as a function of the total polymer concentration for the hydrogels.
Figure 4.
Elastic shear modulus G vs total weight fraction of polymer in the hydrogels. The designation of each hydrogel, as defined in Table 1, is given in the legend. The continuous lines through the data points are least squares fits to Equation 5.
It can be seen that the concentration dependence of G is satisfactorily described by the scaling law
| (5) |
Where B is a constant depending on both the CMHA-S/PEGDA weight ratio (crosslink density) and the CMHA-S concentration in the pregel solution. The best-fit values of the pre-factor B and the exponent n are listed in Table 2. The exponent n is close to one-third as predicted by the Flory-Rehner theory [11]. The experimental values of n are consistent with previous observations made on different synthetic and biopolymer gels [13, 29–31].
Table 2.
Scaling Parameters for G
| Hydrogel Designation | B (kPa) | n |
|---|---|---|
| 1/1 | 0.49 | 0.32 |
| 1/2 | 1.24 | 0.32 |
| 1/3 | 2.57 | 0.34 |
| 2/1 | 3.96 | 0.36 |
| 2/2 | 6.93 | 0.33 |
| 2/3 | 10.71 | 0.34 |
| 3/1 | 4.84 | 0.29 |
| 3/2 | 11.18 | 0.33 |
| 3/3 | 17.15 | 0.32 |
The mixing contribution to the osmotic swelling pressure Πmix was obtained by adding the measured G and Πtot values (see Equation 2). In Figure 5, the mixing pressure Πmix is plotted against the total weight fraction of the polymer for all samples. In semidilute polymer solutions, the mixing pressure is expected to obey a scaling relation [9]
| (6) |
where A and m are constants. For flexible chains m ≅ 2.3 (good solvent condition) and m = 3 (theta condition). The best-fit values of the prefactor A and the exponent m are given in Table 3.
Figure 5.
Osmotic mixing pressure vs. total weight fraction of polymer in the hydrogel, for each of the nine hydrogels synthesized. The designation of each hydrogel, as defined in Table 1, is given in the legend. The dashed curves are drawn as a guide to the eyes and connect gels of the same crosslinker mole ratio. The experimental error of these measurements is comparable to the size of the symbols.
Table 3.
Scaling Parameters for Πmix
| Hydrogel Designation | A (kPa) | m |
|---|---|---|
| 1/1 | 3830 | 1.95 |
| 1/2 | 3553 | 1.99 |
| 1/3 | 3210 | 2.05 |
| 2/1 | 3782 | 1.94 |
| 2/2 | 3524 | 2.01 |
| 2/3 | 3237 | 2.05 |
| 3/1 | 3796 | 1.95 |
| 3/2 | 3486 | 1.99 |
| 3/3 | 3252 | 2.06 |
The data shown in Figure 5 and Table 3 illustrate that
the mixing pressure is primarily governed by the polymer/crosslinker (CMHA-S/PEGDA) ratio, and
at constant polymer/crosslinker ratio Πmix is independent of the polymer concentration in the pre-gel solution.
Equation (3) is the defining equation of the osmotic modulus KT, which is a measure of the resistance of the gel to de-swelling under pressure. This quantity can be calculated using Equation (3) in conjunction with the best-fit values of the parameters appearing in Equations (5) and (6).
Combining Equations (5) and (6) we have
| (7) |
At equilibrium with the pure solvent (or salt solution) Πtot = 0 and C = Ce (where Ce is the polymer concentration of the fully swollen gel). Thus, B = A Cem-n and we get
| (8) |
From Equations 7 and 8 the osmotic modulus is given as
| (9) |
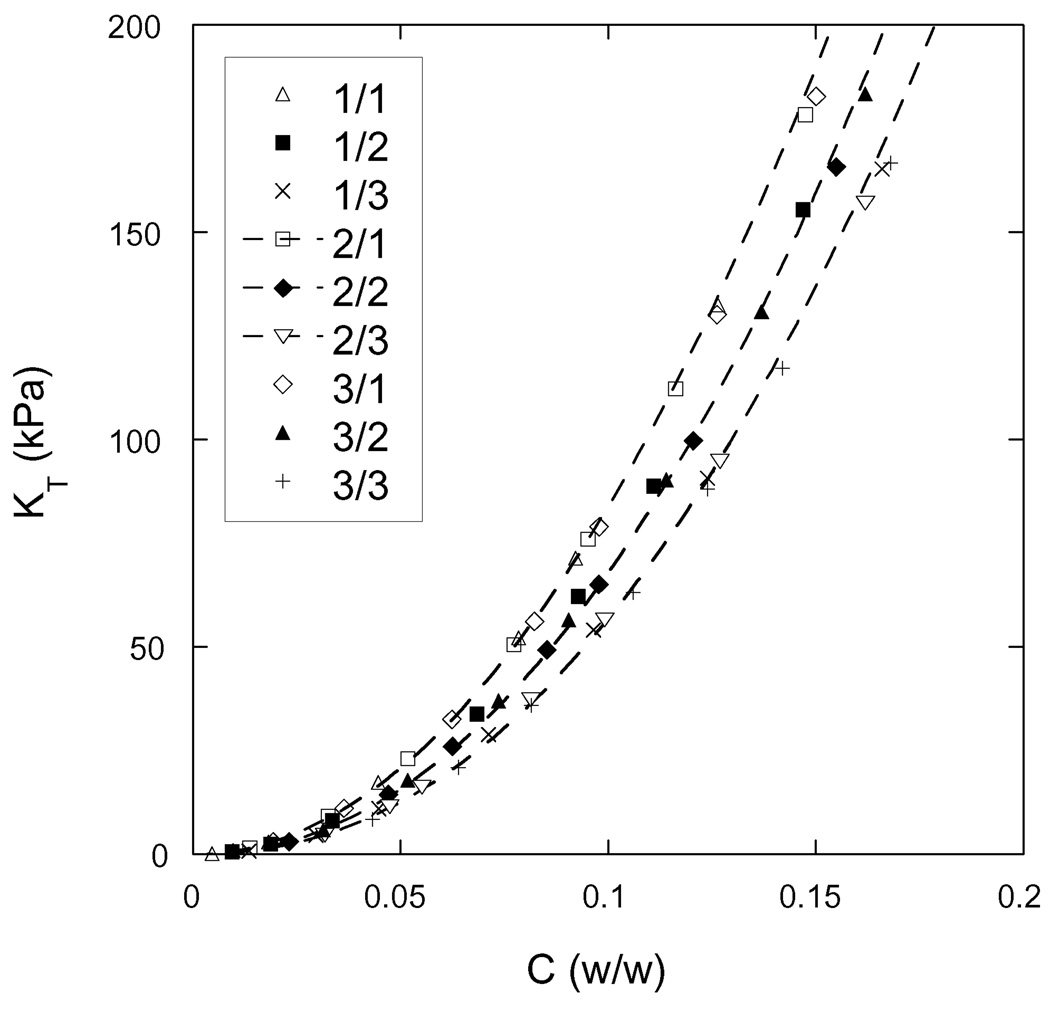
The osmotic modulus values obtained from Equation (9) are plotted against total polymer weight fraction in Figure 6.
Figure 6.
Osmotic modulus vs. total weight fraction of polymer in the hydrogel, for each of the nine hydrogels synthesized. The designation of each hydrogel, as defined in Table 1, is given in the legend. The dashed curves are drawn as a guide to the eyes and connect gels of the same crosslinker mole ratio. The experimental error of these measurements is comparable to the size of the symbols.
Comparing Figures 4 and 6, one observes that KT is approximately twice as large as G at equilibrium (Πtot = 0), and that KT increases much faster with increasing polymer concentration than G.
In what follows we estimate the ratio of the osmotic modulus to the shear modulus from simple scaling considerations. In fully swollen gels (Πtot = 0) from Equation 9 at C = Ce we have
| (10) |
Since the shear modulus of fully swollen gels Ge obeys the scaling relation [9]
| (11) |
from Equations 10 and 11 we get
| (12) |
where KTe is the value of the osmotic modulus at C = Ce
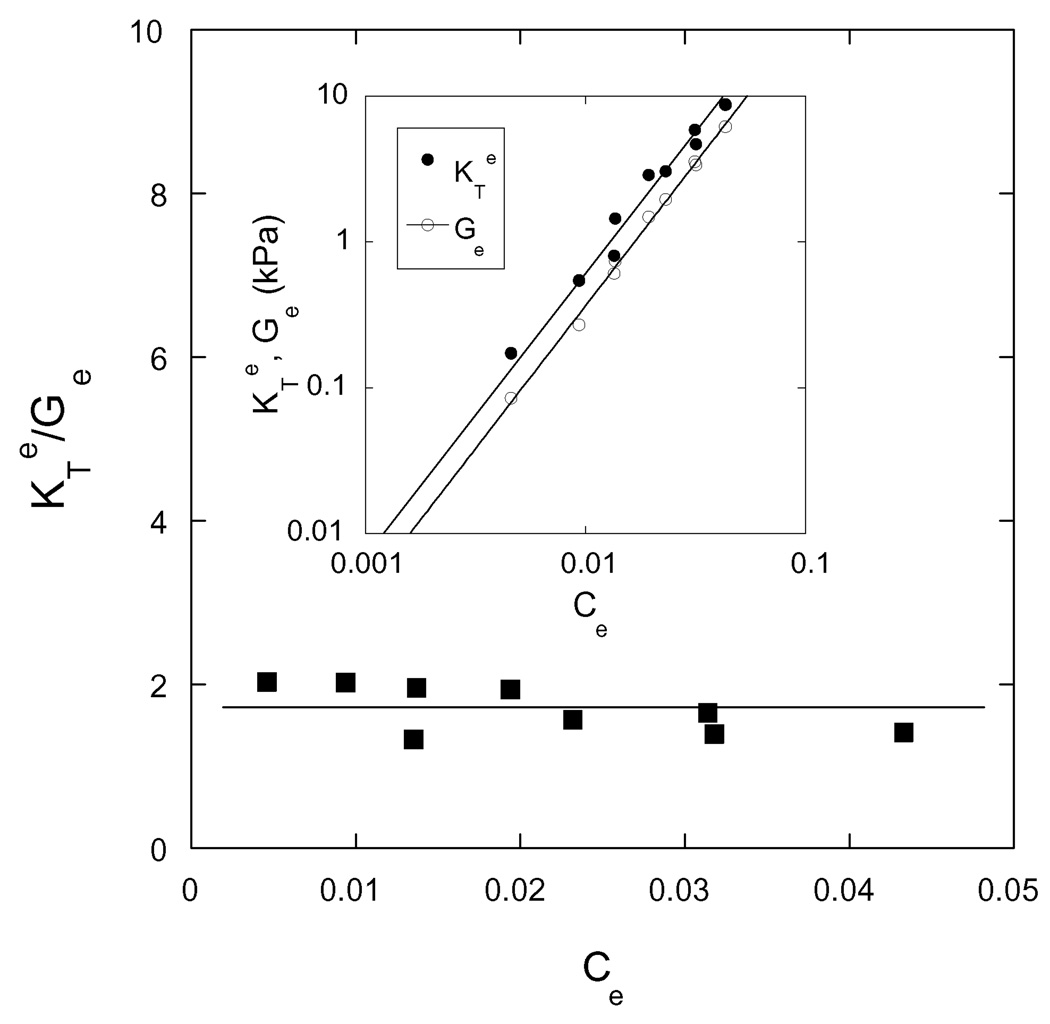
In Figure 7 is plotted KTe/ Ge as a function of Ce for each of the nine hydrogels.
Figure 7.
Dependence of the ratio KTe/Ge on the equilibrium polymer concentration Ce for each of the nine hydrogels. Inset shows the variation of the osmotic modulus KTe and the shear modulus Ge as a function of Ce.
The data points are close to 1.7 (continuous line), which is consistent with Equation 12 using the values of m and n listed in Tables 2 and 3. The power law exponent for the dependence of Πmix on C (m ≈ 2, see Table 3) is much greater than the power law exponent for the dependence of G on C (n ≈ 0.3, see Table 2), which explains why KT is much greater than G in the deswollen gels.
4.2. Small-angle neutron scattering measurements
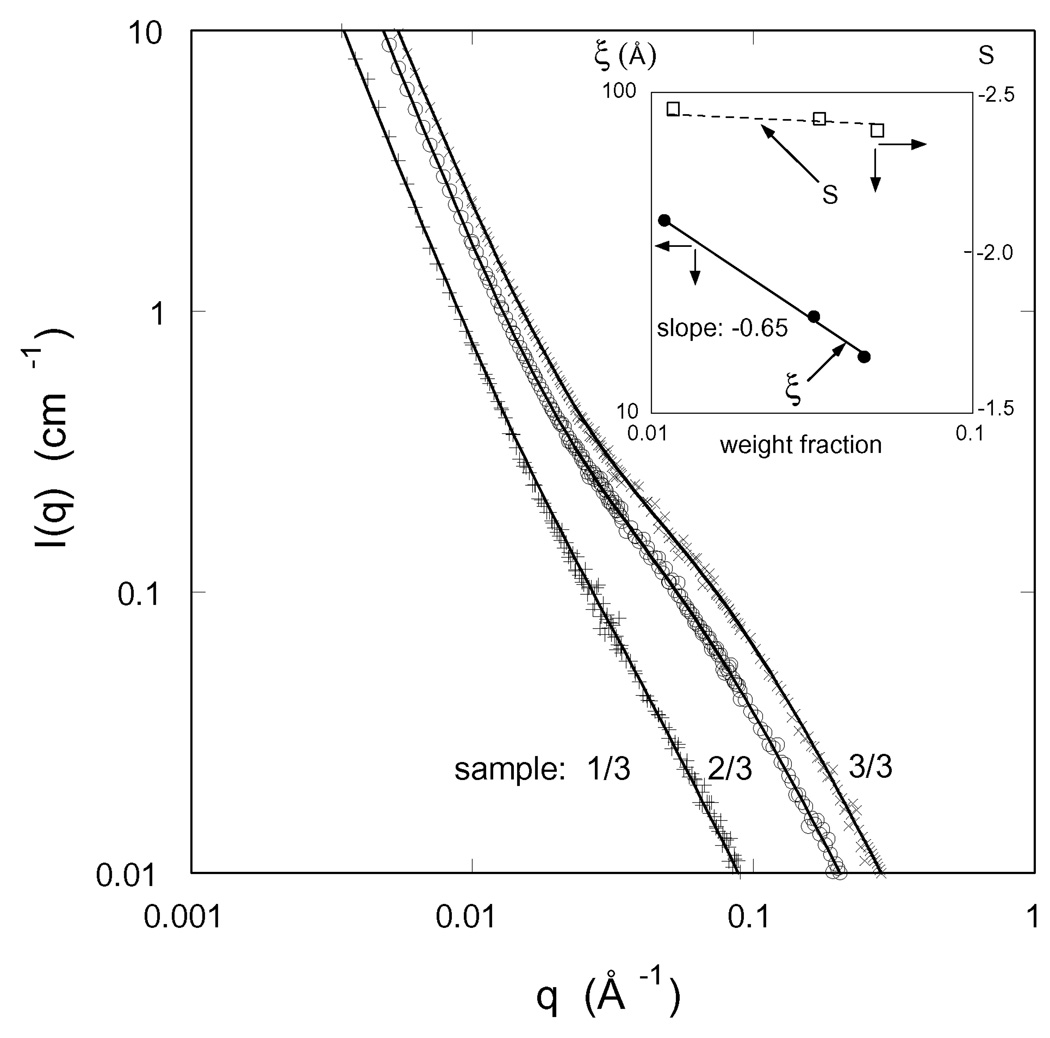
To obtain information on the spatial organization of the polymer molecules in these composite gels at the nanoscale we made SANS measurements. Figure 8 shows the SANS spectra for a set of CMHA-S/PEGDA gels prepared at different pre-gel concentrations with constant CMHA-S/PEGDA ratio. The SANS measurements were made on fully swollen gels. As expected the scattered intensity increases with increasing polymer concentration, it is the greatest for the gel prepared at the highest total polymer content. All the spectra exhibit the same characteristic features: at low q the intensity I(q) decreases and displays a power law scattering regime followed by a shoulder at higher values of q. The upturn in I(q) at low q (q < 0.01 Å−1) indicates cluster formation generally observed in polyelectrolyte solutions [32–34]. The size of these objects is greater than 1000 Å, i.e., the resolution of the SANS measurements. The shoulder becomes more pronounced as the polymer concentration increases. In the high q-region the scattering intensity is governed by the local geometry of the polymer molecules.
Figure 8.
SANS spectra for three hydrogels in the fully-swollen state with the same crosslinker mole ratio. The designation of each hydrogel, as defined in Table 1, is given in the figure. Inset shows the variation of the correlation length ξ and the exponent s with polymer weight fraction.
The SANS spectra were analyzed using equation 13, which reproduces the main characteristic features of the scattering curves
| (13) |
where ξ is the polymer-polymer correlation length, and A1, A2 and s are constants. The intensities A1 and A2 are proportional to the average scattering contrast between the polymer and the solvent. In equation 13 the first term (Lorentzian form factor) is primarily governed by the thermodynamic concentration fluctuations, while the second term arises from large-scale static inhomogeneities frozen-in by the cross-links. These large objects are not expected to make significant contribution to the thermodynamic properties of the system [26,35,36].
The parameters obtained from the least-squares fit of equation 13 to the SANS data (continuous lines in Figure 8) are listed in Table 4. The inset in Figure 8 shows that the correlation length ξ decreases with increasing polymer concentration as
| (14) |
Table 4.
Parameters from fits of equation 13 to the SANS spectra of PEGDA/CMHA-S gels
| Sample | A1 (cm−1) | A2 (cm−1) | ξ (Å) | s |
|---|---|---|---|---|
| 1/3 | 0.009 ± 0.002 | 0.080 ± 0.01 | 38 ± 4 | 2.48 ± 0.1 |
| 2/3 | 0.011 ± 0.002 | 0.155 ± 0.02 | 21 ± 2 | 2.44 ± 0.1 |
| 3/3 | 0.014 ± 0.002 | 0.196 ± 0.02 | 15 ± 2 | 2.42 ± 0.1 |
| 3/2 | 0.012 ± 0.002 | 0.144 ± 0.01 | 16 ± 2 | 2.29 ± 0.1 |
| 3/1 | 0.010 ± 0.002 | 0.011 ± 0.01 | 15 ± 2 | 2.17 ± 0.1 |
Scaling theory [9] predicts for the osmotic pressure of semidilute polymer solutions
| (15) |
where k is the Boltzmann constant and T is the absolute temperature. Combination of (14) and (15) yields the concentration dependence of the osmotic pressure Π ∝ C1.95, which is in reasonable agreement with the results of the macroscopic osmotic observations (Table 3).
In the low q region the slope s is practically the same for all the three gels; its value (≈ 2.4) is characteristic of randomly branched structures.
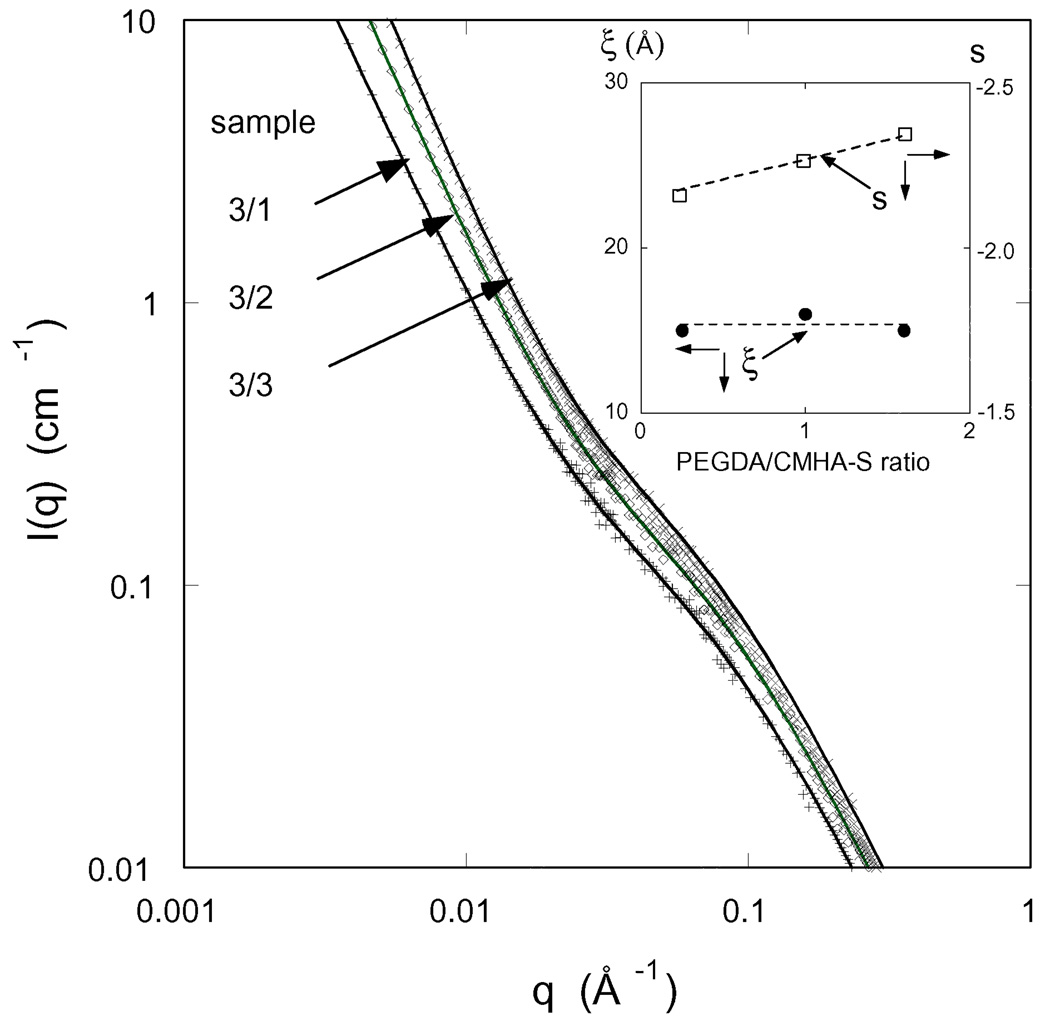
To estimate the effect of the chemical composition on the structure of CMHA-S/PEGDA hydrogels in Figure 9 are shown the SANS spectra of three gels prepared with increasing amount of cross-linker (PEGDA).
Figure 9.
SANS spectra for three hydrogels with differing crosslinker mole ratio measured at total polymer concentration 0.044 (w/w). The designation of each hydrogel, as defined in Table 1, is given in the legend. Inset shows the variation of the correlation length ξ and the exponent s with crosslinker mole ratio.
The SANS measurements were made at the same total polymer concentration [0.044 (w/w)]. The increase in the scattering intensity with increasing PEGDA content reflects the change in the scattering contrast. However, the shape of the SANS curves hardly varies with the chemical composition. This result indicates that in the present gel systems specific interactions between the PEGDA and CMHA-S components do not play a significant role. Use of equation 13 to describe the scattering curves yields a satisfactory fit to the data at each PEGDA/CMHA-S ratio (continuous lines through the SANS data points). The fitting parameters are listed in Table 4. The correlation length ξ is practically unaffected by the chemical composition of the network implying that the thermodynamic properties of these composite gels are governed by total polymer concentration. The slope of the I(q) plots in the power law regime weakly increases with increasing PEGDA/CMHA-S ratio (see inset). This result suggests that cross-linking slightly affects the static structure of the network.
5. Conclusions
Macro-scale (mechanical and osmotic) and micro-scale (SANS) measurements have been performed on nine different injectable CMHA-S hydrogels that were synthesized by varying crosslinker mole ratio and pre-gel CMHA-S concentration. These gels are potentially useful for biomedical applications (e.g., tissue engineering, soft tissue augmentation) and also scientifically interesting because the gels are complex composites containing roughly equal amounts of stiff charged CMHA-S chains and flexible uncharged PEGDA chains. Nonetheless, scaling theory developed for simple uncharged gels has been shown to describe the mechanical, osmotic, and SANS results at physiological ionic strength (0.15 M). SANS measurements reveal that the nanoscale structure of these composite gels is primarily governed by the total polymer content and only weakly affected by CMHA-S/PEGDA ratio. In addition, scaling theory correctly predicts that the osmotic modulus equals about twice the shear modulus G for fully-swollen gels, and exhibits much faster increase with increase in polymer concentration that occurs when water is expelled from a given gel due to the presence of an external osmotic stressing agent.
Acknowledgements
F.H. acknowledges the support of the Intramural Research Program of the NICHD, NIH. This work was partially supported by a grant from the National Institutes of Health, grant number 5R21EB4947. We acknowledge the support of the National Institute of Standards and Technology, U.S. Department of Commerce, in providing the neutron research facilities used in this work. This work utilized facilities supported in part by the National Science Foundation under Agreement No. DMR-0454672.
Footnotes
Publisher's Disclaimer: This is a PDF file of an unedited manuscript that has been accepted for publication. As a service to our customers we are providing this early version of the manuscript. The manuscript will undergo copyediting, typesetting, and review of the resulting proof before it is published in its final citable form. Please note that during the production process errors may be discovered which could affect the content, and all legal disclaimers that apply to the journal pertain.
References
- 1.Lapcik L, Jr, Lapcik L, De Smedt S, Demeester J, Chabrecek P. Chem. Reviews. 1998;98:2663–2684. doi: 10.1021/cr941199z. [DOI] [PubMed] [Google Scholar]
- 2.Laurent TC. The chemistry, biology, and medical applications of hyaluronan and its derivatives. Miami, FL: Portland Press; 1998. [Google Scholar]
- 3.Balazs EA, J.L. Denlinger JL. Clinical uses of hyaluronan. In: Evered D, Whelan J, editors. The Biology of Hyaluronan. New York: John Wiley; 1989. [Google Scholar]
- 4.Weng L, Gouldstone A, Wu Y, Chen W. Biomaterials. 2008;29:2153–2163. doi: 10.1016/j.biomaterials.2008.01.012. [DOI] [PMC free article] [PubMed] [Google Scholar]
- 5.Shu XZ, Liu Y, Palumbo FS, Luo Y, Prestwich GD. Biomaterials. 2004;25:1339–1348. doi: 10.1016/j.biomaterials.2003.08.014. [DOI] [PubMed] [Google Scholar]
- 6.Klemuk SA, Titze RT. Laryngoscope. 2004;114:1597–1603. doi: 10.1097/00005537-200409000-00018. [DOI] [PubMed] [Google Scholar]
- 7.Takahashi R, Al-Assaf S, Williams PA, Kubota K, Okamoto A, Nishinar K. Biomacromolecules. 2004;4:404–409. doi: 10.1021/bm025706v. [DOI] [PubMed] [Google Scholar]
- 8.Mark JE, Flory PJ. JACS. 1965;87:1415–1423. [Google Scholar]
- 9.de Gennes PG. Scaling Concepts in Polymer Physics. Ithaca NY: Cornell University Press; 1979. [Google Scholar]
- 10.Engler AJ, Griffin MA, Sen S, Bonnemann CG, Sweeney HL, Discher DE. J. Cell Bio. 2004;166:877. doi: 10.1083/jcb.200405004. [DOI] [PMC free article] [PubMed] [Google Scholar]
- 11.Flory PJ. Principles of Polymer Chemistry. Ithaca, NY: Cornell University Press; 1953. [Google Scholar]
- 12.Dusek K, Prins W. Adv. Polym. Sci. 1969;6:1. [Google Scholar]
- 13.Horkay F, Tasaki I, Basser PJ. Biomacromolecules. 2000;1:84–90. doi: 10.1021/bm9905031. [DOI] [PubMed] [Google Scholar]
- 14.Horkay F, Basser PJ. Biomacromolecules. 2004;5:232–237. doi: 10.1021/bm034372m. [DOI] [PubMed] [Google Scholar]
- 15.Yin DW, Horkay F, Douglas JF, De Pablo JJ. J. Chem. Phys. 2008;129(15):154909. doi: 10.1063/1.2991179. [DOI] [PMC free article] [PubMed] [Google Scholar]
- 16.Ghosh K, Shu XZ, Mou R, Lombardi J, Prestwich GD, Rafailovich MH, Clark RA. Biomacromoecules. 2005;6:2857–2865. doi: 10.1021/bm050361c. [DOI] [PubMed] [Google Scholar]
- 17.Teng D-Y, Wu Z-M, Zhang X-G, Wang Y-X, Zheng C, Wang Z, Li C-X. Polymer. 2010;51:639–646. [Google Scholar]
- 18.Vink H. Eur. Polym. J. 1971;7:1411–1419. [Google Scholar]
- 19.Brown RP. Physical Testing of Rubber. 2nd ed. New York: Elsevier; 1986. [Google Scholar]
- 20.Mooney M. J. Appl. Phys. 1948;19:434. [Google Scholar]
- 21.Rivlin RS. J. Appl. Phys. 1947;18:444. [Google Scholar]
- 22.Horkay F, Hecht AM, Mallam S, Geissler E, Rennie AR. Macromolecules. 1991;24:2896–2902. [Google Scholar]
- 23.Baker JP, Hong LH, Blanch HW, Prausnitz JM. Macromolecules. 1994;27:1446–1454. [Google Scholar]
- 24.Ferry JD. Viscoelastic Properties of Polymers. 3rd ed. New York: John Wiley; 1980. [Google Scholar]
- 25.de Gennes PG. Macromolecules. 1976;9:587–593. [Google Scholar]
- 26.de Gennes PG. Macromolecules. 1976;9:594–598. [Google Scholar]
- 27.Colby RH, Rubinstein M. Macromolecules. 1990;23:2753–2757. [Google Scholar]
- 28.Rubinstein M, Colby RH. Polymer Physics. Oxford: Oxford University Press; 2003. [Google Scholar]
- 29.Lin-Gibson S, Jones RL, Washburn NR, Horkay F. Macromolecules. 2005;38:2897–2902. [Google Scholar]
- 30.Horkay F, Basser PJ, Hecht AM, Geissler E. Polymer. 2005;46:4242–4247. [Google Scholar]
- 31.Bencherif SA, Siegwart DJ, Srinivasan A, Horkay F, Hollinger JO, Washburn NR, Matyjaszewski K. Biomaterials. 2009;30:5270–5278. doi: 10.1016/j.biomaterials.2009.06.011. [DOI] [PMC free article] [PubMed] [Google Scholar]
- 32.Moan M. J. Appl. Cryst. 1978;11:519–523. [Google Scholar]
- 33.Prabhu VM, Muthukumar M, Wignall GW, Melnichenko YB. J. Chem. Phys. 2003;119:4085–4098. [Google Scholar]
- 34.Hammouda B, Horkay F, Becker M. Macromolecules. 2005;38:2019–2021. [Google Scholar]
- 35.Horkay F, Hecht AM, Geissler E. Macromolecules. 1998;31:8851–8856. [Google Scholar]
- 36.Horkay F, McKenna GB, Deschamps P, Geissler E. Macromolecules. 2000;33:5215–5220. [Google Scholar]


