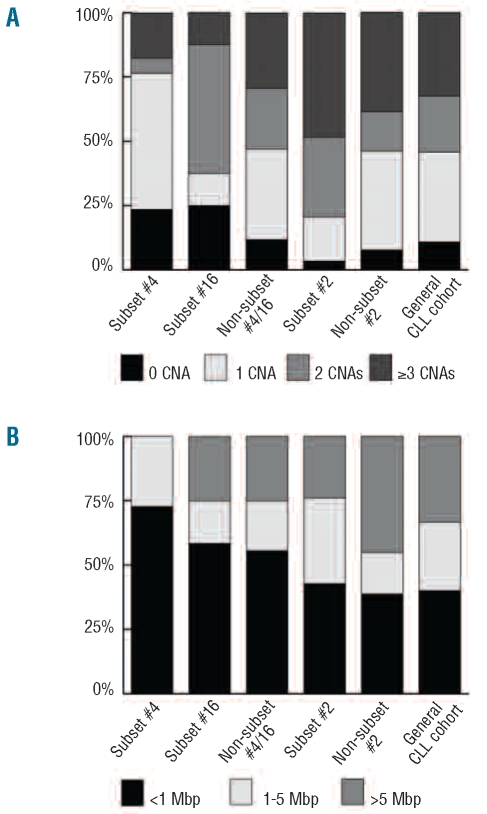
Figure 1.
Level of genomic complexity and size distribution of copy-number aberrations. The columns represent IGHV4-34 samples; subset #4 (n=17), subset #16 (n=8) and non-subset #4/16 (n=34); IGHV3-21 samples; subset #2 (n=29) and non-subset #2 (n=13) and a ‘general’ CLL cohort (n=203) from the study by Gunnarsson et al.23 Samples from the current study that overlapped with our recent array-based Swedish CLL cohort study23 were not removed from analysis, as the overlap between studies was limited. (A) Level of genomic complexity in each group is based on the frequency of samples that carry a certain number of CNAs (0, 1, 2 or ≥3). (B) The size distribution of copy-number aberrations (<1 Mbp, 1–5 Mbp or >5 Mbp) is shown as the frequency of the total number of copy-number aberrations. Note that subset #4 samples do not carry copy-number aberrations greater than 5 Mbp, whereas the non-subset #2 samples show the highest frequency of copy-number aberrations greater than 5 Mbp.

