Abstract
During retinogenesis, the Xenopus basic helix–loop–helix transcription factor Xath5 has been shown to promote a ganglion cell fate. In the developing mouse and chicken retinas, gene targeting and overexpression studies have demonstrated critical roles for the Brn3 POU domain transcription factor genes in the promotion of ganglion cell differentiation. However, the genetic relationship between Ath5 and Brn3 genes is unknown. To understand the genetic regulatory network(s) that controls retinal ganglion cell development, we analyzed the relationship between Ath5 and Brn3 genes by using a gain-of-function approach in the chicken embryo. We found that during retinogenesis, the chicken Ath5 gene (Cath5) is expressed in retinal progenitors and in differentiating ganglion cells but is absent in terminally differentiated ganglion cells. Forced expression of both Cath5 and the mouse Ath5 gene (Math5) in retinal progenitors activates the expression of cBrn3c following central-to-peripheral and temporal-to-nasal gradients. As a result, similar to the Xath5 protein, both Cath5 and Math5 proteins have the ability to promote the development of ganglion cells. Moreover, we found that forced expression of all three Brn3 genes also can stimulate the expression of cBrn3c. We further found that Ath5 and Brn3 proteins are capable of transactivating a Brn3b promoter. Thus, these data suggest that the expression of cBrn3c in the chicken and Brn3b in the mouse is initially activated by Ath5 factors in newly generated ganglion cells and later maintained by a feedback loop of Brn3 factors in the differentiated ganglion cells.
During retinogenesis, retinal progenitors undergo a series of changes in competence to give rise to the seven classes of retinal cells present in the adult retina (for reviews, see refs. 1 and 2). These include the rod and cone photoreceptor cells; the horizontal, bipolar, and amacrine interneurons; the ganglion cells; and the Müller glial cells. The ganglion cells are the sole output neurons in the retina that relay light information detected by the photoreceptors to the brain. They are also the first class of retinal cells to be generated during retinogenesis (3). During chicken retinal development, ganglion cells are produced over the period from embryonic day 2 (E2) to E9 (4), with all cells initially born in the ventricular zone, followed by immediate differentiation and migration into the future ganglion cell layer (5). The differentiation of ganglion cells begins at the central region of the developing retina, gradually spreading to the peripheral region as a wave-like front (6).
Although a few intrinsic and extrinsic factors have been identified that affect retinal ganglion cell development, the genetic regulatory network(s) that control ganglion cell determination and differentiation remains unknown. Activation of the Notch signaling pathway in the retina has been shown to suppress neuronal differentiation including ganglion cell differentiation, while promoting the formation of Müller glial cells (7, 8). In contrast, activation of the fibroblast growth factor signaling pathway potentiates ganglion cell differentiation (9–11). In the developing Xenopus retina, the basic helix–loop–helix transcription factors Xath5 and Xath3, which are homologs of the Drosophila proneural factor atonal, are expressed in retinoblasts (12, 13). Overexpression of Xath5 and Xath3 has been shown to promote a ganglion cell fate (12, 13). Math5 is the mouse homolog of Xath5 that is also expressed in retinal progenitors. However, forced expression of Math5 promotes a bipolar cell fate in the Xenopus retina (14). It is not clear whether this functional difference results from species difference or manifests a true functional divergence between Xath5 and Math5 (14).
The POU domain transcription factor Brn3b is first expressed in migrating, postmitotic ganglion cell precursors in the ventricular zone of developing mouse retinas (15, 16). It is both necessary and sufficient to promote retinal ganglion cell differentiation based on gene targeting studies in mice and overexpression analyses in the chicken (15–21). During chicken retinogenesis, cBrn3c is the first Brn3 factor to be expressed in migrating ganglion cell precursors and appears to play an equivalent role as Brn3b (19). The chicken ortholog of Brn3b, termed cBrn3b, is expressed only in differentiated ganglion cells (19). It remains unknown at present whether Ath5 factors and Brn3 proteins function in the same regulatory pathway to control retinal ganglion cell development.
In this report, our goal is to (i) establish a genetic relationship between Ath5 and Brn3 genes during retinal ganglion cell development and (ii) clarify the role of Math5 during retinogenesis. We find that during chicken retinogenesis, the chicken Ath5 gene Cath5 is expressed in retinal progenitors and in differentiating ganglion cells. Forced expression of Cath5 and Math5 in retinal progenitors activates cBrn3c expression, which in turn promotes ganglion cell differentiation. Moreover, forced expression of Brn3 proteins similarly stimulates the expression of cBrn3c. We further show that Ath5 and Brn3 proteins are all capable of transactivating a Brn3b promoter, suggesting that the expression of cBrn3c and Brn3b genes is initially activated by Ath5 factors and later maintained by a feedback loop of Brn3 factors during development and in the adult.
Materials and Methods
Plasmid Constructs.
For retroviral plasmid constructs, RCAS-Brn3a, RCAS-Brn3b, RCAS-Brn3c, RCAS-Brn3cΔ8, and RCAS-AP were as described (19, 22). To construct RCAS-Cath5 and RCAS-Math5 plasmids, PCR-derived cDNA fragments of Cath5 and Math5 were first subcloned into the shuttle plasmid Slax12NCO and then transferred into the RCASBP(A) vector as described (19). For transcriptional assays, expression plasmids for Brn3a, Brn3b, and Brn3c were constructed (19, 23). To construct expression plasmids for Cath5, Math5, and NeuroD, their cDNA fragments were amplified by PCR and inserted into the pRK5 vector as described (19). The reporter plasmid was constructed by inserting a 4.6-kb 5′ regulatory sequence of the mouse Brn3b gene (24) upstream of the luciferase gene in pGL2 vector (Promega). All PCR-derived constructs were verified by DNA sequencing.
In Situ Hybridization.
In situ hybridization on tissue sections was performed as described (25). Digoxigenin-labeled RNA probes were prepared from the Cath5 cDNA subcloned in Slax12NCO vector.
Preparation and Injection of Retroviruses.
Preparation and injection of RCAS viruses were performed as described (19). All injections were conducted at stages 9–11 (≈E1.5). Control and injected embryos were collected and analyzed at E4.5–E18.5. White Leghorn chicken eggs were purchased from Charles River SPAFAS (North Franklin, CT).
Immunostaining and Labeling by BrdUrd and Terminal Deoxynucleotidyltransferase-Mediated dUTP Nick End Labeling (TUNEL).
Immunostaining of chicken retinal sections and flat mounts and dissociated retinal cells was performed as described (19, 26). Quantitation of immunoreactive cells in dissociated retinas was as described (19). For quantitation analysis on retinal sections, cBrn3c+ cells in the ventricular zone were scored on the temporal half and the nasal half of each retinal section. Three consecutive retinal sections were analyzed for each retina and at least five retinas injected with each type of virus were analyzed at each stage. The procedures for BrdUrd labeling and TUNEL were as described (19). Antibodies were obtained from the following sources: anti-cBrn3c (19), anti-NF200 (Boehringer Mannheim), anti-Islet1 (27), anti-BrdU (Sigma), and anti-p27 (Charles River SPAFAS).
Transcriptional Assay.
Cotransfection transcriptional assays were performed as described (19), using 293T human embryonic kidney cells and ND7 cells, a neuronal cell line derived from rat dorsal root ganglia (28).
Results
Expression Patterns of Cath5 During Chicken Retinogenesis.
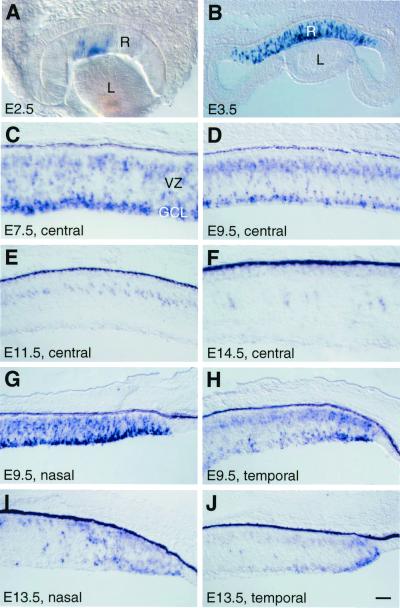
The chicken Cath5 cDNA, which had been isolated (GenBank accession no. AJ001178), encodes a protein that shares in the basic helix–loop–helix domain 96% and 91% sequence identity to Math5 and Xath5, respectively. To investigate whether Cath5 plays a role during chicken retinogenesis, we first examined its spatial and temporal expression patterns in the developing retina by in situ hybridization. Like the zebrafish ath5 (29), Cath5 appeared to be expressed only in the retina. The Cath5 transcripts were first detected at E2.5 in a small area of the central retina (Fig. 1A). At E3.5–E4.5, Cath5 expression had spread to a large central region and was localized to scattered cells encompassing presumptive progenitors in the ventricular zone and differentiating ganglion cells within the ganglion cell layer (Fig. 1B). By E7.5, strong Cath5 expression had spread to the entire retina (Fig. 1C), consistent with the central-to-peripheral gradient of neurogenesis (4). By E9.5, however, Cath5 expression began to be down-regulated starting from the central region (Fig. 1D). In the central retina, the ganglion cell layer completely lost Cath5 expression by E11.5, and by E14.5, only occasional cells expressed Cath5 in the ventricular zone (Fig. 1 E and F). In the peripheral retina, down-regulation of Cath5 expression was found to be more rapid in the temporal side than in the nasal side (Fig. 1 G–J), in agreement with the observed temporal-to-nasal gradient of neurogenesis (4). Because most ganglion cells exit the cell cycle between E2 and E9 during chicken retinogenesis (4), the dynamic pattern of Cath5 expression closely correlated with the genesis of ganglion cells.
Figure 1.
Expression of Cath5 during retinogenesis as detected by in situ hybridization. (A–C) Cath5 expression is initiated at E2.5 and confined to the central retina at E3.5 in scattered cells of the ventricular zone and ganglion cell layer, and its expression continues to be strong in the central retina at E7.5. (D–F) Cath5 expression is gradually lost in the central retina from E9.5 to E14.5. (G–J) In the peripheral region, Cath5 expression is down-regulated earlier in the temporal retina than in the nasal retina at E9.5 and E13.5. GCL, ganglion cell layer; L, lens; R, retina; VZ, ventricular zone. [Bars = 56 μm (B), 50 μm (D, E, and G–J), and 25 μm (A, C, and F).]
Forced Expression of Cath5 Activates cBrn3c Expression.
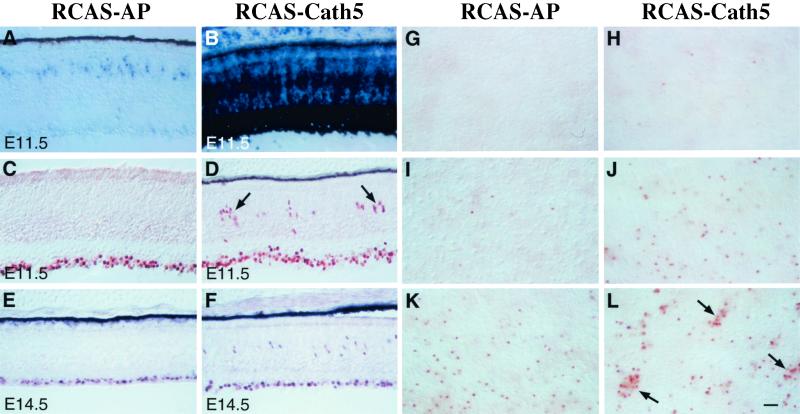
To analyze the relationship between the Cath5 and cBrn3c genes, we examined whether forced expression of Cath5 in retinal progenitors could affect cBrn3c expression. The replication competent RCAS retroviral vector was used to overexpress the Cath5 protein. When we infected optic vesicles with RCAS-Cath5 viruses at stages 9–11 (≈E1.5), before the initiation of ganglion cell differentiation (4), most of the retinas were found to be highly infected by the virus, and the exogenous Cath5 transcripts were densely expressed throughout the retina at E4.5 and E11.5 (Fig. 2 A and B; data not shown). We next examined cBrn3c expression in sections from infected retinas by immunostaining with an anti-cBrn3c antibody (19). Many cells immunoreactive for cBrn3c were observed in the ventricular zone of the intermediate region at E11.5 and E14.5 (Fig. 2 D and F), whereas in the intermediate region of the control uninfected retina, nearly all cBrn3c+ cells were located in the ganglion cell layer by these late embryonic stages (see Fig. 4A). Infection of retinas with RCAS-AP viruses, which express the human placental alkaline phosphatase (AP), however, did not cause any increase in the number of cBrn3c+ cells in the ventricular zone (Fig. 2 C and E). By quantifying cells immunoreactive for cBrn3c in dissociated retinal cells, we found a 30–60% increase in the number of cBrn3c+ cells in retinas infected with RCAS-Cath5 viruses at E5.5 and E6.5, compared with control uninfected retinas (Fig. 3B; data not shown). Therefore, ectopic expression of Cath5 can specifically stimulate cBrn3c expression in the retina.
Figure 2.
Overexpression of Cath5 in retinal progenitors stimulates cBrn3c expression. (A and B) Cath5 expression was examined by in situ hybridization in sections from E11.5 retinas infected with RCAS-AP and RCAS-Cath5 viruses. (C–F) At E11.5 and E14.5, many more cells immunoreactive for cBrn3c were observed in the ventricular zone of intermediate region from retinas infected with RCAS-Cath5 viruses, compared with those infected with RCAS-AP viruses. (G–L) At E11.5, flat-mount nasal retinas infected with RCAS-AP (G, I, and K) and RCAS-Cath5 (H, J, and L) viruses from the central (G and H), intermediate (I and J), and peripheral (K and L) regions were immunostained with anti-cBrn3c antibody and photographed at the level of ventricular zone. The increase in the number of cBrn3c-immunoreactive cells displays a central-to-peripheral gradient in retinas infected with RCAS-Cath5 viruses. Arrows point to clusters of cells immunoreactive for cBrn3c. [Bar = 50 μm (E and F) and 25 μm (A–D and G–L).]
Figure 4.
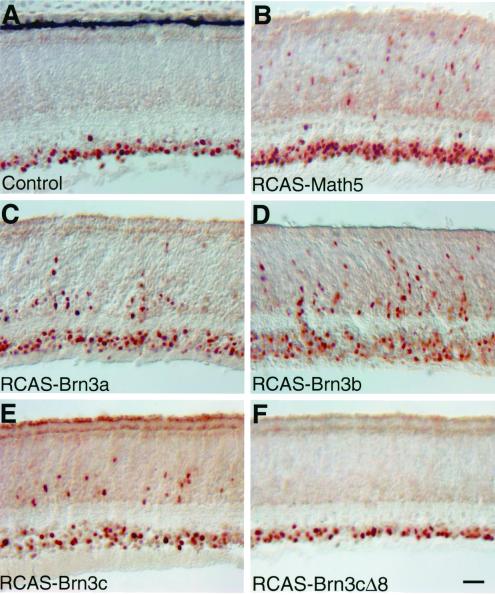
Misexpression of Math5 and Brn3 factors stimulates cBrn3c expression. Sections from intermediate regions of E11.5 control retinas (A) and retinas infected with RCAS-Math5 (B), RCAS-Brn3a (C), RCAS-Brn3b (D), RCAS-Brn3c (E), or RCAS-Brn3cΔ8 (F) viruses were immunostained with anti-cBrn3c antibody. Misexpressed Math5, Brn3a, Brn3b, and Brn3c caused a significant increase in the number of cBrn3c immunoreactive cells in the ventricular zone, whereas misexpressed Brn3cΔ8 had no effect. (Bar = 25 μm.)
Figure 3.
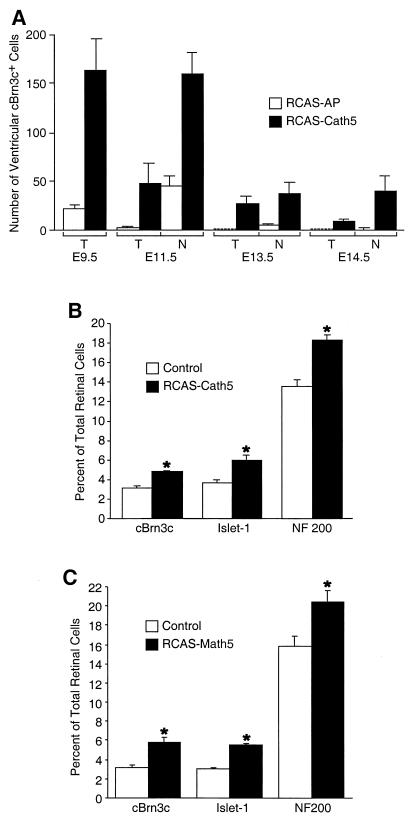
Effect of misexpression of Cath5 and Math5 on the expression of cBrn3c and ganglion cell production. (A) Quantitation of cBrn3c+ cells per section in the ventricular zone of temporal (T) and nasal (N) regions from retinas infected with RCAS-AP and RCAS-Cath5 viruses at indicated stages. Each histogram represents the mean ± SD for at least three retinas. (B and C) Quantitation of cBrn3c+, Islet1+, and NF200+ cells in E5.5 retinas infected with RCAS-Cath5 (B) or RCAS-Math5 (C) viruses. Misexpression of Cath5 and Math5 resulted in a significant increase in the number of cBrn3c+, Islet1+, and NF200+ cells in the retina. Each histogram represents the mean ± SD for at least three retinas. *, P < 0.01 by Student's t test.
During chicken retinal development, neurogenesis displays central-to-peripheral and temporal-to-nasal gradients (4). Interestingly, forced expression of Cath5 induced similar gradients of cBrn3c expression in the ventricular zone. In E11.5 flat-mount nasal retinas infected with RCAS-Cath5 viruses, cBrn3c immunoreactive cells in the ventricular zone were abundant in the periphery, somewhat reduced in the intermediate region, and sparse in the center (Fig. 2 H, J, and L). In addition, some cBrn3c+ cells formed clusters in the ventricular zone of the peripheral and intermediate retinas (Fig. 2 D and L). In nasal retinas infected with RCAS-AP viruses, although a significant number of cBrn3c+ cells was present in the ventricular zone of the peripheral retina, these cells were scarce in the intermediate and central regions (Fig. 2 G, I, and K). The temporal-to-nasal gradient of cBrn3c expression was revealed by comparing the number of cBrn3c-immunoreactive cells in the ventricular zone of retinal sections at E11.5–E14.5. At each stage, there are significantly more cBrn3c+ cells in the ventricular zone on the nasal side than on the temporal side in retinas infected with RCAS-Cath5 viruses (Fig. 3A). Moreover, forced Cath5 expression significantly elevates the number of cBrn3c+ cells in the ventricular zone of both temporal and nasal retinas compared with forced AP expression at E11.5–E14.5 (Fig. 3A). However, the ability for Cath5 to induce cBrn3c expression becomes gradually diminished as the embryo ages. For instance, in the ventricular zone of the temporal retina, overexpression of Cath5 can induce only a small number of cells to express cBrn3c at E14.5, whereas at E9.5, it can induce many more cells to express cBrn3c (Fig. 3A). Thus, these data suggest that only competent cells can be induced by Cath5 to express cBrn3c and that the number of competent cells decreases as the retina matures.
Forced Expression of Cath5 and Math5 Promotes Retinal Ganglion Cell Development.
Because overexpression of cBrn3c in retinal progenitors has been shown to promote ganglion cell differentiation (19), we investigated whether overexpression of Cath5 had a similar consequence as a result of its stimulation of cBrn3c expression. The number of ganglion cells was determined by dissociating retinal cells followed by immunocytochemistry for two ganglion cell-specific markers, the LIM homeodomain transcription factor Islet1 and neurofilament 200 (NF200) (19). At E5.5 and E6.5, retinal infection with RCAS-Cath5 viruses increased the cells immunoreactive for Islet1 by 30%–60% (P < 0.01) and the cells immunoreactive for NF200 by 30%–40% (P < 0.01) (Fig. 3B; data not shown). This increase in ganglion cell number did not appear to result from the promotion of cell proliferation or suppression of cell death because overexpression of Cath5 did not cause any change in the number of cells labeled by BrdUrd or TUNEL (data not shown). In contrast, infection with RCAS-AP viruses did not alter the number of cells positive for Islet1 or NF200 (data not shown). In addition, retinal infection with RCAS-Cath5 viruses had no effect on the number of cells positive for visinin, a photoreceptor-specific marker (data not shown). Therefore, forced Cath5 expression not only stimulated cBrn3c expression but also specifically promoted retinal ganglion cell differentiation as a result. Furthermore, the cBrn3c+ nascent ganglion cells ectopically induced by Cath5 in the retinal ventricular zone appeared to be able to assume a mature ganglion cell position because all cBrn3c+ cells were located in the ganglion cell layer by E18.5 in retinas infected with RCAS-Cath5 viruses (Fig. 2; data not shown).
To test whether Math5 had a similar ability to promote ganglion cell formation in the chicken retina, we ectopically expressed Math5 in retinal progenitors by infection with RCAS-Math5 viruses. As shown in Fig. 3C, forced Math5 expression led to a 30% increase in the number of NF200-positive cells (P < 0.01) and a 30%–60% increase in the number of Islet1-positive cells (P < 0.01) by E5.5–E6.5. Correspondingly, a 30–60% increase in the number of cBrn3c+ cells (P < 0.01) was also observed in retinas infected with RCAS-Math5 viruses (Fig. 3C; data not shown). Consistent with this observation, many cells immunoreactive for cBrn3c were found in the ventricular zone in E11.5 retinas infected with RCAS-Math5 viruses, whereas in the control retina, these cells were barely present (Fig. 4 A and B). Thus, these data suggest that Math5 is also capable of promoting ganglion cell development in the chicken retina by activating cBrn3c expression.
Forced Expression of Brn3 Factors Activates cBrn3c Expression.
Given that all Brn3 factors can promote retinal ganglion cell differentiation in the chicken (19), we investigated whether they also exerted this effect by stimulating cBrn3c expression. The number of cBrn3c-expressing cells was examined by immunostaining with anti-cBrn3c antibody in sections from control retinas and retinas infected with RCAS-Brn3a, RCAS-Brn3b, or RCAS-Brn3c viruses. In the ventricular zone of the intermediate retina, similar to overexpression of Cath5 and Math5, forced expression of Brn3a, Brn3b, and Brn3c stimulated many cells to express cBrn3c at E11.5 and E14.5 (Fig. 4 A–E; data not shown). We also infected retinas with RCAS-Brn3cΔ8 viruses that express a mutant Brn3c protein that is unable to promote retinal ganglion cell development (19). Correspondingly, no additional cBrn3c-expressing cells were induced by Brn3cΔ8 in the ventricular zone of the intermediate retina at E11.5 (Fig. 4 A and F). Therefore, all three Brn3 factors can activate cBrn3c expression, which in turn can promote differentiation of retinal ganglion cells.
Transactivation of a Brn3b Promoter by Ath5 and Brn3 Factors.
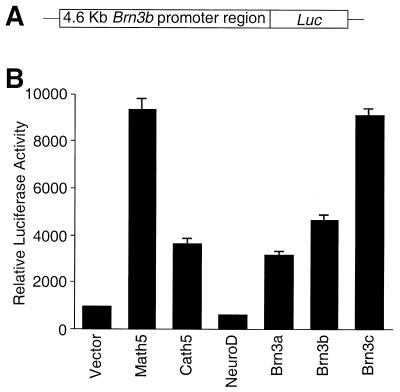
The mouse Brn3b factor is both necessary and sufficient for promotion of retinal ganglion cell differentiation (15, 17, 19). Given the ability of Math5 and Brn3 factors to activate cBrn3c expression and promote ganglion cell genesis in the chicken retina, we tested whether they could also regulate Brn3b expression in vitro. A luciferase reporter plasmid was constructed containing the 4.6-kb 5′ regulatory sequence of the mouse Brn3b gene (24). Transient transfection of a Math5 expression plasmid with the reporter construct in 293T and ND7 cells, respectively, resulted in a 10- and 8-fold increase in luciferase activity, indicating a direct regulation of Brn3b by Math5 (Fig. 5; data not shown). Interestingly, the Cath5 protein displayed a similar transactivation activity on the promoter whereas another basic helix–loop–helix transcription factor NeuroD had no effect (Fig. 5), in agreement with a previous study showing that NeuroD does not affect ganglion cell development during retinogenesis (30). Transfection of expression plasmids for Brn3a, Brn3b, and Brn3c transactivated the Brn3b promoter by 3- to 10-fold in 293T cells or ND7 cells (Fig. 5; data not shown). Thus, these data suggest that the expression of Brn3b can be activated directly by Math5 and that it is also subject to positive feedback regulation by Brn3 proteins.
Figure 5.
Transactivation of a Brn3b promoter by Ath5 and Brn3 proteins. (A) Schematic of the reporter construct in which the luciferase reporter gene (Luc) is placed under the control of a 4.6-kb Brn3b promoter sequence. (B) Relative luciferase activities after cotransfection of indicated expression plasmids with the reporter plasmid in 293 cells. Results represent the mean ± SD of triplicate assays in a single experiment.
Discussion
cBrn3c Is a Target of Cath5.
During chicken retinogenesis, the onset of Cath5 expression is detected at E2.5 when ganglion cells begin to withdraw from the cell cycle (4). The strong Cath5 expression continues until E9.5 when it starts to be down-regulated. Because most of the ganglion cells are produced by E9 (4), the timing of transient Cath5 expression coincides with the period of ganglion cell genesis. That Cath5 is found only in retinoblasts and newly generated ganglion cells suggests that it may play a role in the determination and/or early differentiation of ganglion cells. cBrn3c expression commences at E3 in newly generated, migrating ganglion cells, and its expression persists in differentiated ganglion cells in the adult retina (19). Thus, cBrn3c probably functions downstream of Cath5 to control the differentiation and/or maintenance of ganglion cells. Consistent with this speculation, we have shown (19) that overexpression of cBrn3c is capable of promoting retinal ganglion cell differentiation; and we show herein that forced expression of Cath5 in retinal progenitors stimulates cBrn3c expression, indicating cBrn3c as a target gene of Cath5. However, whether cBrn3c is a direct or indirect target of Cath5 remains to be determined. In the developing mouse retina, Brn3b, the functionally equivalent gene of cBrn3c, appears to be a direct target of Math5, because Math5 can be shown to transactivate a Brn3b promoter (Fig. 5). Because Cath5 can similarly transactivate the Brn3b promoter (Fig. 5), it also may activate cBrn3c expression directly.
Induction of cBrn3c expression by Cath5 follows gradients of neurogenesis in the developing retina. At E11.5–E14.5, more cells in the peripheral retina can be stimulated by Cath5 to express cBrn3c than in the central retina; and more cells in the nasal retina can be stimulated by Cath5 to express cBrn3c than in the temporal retina (Figs. 2 and 3A). This phenomenon indicates that there are more cells competent to be induced by Cath5 to express cBrn3c in younger retinas. Consistent with this notion, retinal infection with RCAS-Cath5 viruses results in more cBrn3c+ cells at E11.5 than at E14.5 (Fig. 3A). During retinogenesis, it is hypothesized that only certain progenitors are competent to become ganglion cells at a particular stage and that the number of these competent cells decreases as development proceeds (2). Therefore, it is likely that only progenitors that can become ganglion cells can be induced by Cath5 to express cBrn3c. In keeping with this speculation, only a 30–60% increase in the number of cBrn3c+ cells can be observed in retinas infected with RCAS-Cath5 viruses even though up to 90% of all retinal cells can be infected by the virus (Fig. 3B; data not shown).
Promotion of Retinal Ganglion Cell Development by Cath5 and Math5.
Cath5 is expressed in retinal progenitors and differentiating ganglion cells. It activates the expression of cBrn3c whose overexpression promotes ganglion cell differentiation (19). Correspondingly, Cath5 shows an ability similar to cBrn3c in the promotion of retinal ganglion cell development, as assayed by overexpression in retinal progenitors. Because overexpression of Cath5 causes a more than 30% increase for both cBrn3c+ cells and ganglion cells (Fig. 3B), it is likely that all cells that are stimulated by Cath5 to express cBrn3c eventually differentiate into ganglion cells. However, not all retinal cells with overexpressed cBrn3c can become ganglion cells because only a minor number of cells could be induced to become ganglion cells even though most retinal cells could be infected by RCAS-cBrn3c viruses (19). Similarly, as discussed above, only a small number of cells with overexpressed Cath5 could be induced to express cBrn3c and become ganglion cells even though up to 90% of total retinal cells could be infected by RCAS-Cath5 viruses. Thus, these data suggest that ganglion cell differentiation is stimulated only when Cath5 or cBrn3c is expressed in progenitor cells competent for a ganglion cell fate.
During mouse retinogenesis, ganglion cells become postmitotic starting at E11, and by E16.5 most of the ganglion cells are born (3). Correspondingly, the onset of Math5 expression is detected at E11, and the onset of its down-regulation occurs at E16.5 (14). Therefore, Math5, Cath5, and Xath5 exhibit a similar expression pattern (refs. 12 and 14; Fig. 1). However, although Xath5 has been demonstrated to be a ganglion cell promoter (12), it is puzzling that forced Math5 expression leads to a bipolar cell fate rather than a ganglion cell fate in the Xenopus retina (14). This discrepancy has been explained by several possibilities including differences in protein properties (14). Our data show that Math5 and Cath5 have similar abilities in the activation of cBrn3c expression and promotion of ganglion cell production in the chicken, suggesting that all Ath5 factors play a conserved role in different species.
Transcriptional Cascade Controlling Retinal Ganglion Cell Development.
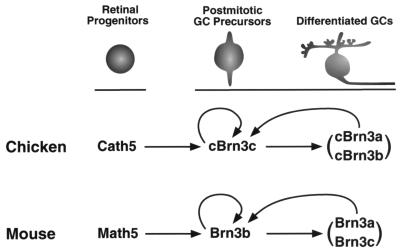
During mouse retinogenesis, Math5 may be able to directly activate the expression of Brn3b because it can transactivate a Brn3b promoter and activate cBrn3c expression in the chicken (Figs. 3–5). However, other mechanisms must operate to maintain Brn3b expression in differentiated ganglion cells, because Math5 is only transiently expressed in progenitors and perhaps newly generated ganglion cells (14). Our data indicate cross-regulation and autoregulation by Brn3 factors as the possible mechanisms for the persistence of Brn3b expression in the adult retina (Fig. 6). All Brn3 factors, including Brn3a, Brn3b, and Brn3c, can be shown to transactivate a Brn3b promoter and to activate cBrn3c expression in the chicken (Figs. 4 and 5). Therefore, the expression of Brn3b can be cross-activated by Brn3a and Brn3c, and autoactivated as well. Similarly, autoregulation recently has been implicated as a mechanism for the maintenance of Brn3a expression in the adult (31). On the other hand, Brn3b appears to be also required for activating the expression of Brn3a and Brn3c because in the developing Brn3b−/− retina, the expression of Brn3a and Brn3c is greatly down-regulated (15–17). This regulation may be direct because Brn3b has been shown to be capable of transactivating a Brn3a promoter (31). Cross-regulation between transcription factors appears to be a conserved feature for controlling eye development. In Drosophila, a network of transcription factors subject to cross-regulation is involved in the regulation of eye morphogenesis (32, 33).
Figure 6.
Schematic illustrating regulatory relationships between Ath5 and Brn3 factors during retinal ganglion cell development. In the chicken, Cath5 may directly activate cBrn3c expression, which in turn may activate the expression of cBrn3a and cBrn3b. The maintenance of cBrn3c expression may be achieved via positive autoregulation and feedback activation by cBrn3a and cBrn3b. An analogous transcriptional cascade may control retinal ganglion cell development in the mouse except that Math5 is responsible for the initial expression of Brn3b instead of Brn3c.
Based on the data accumulated in the literature and presented in this report, we propose that Ath5 and Brn3 factors constitute a transcriptional cascade regulating the specification, differentiation, and survival of retinal ganglion cells (Fig. 6). During chicken retinogenesis, Cath5 may function in competent progenitors to promote commitment of ganglion cell fates and activate cBrn3c expression. The activation of cBrn3c expression in postmitotic ganglion cell precursors then promotes ganglion cell differentiation and survival. In differentiated ganglion cells, cBrn3c may activate the expression of cBrn3a and cBrn3b, and its expression may be subject to positive autoregulation and feedback control by cBrn3a and cBrn3b. During mouse retinogenesis, an analogous transcriptional cascade controls ganglion cell development. Math5 is responsible for the initiation of expression of Brn3b, which in turn activates the expression of Brn3a and Brn3c. The expression of Brn3b in differentiated ganglion cells is then maintained by a combination of autoactivation and feedback regulation by Brn3a and Brn3c. Although it remains to be determined what regulates the expression of Cath5 and Math5, multiple midline signals including Nodal signaling have been implicated in the control of ath5 expression in the developing zebrafish retina (29).
Acknowledgments
We are grateful to Drs. Nadean Brown and Tom Glaser for the Math5 cDNA. We thank Drs. Aaron Shatkon, James Millonig, and Feng Qiu for critical reading of the manuscript. This work was supported by grants from the National Institutes of Health (EY12020) and the Alexanderine and Alexander L. Sinsheimer Fund. M.X. is a Sinsheimer Scholar.
Abbreviations
- E
embryonic day
- TUNEL
terminal deoxynucleotidyltransferase-mediated dUTP nick end labeling
- AP
human placental alkaline phosphatase
- NF200
200-kDa neurofilament protein
References
- 1.Cepko C L, Austin C P, Yang X, Alexiades M, Ezzeddine D. Proc Natl Acad Sci USA. 1996;93:589–595. doi: 10.1073/pnas.93.2.589. [DOI] [PMC free article] [PubMed] [Google Scholar]
- 2.Cepko C L. Curr Opin Neurobiol. 1999;9:37–46. doi: 10.1016/s0959-4388(99)80005-1. [DOI] [PubMed] [Google Scholar]
- 3.Young R W. Anat Rec. 1985;212:199–205. doi: 10.1002/ar.1092120215. [DOI] [PubMed] [Google Scholar]
- 4.Prada C, Puga J, Perez-Mendez L, Lopez R, Ramirez G. Eur J Neurosci. 1991;3:559–569. doi: 10.1111/j.1460-9568.1991.tb00843.x. [DOI] [PubMed] [Google Scholar]
- 5.Waid D K, McLoon S C. Neuron. 1995;14:117–124. doi: 10.1016/0896-6273(95)90245-7. [DOI] [PubMed] [Google Scholar]
- 6.McCabe K L, Gunther E C, Reh T A. Development (Cambridge, UK) 1999;126:5713–5724. doi: 10.1242/dev.126.24.5713. [DOI] [PubMed] [Google Scholar]
- 7.Austin C P, Feldman D E, Ida J A, Jr, Cepko C L. Development (Cambridge, UK) 1995;121:3637–3650. doi: 10.1242/dev.121.11.3637. [DOI] [PubMed] [Google Scholar]
- 8.Furukawa T, Mukherjee S, Bao Z Z, Morrow E M, Cepko C L. Neuron. 2000;26:383–394. doi: 10.1016/s0896-6273(00)81171-x. [DOI] [PubMed] [Google Scholar]
- 9.Pittack C, Jones M, Reh T A. Development (Cambridge, UK) 1991;113:577–588. doi: 10.1242/dev.113.2.577. [DOI] [PubMed] [Google Scholar]
- 10.Guillemot F, Cepko C L. Development (Cambridge, UK) 1992;114:743–754. doi: 10.1242/dev.114.3.743. [DOI] [PubMed] [Google Scholar]
- 11.Zhao S, Barnstable C J. Brain Res. 1996;723:169–176. doi: 10.1016/0006-8993(96)00237-5. [DOI] [PubMed] [Google Scholar]
- 12.Kanekar S, Perron M, Dorsky R, Harris W A, Jan L Y, Jan Y N, Vetter M L. Neuron. 1997;19:981–994. doi: 10.1016/s0896-6273(00)80391-8. [DOI] [PubMed] [Google Scholar]
- 13.Perron M, Opdecamp K, Butler K, Harris W A, Bellefroid E J. Proc Natl Acad Sci USA. 1999;96:14996–15001. doi: 10.1073/pnas.96.26.14996. [DOI] [PMC free article] [PubMed] [Google Scholar]
- 14.Brown N L, Kanekar S, Vetter M L, Tucker P K, Gemza D L, Glaser T. Development (Cambridge, UK) 1998;125:4821–4833. doi: 10.1242/dev.125.23.4821. [DOI] [PubMed] [Google Scholar]
- 15.Gan L, Xiang M, Zhou L, Wagner D S, Klein W H, Nathans J. Proc Natl Acad Sci USA. 1996;93:3920–3925. doi: 10.1073/pnas.93.9.3920. [DOI] [PMC free article] [PubMed] [Google Scholar]
- 16.Xiang M. Dev Biol. 1998;197:155–169. doi: 10.1006/dbio.1998.8868. [DOI] [PubMed] [Google Scholar]
- 17.Erkman L, McEvilly R J, Luo L, Ryan A K, Hooshmand F, O'Connell S M, Keithley E M, Rapaport D H, Ryan A F, Rosenfeld M G. Nature (London) 1996;381:603–606. doi: 10.1038/381603a0. [DOI] [PubMed] [Google Scholar]
- 18.Gan L, Wang S W, Huang Z, Klein W H. Dev Biol. 1999;210:469–480. doi: 10.1006/dbio.1999.9280. [DOI] [PubMed] [Google Scholar]
- 19.Liu W, Khare S L, Liang X, Peters M A, Liu X, Cepko C L, Xiang M. Development (Cambridge, UK) 2000;127:3237–3247. doi: 10.1242/dev.127.15.3237. [DOI] [PubMed] [Google Scholar]
- 20.Wang S W, Gan L, Martin S E, Klein W H. Mol Cell Neurosci. 2000;16:141–156. doi: 10.1006/mcne.2000.0860. [DOI] [PubMed] [Google Scholar]
- 21.Xiang M, Gan L, Li D, Zhou L, Chen Z Y, Wagner D, O'Malley B W, Jr, Klein W, Nathans J. Cold Spring Harbor Symp Quant Biol. 1997;LXII:325–336. [PubMed] [Google Scholar]
- 22.Fekete D M, Cepko C L. Mol Cell Biol. 1993;13:2604–2613. doi: 10.1128/mcb.13.4.2604. [DOI] [PMC free article] [PubMed] [Google Scholar]
- 23.Xiang M, Zhou L, Peng Y W, Eddy R L, Shows T B, Nathans J. Neuron. 1993;11:689–701. doi: 10.1016/0896-6273(93)90079-7. [DOI] [PubMed] [Google Scholar]
- 24.Xiang M, Zhou L, Nathans J. Visual Neurosci. 1996;13:955–962. doi: 10.1017/s0952523800009184. [DOI] [PubMed] [Google Scholar]
- 25.Sciavolino P J, Abrams E W, Yang L, Austenberg L P, Shen M M, Abate-Shen C. Dev Dyn. 1997;209:127–138. doi: 10.1002/(SICI)1097-0177(199705)209:1<127::AID-AJA12>3.0.CO;2-Z. [DOI] [PubMed] [Google Scholar]
- 26.Xiang M, Zhou L, Macke J P, Yoshioka T, Hendry S H, Eddy R L, Shows T B, Nathans J. J Neurosci. 1995;15:4762–4785. doi: 10.1523/JNEUROSCI.15-07-04762.1995. [DOI] [PMC free article] [PubMed] [Google Scholar]
- 27.Yamada T, Pfaff S L, Edlund T, Jessell T M. Cell. 1993;73:673–686. doi: 10.1016/0092-8674(93)90248-o. [DOI] [PubMed] [Google Scholar]
- 28.Wood J N, Bevan S J, Coobe P R, Dunn P M, Harmar A, Hogan P, Latchman D S, Morrison C, Rougon G, Theveniau M, et al. Proc R Soc London Ser B. 1990;241:187–194. doi: 10.1098/rspb.1990.0084. [DOI] [PubMed] [Google Scholar]
- 29.Masai I, Stemple D L, Okamoto H, Wilson S W. Neuron. 2000;27:251–263. doi: 10.1016/s0896-6273(00)00034-9. [DOI] [PubMed] [Google Scholar]
- 30.Morrow E M, Furukawa T, Lee J E, Cepko C L. Development (Cambridge, UK) 1999;126:23–36. doi: 10.1242/dev.126.1.23. [DOI] [PubMed] [Google Scholar]
- 31.Trieu M, Rhee J M, Fedtsova N, Turner E E. J Neurosci. 1999;19:6549–6558. doi: 10.1523/JNEUROSCI.19-15-06549.1999. [DOI] [PMC free article] [PubMed] [Google Scholar]
- 32.Desplan C. Cell. 1997;91:861–864. doi: 10.1016/s0092-8674(00)80475-4. [DOI] [PubMed] [Google Scholar]
- 33.Czerny T, Halder G, Kloter U, Souabni A, Gehring W J, Busslinger M. Mol Cell. 1999;3:297–307. doi: 10.1016/s1097-2765(00)80457-8. [DOI] [PubMed] [Google Scholar]


