Abstract
Background
The Accreditation Council for Graduate Medical Education (ACGME) uses a 29-question Resident Survey for yearly residency program assessments. This article describes methodology for aggregating Resident Survey data into 5 discrete areas of program performance for use in the accreditation process. This article also describes methodology for setting thresholds that may assist Residency Review Committees in identifying programs with potential compliance problems.
Methods
A team of ACGME staff and Residency Review Committee chairpersons reviewed the survey for content and proposed thresholds (through a modified Angoff procedure) that would indicate problematic program functioning.
Results
Interrater agreement was high for the 5 content areas and for the threshold values (percentage of noncompliant residents), indicating that programs above these thresholds may warrant follow-up by the accrediting organization. Comparison of the Angoff procedure and the actual distribution of the data revealed that the Angoff thresholds were extremely similar to 1 standard deviation above the content area mean.
Conclusion
Data from the ACGME Resident Survey may be aggregated into internally consistent and consensually valid areas that may help Residency Review Committees make more targeted and specific judgments about program compliance.
Background
Residents' evaluation of their program is an important source of information about program quality and resident satisfaction. The Accreditation Council for Graduate Medical Education (ACGME) currently uses the 29-question Resident Survey for yearly residency program assessments. Although these data are necessarily limited to residents' and fellows' point of view, the information collected via the survey is congruent with the areas most frequently cited in program reviews and has been found to be highly predictive of Residency Review Committee (RRC) accreditation actions.1
In the current accreditation process, RRCs generally use the Resident Survey results during program review only after the findings have been verified by a site visit.2 The survey results display individual resident response frequencies, reflecting programs' substantial compliance or noncompliance. This article details the methodology and creation of aggregate data reports that facilitate comparison of a particular program's responses with the national cohort. An important element of the methodology is the aggregation of individual survey questions into domains of program functioning, including availability of resources and compliance with the duty hour requirements. These aggregate reports would allow RRCs to receive an interim (between site visits) assessment of the program, noting any problematic issues that might require further investigation from the RRC.
Methods
A panel of 8 ACGME staff (data analysts, senior staff, and executive directors) convened to discuss methods for aggregating data from the Resident Survey. In addition, all members of the ACGME Council of Review Chairs (CRC, comprising all RRC chairpersons) were asked to participate. Of this group, 24 of the 26 members submitted data.
Initial efforts focused on setting a priori thresholds for each individual item using an Angoff methodology, a commonly used standard-setting technique for determining test pass and fail rates.3 Data were summarized from the 2007 and 2008 Resident Surveys and were made available to all raters. These data were the population percentage of noncompliant residents for each item. Participating raters were asked to indicate, for each item, the category or area of residency education (based on the item content), the importance of each item (on a 3-point scale), and the threshold (or cutoff value) for the percentage of noncompliant residents that would be of concern to the RRC (ie, result in a progress report, further investigation, or, potentially, a citation). After the initial rating and discussion, staff submitted final ratings for each item. Although some discussion occurred among members of the CRC, this group submitted final ratings only.
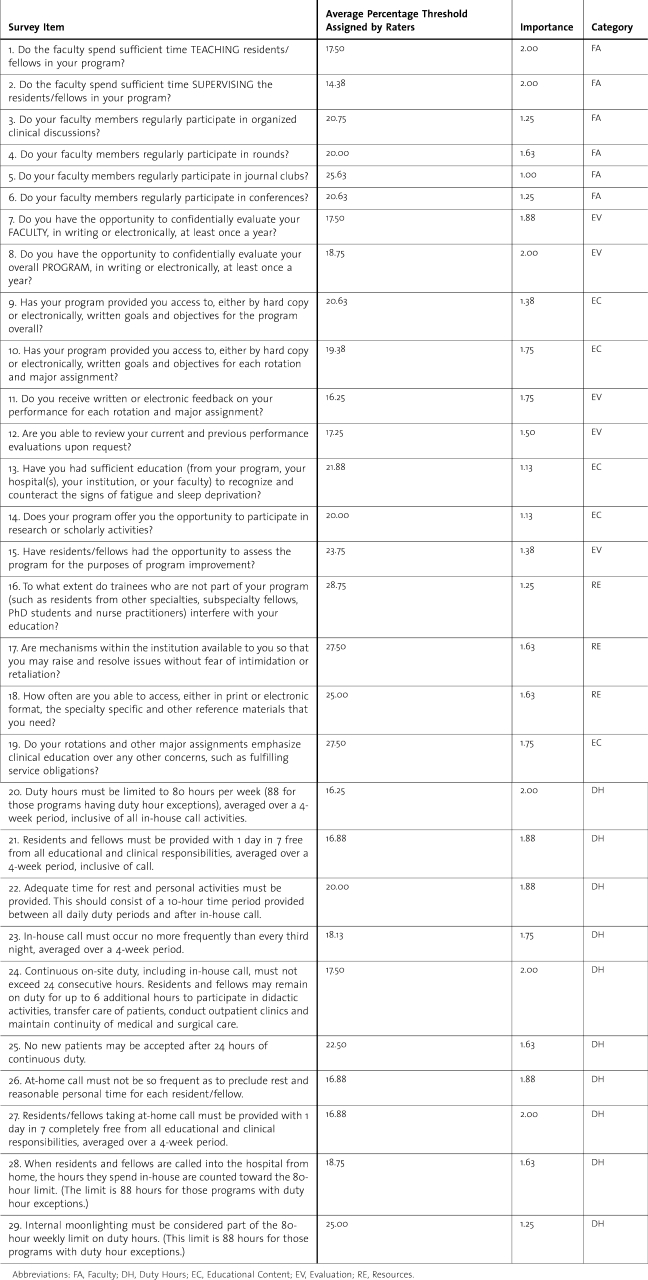
No differences were found between staff and CRC ratings; all t tests for each item's percentage noncompliant and importance were not significantly different between the 2 groups. Table 1 summarizes the staff ratings. Combined staff and CRC ratings gave means between 19.03 and 20.75 for all the items.
Table 1.
Percentage Noncompliant Thresholds, Importance, and Category Assigned for Each Resident Survey Item
Item Categories
The response categories for the items were Faculty, Evaluation, Educational Content, Resources, and Duty Hours. These are areas of the Common Program Requirements, as well as common citation categories.
Raters consistently placed the 29 Resident Survey items into 1 of the 5 categories previously noted. For 22 of the items, the category agreement was at least 90%; 10 of the items were at 100% agreement (for categorization as Duty Hours). In the other 7 items, 4 were assigned the majority category (having 70% or greater agreement). The 3 remaining items were almost evenly split between 2 categories. A subgroup of the raters decided the final categorization of these items.
Fleiss generalized kappa for the categories ranged from .72 to 1.00, with an overall kappa of .93, showing very strong interrater agreements.4 Because staff results did not differ significantly from the chair ratings, we report only staff ratings so as to reduce the number of raters included, as an increase in raters may inflate agreement statistics.
Grouping the Resident Survey data into these 5 categories, we found acceptable Cronbach alphas indicating internal consistency for each of the 5 categories, with 4 of the categories having alphas of .89 or greater. The alpha for Resources was lower, but still acceptable at .59.5 The low alpha for Resources is possibly related to the relatively small number of items (3) in this group.
Item Importance
The importance of each item was highly correlated (an average r of −.52) with item thresholds (described later). Raters assigned the most important items the lowest percentage threshold. Table 1 shows the average (across raters) importance for each item. Because importance was simply the inverse of item thresholds, importance was eliminated from further calculations.
Item Thresholds of Noncompliance
Raters assigned relatively uniform percentages (those that would be of concern), although the items ranged from 5% to 75%. This may indicate the relative importance for each item; some items would need to have large percentages of noncompliant responses (eg, 75%) to be of concern to the RRC, while others may be so important that a small percentage of noncompliant resident response would be of concern.
The ratings showed high interrater agreement for each of the items (Cronbach alphas ranged from .71 to .96).6
Computation of Cutoff Scores Based on the Angoff Procedure
Cutoff means (values at or beyond which would indicate serious issues with the item) ranged from 14.4% to 28.8%.
We computed noncompliance for each item (percentage noncompliance) in the combined 2007 and 2008 samples of the Resident Survey. This combined sample included every accredited core program and every accredited subspecialty program having at least 4 fellows (N = 5 610). For those items with 2 response options (eg, Yes or No), noncompliance was calculated as the simple percentage of the noncompliant response (No). For items with more than 2 response options (eg, Sometimes, Always, Never), the noncompliance was the weighted percentage of noncompliance, such that the most extreme (eg, Never) noncompliant value was assigned 1 and the least extreme noncompliant response (eg, Sometimes) was assigned 5. In this way, we conservatively computed item noncompliance so that the most noncompliant responses were weighted most heavily. In these data there are at most 2 noncompliant responses for each question.
Each of the Resident Survey items' actual data (percentage noncompliance) was then compared with the rater-determined thresholds. If a program's response was at or above the threshold, the program was flagged (ie, given a score of “1”) on that item. Then, the scores were summed by category, so that each program had a score ranging from 0 (the program did not exceed the threshold on any of the items of this category) to the maximum number of questions in the aggregated category (the program exceeded the threshold on all the items in this category).
This method resulted in a relatively high percentage of programs flagged, 45% of programs for some categories. To ensure a conservative estimate, we selected the cutoff as having at least 2 questions above the threshold.
Comparing the Angoff Cutoffs With Those Based Solely in the Data
In conjunction with the a priori Angoff procedure for determining thresholds in the Resident Survey, we also examined a more data-driven approach. Using the categories from the Angoff procedure, we calculated means (based on the noncompliant responses previously described) by category, for the combined 2007 and 2008 samples of the Resident Survey. We also calculated standard deviations around these means, and took 1 standard deviation above the mean (on any of the 5 categories) as our initial threshold.
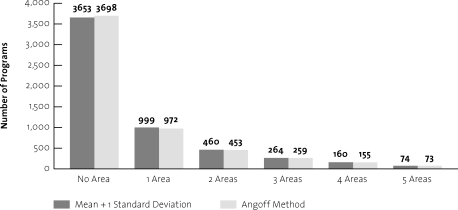
The Angoff procedure and the mean + 1 standard deviation yielded remarkably similar results. The number of programs above the cutoff points is the same as those above the 1 standard deviation mean for noncompliance rates. figure 1 shows the 2 methods.
Figure 1.
Number of Programs Over Thresholds: Angoff Method Compared With Mean + 1 Standard Deviation
Given the similarity of the results with the 2 methods, the data-driven approach is preferable. First, the thresholds are derived solely from available data and rely on no expert judgments or calculations based on estimates of RRC actions. Second, the metric of mean + 1 standard deviation is readily understood and robust. Third, and perhaps most importantly, this approach allows for examination of the distribution of the data (eg, how far away is the value from the mean, how far beyond one standard deviation), rather than a binary decision point (is the program mean above the Angoff cutoff).
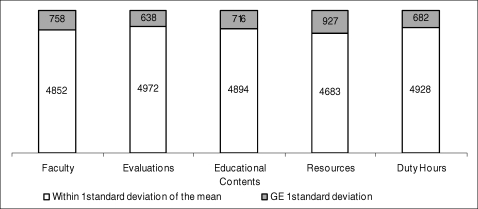
For these reasons, we have selected the mean + 1 standard deviation in the 5 areas as our metric to determine potential noncompliance in the Resident Survey. figure 2 shows the number of programs beyond the mean + 1 SD for each area, and figure 3 shows the actual means and standard deviations for each area.
Figure 2.
Number of Programs Above Mean + 1 Standard Deviation
Figure 3.
Mean Noncompliance for Each Area, With Standard Deviation Shown
Results
Producing Summary Reports for use of the RRCs
As well as providing more succinct information for each program (in the 5 areas and based on the population of programs) at the time of review, we created reports, by specialty, for the use of each RRC. These reports, based on the most recent available data, provide the RRCs with the most extreme (and thus the most potentially noncompliant) outliers in the survey.
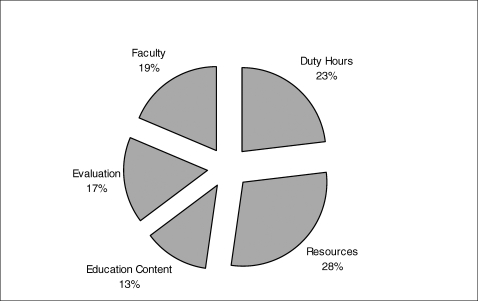
Applying this methodology to the 2007 and 2008 Resident Survey administrations (N = 5 610 programs), 1 957 programs fall above the established thresholds; of these, 51% are programs are in the “above only 1 threshold” category (figure 1). Further exploration of the data show that these “1 threshold only” programs account for as many as 75% of programs in a particular specialty, suggesting that this criterion may be too stringent. figure 4 lists the areas and percentage of programs having each of these “1 threshold only” programs.
Figure 4.
Distribution of Noncompliant Areas for Those Programs Having Only One Area Above a Threshold
To be as conservative as possible in bringing only those most extreme noncompliant programs to the attention of the RRC, we produced reports for each RRC that included only programs having at least 2 areas above the thresholds. The reports for each RRC are sorted by most to least noncompliant, and are accessible using a secured Accreditation Data System log-in. The reports are currently available and may be accessed under the Resident Survey Reports heading in the Accreditation Data System, under Resident Survey Threshold Reports.
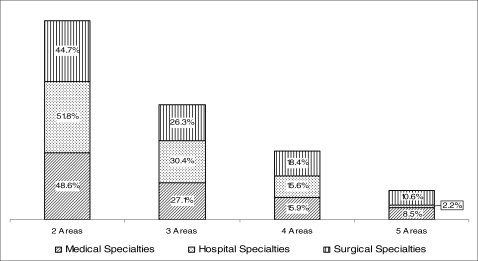
There are differences by specialty grouping for the threshold areas. figure 5 shows the percentages of programs having at least 2 areas above the threshold by specialty groups (Medical, Hospital, or Surgical). Despite these differences, particularly at the “5 areas above threshold” level, the percentages of programs at each level are comparable across the specialty groups.
Figure 5.
Percentage of Programs Having 2, 3, 4, or 5 Areas Above the Thresholds
Conclusion
This analysis is important because aggregate reports can help RRCs make more informed decisions. Although single-item reports are useful, the aggregate data offer areas or patterns of noncompliance. To provide the RRCs with the most accurate and current data available, reports will include only the most recent set of Resident Survey data. For the 2009 administration of the Resident Survey, new population-based means and standard deviations are calculated, and any programs at 2 thresholds or higher will appear on interactive (searchable) reports, with RRC users able to drill down into the data. These reports will be updated at the end of each Resident Survey data collection period.
Footnotes
Kathleen D. Holt, PhD, is Senior Data Analyst with the Accreditation Council for Graduate Medical Education and the Department of Family Medicine, University of Rochester, NY; and Rebecca S. Miller, MS, is Vice President, Applications and Data Analysis with the Accreditation Council for Graduate Medical Education.
References
- 1.Holt K. D., Miller R. S., Philibert I., Heard J. K., Nasca T. J. Resident perspectives on the learning environment: data from the ACGME's resident survey. Acad. Med. In press. [DOI] [PubMed]
- 2.Philibert I., Miller R., Heard J. K., Holt K. D. Assessing duty hour compliance: practical lessons for programs and institutions. J Grad Med Educ. 2009;1(1):166–167. doi: 10.4300/01.01.0029. [DOI] [PMC free article] [PubMed] [Google Scholar]
- 3.Angoff W. A. Educational Measurement. Washington, DC: American Council on Education; 1971. [Google Scholar]
- 4.Fleiss J. L. Statistical Methods for Rates and Proportions. 2nd ed. New York: John Wiley; 1981. [Google Scholar]
- 5.Landis J. R., Koch G. G. The measurement of observer agreement for categorical data. Biometrics. 1977;33:159–174. [PubMed] [Google Scholar]
- 6.Bland J. M. Statistics notes: Cronbach's alpha. BMJ. 1997;314:572. doi: 10.1136/bmj.314.7080.572. [DOI] [PMC free article] [PubMed] [Google Scholar]


