Abstract
We question whether homeostasis alone adequately explains microbial responses to environmental stimuli, and explore the capacity of intra-cellular networks for predictive behavior in a fashion similar to metazoan nervous systems. We show that in silico biochemical networks, evolving randomly under precisely defined complex habitats, capture the dynamical, multi-dimensional structure of diverse environments by forming internal models that allow prediction of environmental change. We provide evidence for such anticipatory behavior by revealing striking correlations of Escherichia coli transcriptional responses to temperature and oxygen perturbations—precisely mirroring the co-variation of these parameters upon transitions between the outside world and the mammalian gastrointestinal-tract. We further show that these internal correlations reflect a true associative learning paradigm, since they show rapid de-coupling upon exposure to novel environments.
Although originally conceived in the context of human physiological adaptation (1), homeostasis has also become the de facto framework for understanding cellular behavior. In its most essential form, the homeostatic response is an attempt to maintain the “constancy of the internal state” in response to perturbations resulting from environmental fluctuations (e.g. expression of osmoprotectants in response to osmolarity stress). When such fluctuations are essentially random (unpredictable), the cell may directly or indirectly sense the perturbation and enact the appropriate response program. On the other hand, if such variations are perfectly predictable, such as periodic changes in photon flux due to the earth's rotation, an internal model (circadian rhythm) can be utilized in order to anticipate relevant changes. The organism can then mount a “pre-emptive” response, for example by gearing up the photosynthetic machinery before sunrise. The widespread utilization of internal circadian models, from unicellular cyanobacteria to humans (2), suggests that this predictive mode of behavior confers significant fitness advantages to organisms that have evolved it.
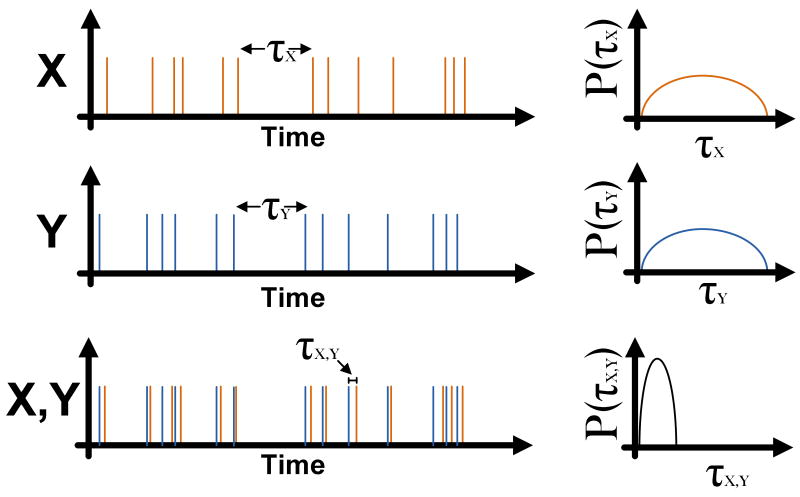
Environmental variables that show purely random fluctuations or perfectly periodic rhythms define idealized extremes. In fact, some parameters whose fluctuations may seem random when viewed in isolation, can, nevertheless, be highly “predictable” when considered in the temporal context of variation in other parameters (Fig. 1). As such, variations in one environmental variable can convey significant information about variation in another. For example, a bacterium may experience strong co-variation in temperature and photon flux as it traverses the upper layers of a stratified marine ecosystem. Such temporally structured correlations can exist on multiple time-scales, reflecting the highly structured (non-random) habitats of free-living organisms. Temporal delays are a typical feature of these correlations. For example an increase in temperature may herald an impending decrease in O2 levels some 20 minutes later. An organism that is capable of learning (internalizing) these correlations, can then exploit them in order to anticipate vital changes in the environment, for example preparing for resource fluctuations or mounting protective responses to extreme perturbations.
Figure 1. Predictability emerges from temporal context of correlated random variables.
When viewed in isolation, events X and Y have a random temporal structure (left) as manifested by the large uncertainty in the inter-event interval (right). However, the occurrence of event X is highly predictable within the temporal context of event Y (left), with a relatively tight distribution of temporal delay between the two events (right).
Within metazoans, the basic capacity for predictive behavior requires complex neural network architecture. Here we hypothesize that an analog of this capacity exist in unicellular microbes that is implemented by networks of biochemical reactions. To demonstrate this potential, we have developed a biochemically realistic computer simulation for evolving populations of organisms under precisely defined environments where multiple time-varying signals encode information about resource abundance. Randomly evolving biochemical networks of these organisms form internal representations of their dynamic environments that enable predictive behavior. We provide experimental evidence for this capacity by revealing strong correlations in genome-wide transcriptional responses of E. coli to transitions in oxygen and temperature. These correlations do not reflect an essential biochemical coupling between oxygen and temperature since they are rapidly de-coupled in the context of selection in a novel environment.
Emergence of predictive behavior in simulated biochemical networks
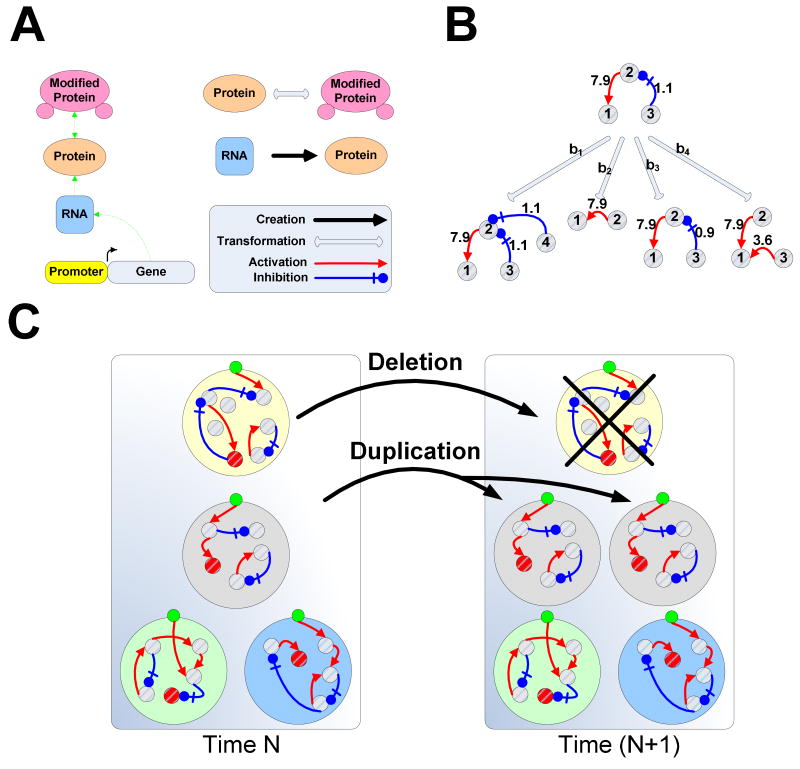
Computational simulations of biological systems are yielding unique insights into a variety of fundamental questions in biology (3-10). We developed a simulation framework, called EVE (Evolution in Variable Environment), aimed at exploring the capacity of biochemical networks to evolve predictive internal models of complex environments (11). Within EVE, biochemical networks are structured around the ‘central dogma’ and they evolve in an asynchronous and stochastic manner, achieving the temporal dynamics of cascades of biochemical interactions/transformations, including transcription, translation and protein modification, that are present in real cells (Fig. 2A). Each node in the biochemical network of an organism is parameterized by several continuous variables mapping to biological parameters such as basal expression, degradation and regulatory strength. At any point during the simulation, random mutations (e.g. transcription-rate change, node duplication, node deletion) may alter any of the organism's parameters and consequently its phenotype (Fig. 2B). Environmental signals, conveying information about resources, may couple and stochastically regulate any action (e.g. transcription, translation, or transformation) in the organism's internal network. A node can regulate any other node, although one may restrict unlikely interactions based on a probabilistic model (for instance we may choose to make RNA-mediated protein modification a rare event). Each organism possesses a generic and stable response pathway through which it can interact with the environment, whether for energy extraction or response to stress. Expression of the response pathway is modeled to have a high energy cost, thus there is strong selection for organisms whose response correlates with the appropriate environmental event (e.g. presence of food). Organisms evolve in the context of a constant population size, where growth-rate is directly proportional to the amount of energy per cell. The energy of each cell depends on the energy extraction rate from the environment as well as on the metabolic demands of expressing and maintaining network components (Fig. 2C).
Figure 2. A biochemically realistic simulation framework.
(A) The networks are structured around the ‘central dogma’: activation of gene transcription creates RNA that can be translated to protein, which in turn, can be modified to change its state. (B) Possible mutational scenarios for generic nodes (representing either RNA, protein or modified protein). For example, node 3 can be duplicated (b1), destroyed (b2), undergo mild mutation, changing the strength of its regulation of node 2 (b3), or mutate strongly causing its decoupling from node 2 and coupling to node 1 (b4). In addition to network-topology, mutations may change node parameters such as basal transcription-rate, degradation-rate and interaction affinity. (C) Organisms that accumulate enough energy undergo duplication and increase their representation in the population. Duplication is accompanied by deletion of the organism with the least energy in the population.
Within this in silico ecology, evolving organisms with random initial networks compete against each other in structured environments where signals and resources fluctuate with a distinct temporal correlation-structure. In a typical experiment, the combinatorial states of multiple signals convey information about the availability of extractable energy resources in the near future. Cells that can efficiently “learn” such correlations are able to express the energy-extracting metabolic pathway at the appropriate time, giving them significant fitness advantage over their competitors.
We conducted large-scale simulations of nine temporally structured environments across mutation-rates spanning four orders of magnitude. A variety of environments were imposed, including those that selected for one of five delayed logic gates, oscillators, bi-stable switches, and duration inference mechanisms. Despite the complex nature of many of these environments, high-fitness organisms emerged with variable success-rate in every case (Table S1 & Fig. S4, S5).
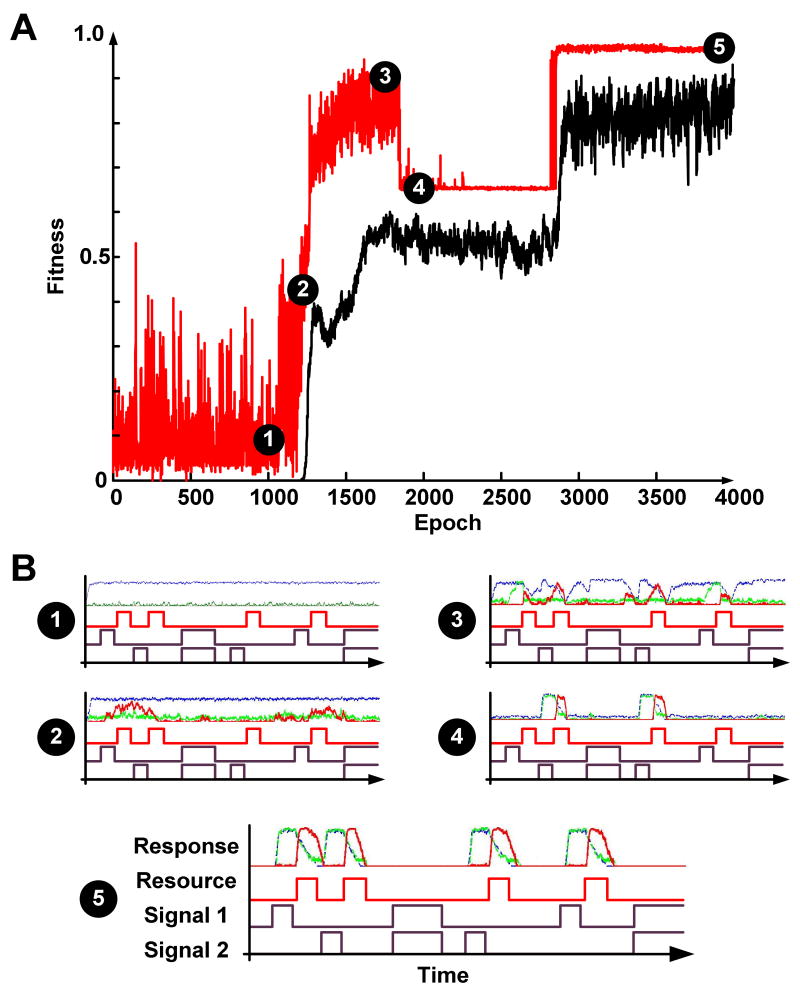
The full historical documentation of the evolutionary process in EVE allowed us to connect evolutionary dynamics, phenotypic behavior, and network structure in ways that are difficult to do in naturally evolved biological systems. In a particularly challenging environment, the abundance of resource (food) is related to the signals through a delayed dynamic exclusive OR (XOR) relationship, where resources become abundant shortly (within 1000 time units) after the presence of either signals S1 or S2 alone, but not when they co-occur. Fitness is defined as the Pearson-correlation (PC) between the abundance of resource and response pathway expression. Interestingly, the fitness trajectory of the fittest organism displays non-monotonic behavior (Fig. 3A). In the first 5.4·106 time units (1100 epochs), there is no stable phenotype in the population whose response protein expression correlates well with the presence of resources in the environment (Fig. 3B-1). However, several advantageous mutations in the next 4.5·105 time units (100 epochs) lead to a phenotype where the expression of the response protein loosely couples to the presence of signal S1 and absence of signal S2 (Fig. 3B-2). Subsequent mutations give rise to a fit (PC > 0.8) but unstable phenotype (Fig. 3B-3) where a noisy dynamic XOR is achieved. Interestingly, instead of stabilization of the fittest phenotype at the time, we observe an abrupt decline of fitness and subsequent fixation to a sub-optimal fitness peak (Fig. 3B-4). The next fitness increase occurs after 3.6·105 time units (800 epochs) when a gene duplication event (Fig. S6) allowed the newly formed gene and its protein and modified protein products to take on their own course in evolution, thus giving rise to an optimal final phenotype (Fig. 3B-5). The evolutionary impact of gene duplication was also observed in other experiments, most of which displayed monotonically increasing fitness trajectories (Fig. S7, S8).
Figure 3. Emergence of a delayed XOR phenotype.
(A) Fitness trajectory of an experiment where the presence of one (and only one) signal indicates the future availability of resources. Red and black lines correspond to the highest and mean fitness in the population at each epoch (4500 time units), respectively. (B) The phenotypic behavior of the fittest organism at different points along the evolutionary trajectory. Each subplot consists of four rows: the first row depicts the abundance profiles of the RNA (blue), protein (green), and modified protein (red) of the response pathway. The second, third and fourth rows correspond to resource abundance, and environmental signals S1 and S2 respectively.
The evolved biochemical networks displayed a high level of redundancy, as the majority of single node/link “knock-outs” did not reveal a significant fitness effect. In an attempt to identify a “minimal network” that was sufficient to express the evolved behavior, we devised a procedure (11) that sequentially knocks out links until the network hits a critical mass that cannot be reduced without a significant (>5%) decrease in the organism's fitness. We found that such minimal networks were significantly more informative about the relationship between network structure and function as compared with the initial networks they were derived from.
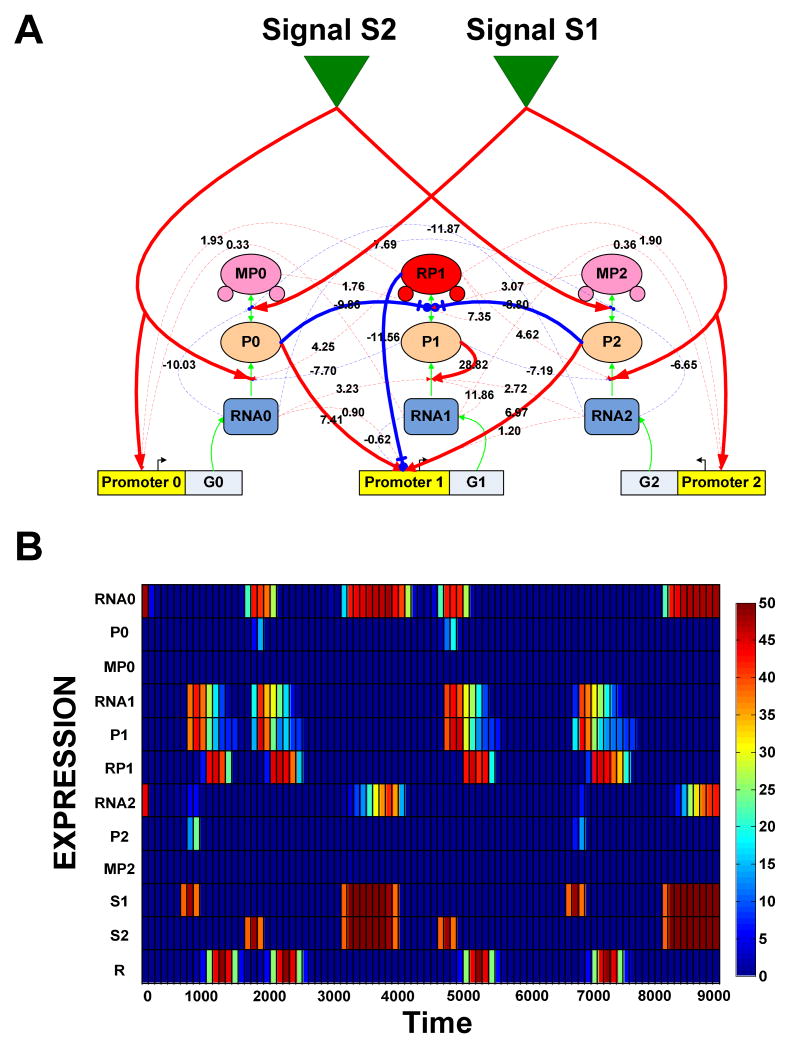
The full and minimal networks belonging to the fittest organism evolved under the delayed XOR selection are displayed in Figure 4A, while the expression profile of all the nodes in the full network is depicted in Figure 4B. From a total of 31 links, only 11 were found to be essential as defined above. Signals S1 and S2 serve as direct observable environmental inputs, while resources can be harvested only when response protein (RP1) is expressed. The presence of S1 catalyzes the translation of RNA2 to P2 which, in turn, leads to the activation of G1 and subsequent translation of its RNA to P1. Once P1 is created, it can undergo modification and become response protein RP1. However, this step is not completed immediately, as P2 also inhibits P1's modification. Modification can occur after Signal S1 goes down and the high degradation rate of P2 leads to its rapid drop. This, in turn, introduces a delay-interval that is large enough to allow the expression of RP1 to coincide precisely with the presence of the resource. Once expressed, RP1, operating in a negative feedback loop, represses the expression of G1. The low degradation rate of RNA1 and self-activation of P1 contribute to the network's ability to stay in standby mode where P1 molecules are constantly replenished but not modified to RP1. With this mechanism, the time-delay is easily tuned through changes in the kinetic constants of one protein, namely P2. Similarly, when only S2 is present, the response pathway is activated through P0 in an analogous fashion. However, when both signals S1 and S2 are present, P0 and P2 are unable to activate G1 transcription since the two environmental signals cross catalyze the modification of these proteins to their inactive states (MP0 and MP2). Additionally, the high degradation-rate of MP0 and MP2 makes transitions from MP0 to P0 or from MP2 to P2 unlikely. In general, careful inspection revealed how behavior emerges from the topology and kinetics of the evolved minimal networks (11). However, we found variable success in the ability of standard reverse-engineering methods (12,13) to reveal network structure from behavior (Fig. S14-S16).
Figure 4. Network topology and expression profiles of molecular components.
(A) The regulatory network of an organism evolved under low mutation-rate within a delayed dynamic XOR environment. Each node represents either mRNA/siRNA (RNA), protein (P) or modified protein (MP). The environmental resource harvested at each time point is proportional to the number of response protein molecules (red RP1 node) and resource abundance at the time. Regulatory interactions can be positive (activating – red arrows) or negative (repressing – blue arrows). Solid lines represent essential links. (B) Expression profile of all nine nodes, environmental signals (S1 and S2) and resource (R) during two epochs (9000 time units). The color-bar refers to the number of molecules present.
Correlated transcriptional responses of E. coli to oxygen and temperature perturbations
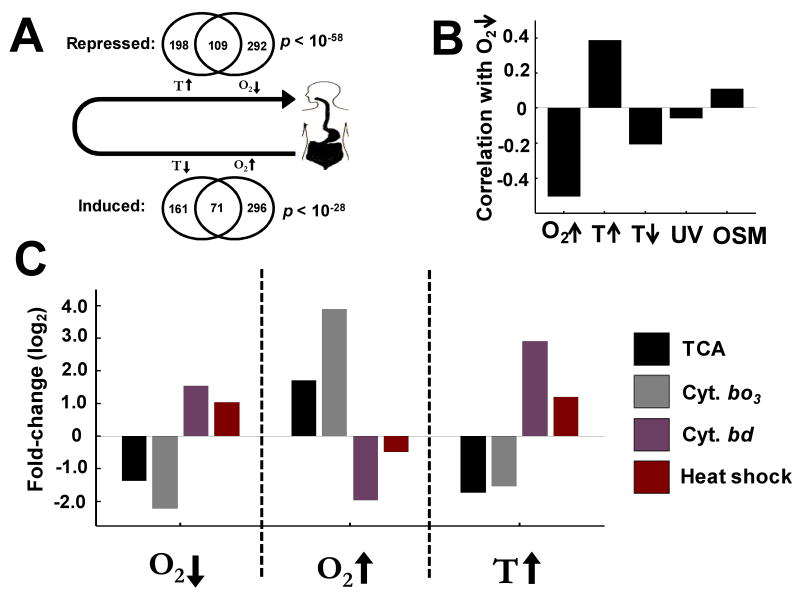
The evolution of predictive behavior in simulated networks suggested that this capacity might exist in naturally evolved microbial networks. Looking for evidence of such predictive modeling requires knowledge of microbial habitat structures well beyond what currently exists for most organisms. However for some microbes, recurrent transitions in and out of a dominant niche are accompanied by deterministic correlations in important environmental variables. For example, transition from the outside environment into the oral cavity exposes the bacterium E. coli to an immediate increase in temperature from ambient (<30° C) to 37° C. This is followed by an impending drop in oxygen levels as the bacterium transitions into the gastrointestinal-tract (Fig. 5A). The complex ecology of the mammalian GI-tract imposes strong competitive selection for colonization (14). In this setting, appropriate expression of adaptive functions confers strong fitness advantages. From a purely homeostatic perspective, physiological transition from aerobic to anaerobic respiration should only take place immediately after a drop in oxygen levels. However, the fitness benefits of such a reflexive response will not be optimal, both in terms of shutting down superfluous capacities such as aerobic respiration, as well as the time delay required to fully express beneficial functions such as anaerobic respiration. On the other hand, if bacteria utilize the immediate increase in temperature as a predictive signal of impending oxygen drop, they could respond in an anticipatory fashion and be in the optimal physiological state at the time oxygen levels drop. If this were true, we would expect that an increase in temperature may lead to a very similar physiological response to a decrease in oxygen—even in the presence of maximal oxygen levels. To test this hypothesis, we utilized microarray transcriptional profiling (15) to observe the global cellular state correlates of such physiological responses. Oxygen and temperature were precisely controlled in the context of growth within bioreactors (11). These experiments included temperature transitions between 25° C and 37° C, and shifts between anaerobic (0% dissolved O2) and aerobic (16-21% dissolved O2) growth. Duplicate experiments revealed highly reproducible temperature and oxygen profiles (Fig. S17) and gene expression patterns (Fig. S18).
Figure 5. Global responses to oxygen and temperature perturbations reflect ecological correlation-structure.
(A) Transition of E. coli between the outside environment and the mammalian GI-tract is accompanied by anti-correlated changes in temperature and oxygen. Correspondingly, highly significant overlap is seen in sets of genes down-regulated by temperature up-shift and oxygen down-shift (transition into the GI-tract; p value < 10-58). Similarly, a highly significant overlap is seen in sets of genes induced by temperature down-shift and oxygen up-shift (transition out of the GI-tract; p value < 10-28). (B) Pearson-correlation of global changes in gene expression between oxygen down-shift and other perturbations: oxygen up-shift (r =-0.50; p < 10-148); temperature up-shift (r = +0.39; p < 10-79); UV exposure (r = -0.06; p < 0.02); osmolarity stress (r = 0.11; p < 10-7). (C) The average fold-change (log2) of TCA (acnA, acnB, fumB, gltA, mdhA, sdhA, sdhB, sucB, sucC, and sucD), cytochrome bo3 (cyoA, cyoB, cyoC, cyoE), cytochrome bd (cydA and cydB), and heat-shock regulated (clpB, dnaJ, grpE, hslU, hslV, htpX, and lon) genes displaying reciprocal cross-regulation of aerobic respiration and heat-shock in response to temperature and oxygen perturbations.
Consistent with the predictive behavioral framework above, we found a striking correlation between global transcriptional responses to temperature up-shift and oxygen downshift, corresponding to the transition of E. coli into the GI-tract (Fig. 5A). For instance, we found a highly significant overlap between the set of genes down-regulated by temperature up-shift and those down-regulated by oxygen down-shift (hyper-geometric p < 10-58). As predicted, these genes are highly enriched for aerobic respiration functions such as TCA and glyoxylate cycle (p < 10-8) and cytochrome bo3 oxidase complex (p < 10-4), the dominant electron donor under aerobic conditions (16).
Likewise, temperature down-shift and oxygen up-shift—corresponding to the transition out of the GI-tract—induced strikingly similar gene expression responses (p < 10-28) (Fig. S19). We also compared the global similarity in transcriptional responses through Pearson-correlation (Fig. 5B). As expected, oxygen down-shift and oxygen up-shift are highly anti-correlated (Pearson r = -0.50; p < 10-148), as are reverse perturbations in temperature (r = -0.56; p < 10-171). The strong correlation between temperature up-shift and oxygen down-shift was most striking (r = +0.39; p < 10-79), consistent with the similarity in differentially regulated genes. The relatively small correlation between oxygen down-shift and unrelated perturbations such as UV exposure (17) (r = -0.06; p < 0.02) and osmolarity stress (18) (r = 0.11; p < 10-7) makes it unlikely that these correlated behaviors may be due to a generic response to external perturbations (Fig. 5B), for example as seen in the common “stress” response in yeast (19). What is remarkable is the rapid transcriptional reprogramming from aerobic to anaerobic, during temperature increase, as reflected by the strong repression of genes encoding components of the TCA cycle and cytochrome bo3 oxidase complex (Fig 5C). These changes are accompanied by concomitant induction of genes encoding components of cytochrome bd oxidase complex—the preferred electron donor in low oxygen environments (16) (Fig. 5C). Strikingly, this anaerobic transcriptional reprogramming occurs under a highly aerobic environment (18% dissolved O2), representing a seemingly mal-adaptive response—at least from the perspective of a homeostatic behavioral framework. Alternatively, the anticipatory repression of oxidative respiration seems adaptive when viewed in the context of the ecologically crucial transition of E. coli from the external world into the mammalian GI-tract.
We observed that a temperature up transition (25° C to 37° C) led to the induction of the heat-shock response regulon, a set of operons activated through the expression and activity of the σ32 alternative sigma factor (20). This robust response allowed us to explore the possibility of a reciprocal associative coupling, in which oxygen down-shift leads to the induction of heat-shock response in much the same way as temperature up-shift causes respiratory repression. Remarkably, this is exactly what was observed (Fig. 5C).
Novel environment de-couples correlated transcriptional responses
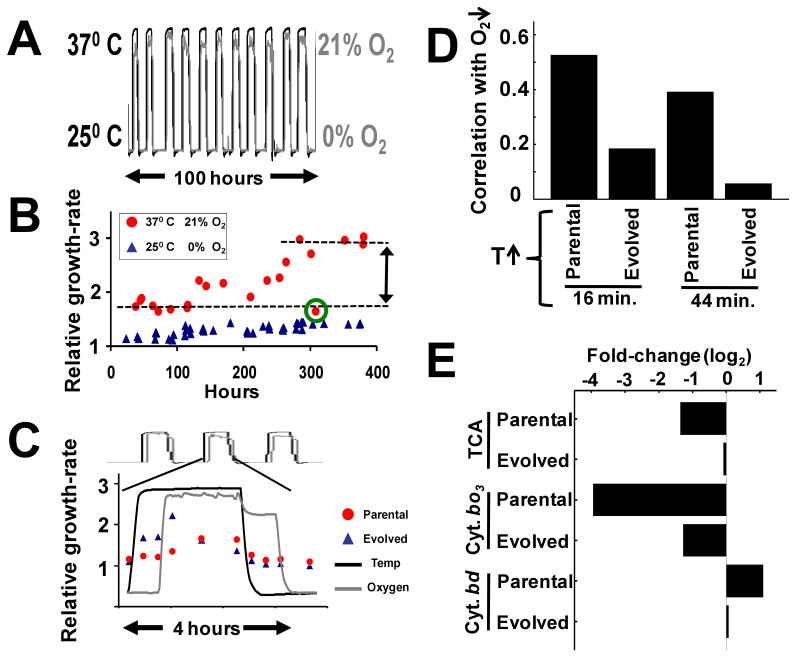
Strong correlations in the expression of distinct biochemical pathways may reflect compatibility or mutual dependence between pathway operations—as seen in the spatio-temporal separation of photosynthesis and nitrogen fixation in cyanobacteria (21)—rather than reflecting ecological structure per se. To show that the observed correlations are due to an “associative learning” paradigm, we evolved a population of E. coli under a dynamic environment where temperature and oxygen fluctuations had a temporal relationship counter to that expected in nature (Fig. 6A). Wild-type E. coli should perform poorly in this environment, since a temperature-up transition will cause repression of aerobic respiratory pathways, just when oxygen saturation has achieved maximum levels. This inverted environment imposes strong selection for bacteria that fully or partially de-couple the native behavior since it is highly mal-adaptive. If such a reprogramming can occur, then the originally observed correlated responses to temperature up-shift and oxygen down-shift cannot be due to hard biochemical constraints, but rather is a reflection of a common response to correlated changes in temperature and oxygen that has evolved over geological timescales.
Figure 6. Partia l de-coupling of correlated responses over the course of laboratory experimental evolution.
(A) Experimental evolution of E. coli under a dynamic environment where temperature and oxygen vary in an opposite pattern to the ecologically native structure. An oxygen transition from 0% to 21% occurs 40 minutes following a temperature transition from 25° C to 37° C. Similarly oxygen transition from 21% to 0% occurs 40 minutes following a temperature decrease from 37° C to 25° C. To avoid periodic selection, duration intervals were sampled randomly from a Gaussian distribution (11). (B) Progressive increase in population growth-rate over the course of 42 cycles of selection. Growth-rate within the optimal regime (37° C and 21% oxygen) showed more than a 50% increase, whereas growth-rate increased only marginally within the 25° C and 0% oxygen regime. The measurement circled in green is an outlier. (C) High-resolution monitoring of growth-rate in the parental and evolved strains shows that the fitness differential is maximal immediately following the oxygen up-shift. (D) Pearson-correlation of global changes in gene expression between the oxygen down-shift and temperature up-shift perturbations in the parental and evolved strains at both 16 and 44 minutes following the temperature up transition. (E) Average fold-change of gene expression for the TCA, cytochrome bo3, and cytochrome bd gene sets at 16 minutes following a temperature increase in both the parental and evolved strains.
Previous evolution experiments in bacteria have focused mostly on adaptation to “steady-state” conditions, with significant fitness increases (∼30%) occurring only after thousands of generations (22). Remarkably, we witnessed highly significant increases in reproductive fitness occurring in fewer than a hundred generations (Fig. 6B). Population growth-rate increased only marginally in the 25° C and 0% O2 regime, but showed more than a 50% increase within the 37° C and 21% O2 regime. We attribute this rapid increase in fitness to the strength of recurring selection occurring over many cycles. Isolation of individual bacteria and competition with the parental strain (23) confirmed the fitness advantage of the evolved strain (Fig. S21).
To more precisely characterize the nature of the fitness gains, we monitored growth-rates of the parental and evolved strains at a higher temporal resolution across a single cycle of selection (Fig. 6C). As expected, the increase in growth-rate of the evolved strain was most pronounced immediately following the temperature up-shift, with maximal difference occurring immediately following the up-shift in O2. This suggests that, at least, part of the adaptation may have been due to the expected de-coupling between temperature up-shift and repression of aerobic respiration. To test this possibility, we performed transcriptional profiling of parental and evolved strains in the context of a temperature up-shift from 25° C to 37° C. We utilized Pearson-correlation to measure the global similarity in transcriptional responses between the original oxygen down-shift perturbation and temperature up-shift. As can be seen, the strong correlation between oxygen down-shift and temperature up-shift is significantly reduced in the evolved strain as compared to the parental strain, both at early (16 minutes; parental: r = 0.53, evolved: r = 0.19) and late (44 minutes; parental: r = 0.39; evolved: r = 0.06) time-points (Fig. 6D). This global decrease in correlation in the evolved strain was accompanied by a dramatic reduction in repression of TCA and cytochrome bo3 oxidase genes, and reduction in the activation of genes encoding cytochrome bd oxidase (Fig. 6E).
Discussion
Molecular interactions and catalytic transformations are the fundamental building-blocks in all cellular processes. We have shown that randomly evolving networks, composed of these basic elements, are able to internalize dynamic representations of their complex environments, enabling predictive behavior. We show that this ability explains the seemingly mal-adaptive responses of E. coli to transitions in oxygen and temperature. Although the correlated responses we observe precisely correspond to transitions of E. coli between the outside world and the mammalian GI-tract, it is formally possible that they may be due to some other unknown ecological structure in the wild. What is critical, however, is that these correlations show ‘plasticity’ over the course of laboratory experimental evolution. Our findings motivate an alternative interpretation of cellular responses to nominally stressful stimuli (24); such “stresses” may be important to the organism not because of their immediate and direct fitness consequences, but in the information that they convey about the overall state of the environment and its likely trajectory.
Here, we have focused on the utility of learning temporally phased correlations for predicting sequential events in the environment (e.g. temperature up followed by oxygen down). However, the reciprocal cross-regulation of heat-shock response and respiratory repression (Fig. 5C) suggests that E. coli also uses the simultaneous co-occurrence of events to reinforce perception of its immediate environment. More generally, the correlation-structure of the environment can be internalized as a probabilistic model in the high-dimensional space of an organism's complete sensory perception. As such, the very organization of microbial regulatory networks may, in large part, represent the physical instantiation of this probabilistic model. From this perspective, inferences regarding the functional utility of biological networks, including notions of modularity and optimality, may be incomplete, or even inaccurate, without considering habitat structure. Experiments of the flavor we have presented here may allow biologists to essentially go in the opposite direction and “reverse-engineer” ecological structure from physiological observations in the laboratory. Although our work on E. coli focused primarily on parameter changes that reflect macroscopic transitions in the environment, the dominant forces shaping microbial regulatory networks are likely to arise from microscopic correlation-structure present in the complex chemistry of intra and inter-species interactions (25,26).
Supplementary Material
Acknowledgments
We thank the members of the Tavazoie laboratory for helpful comments on the manuscript. Sohail Tavazoie, Masoud Tavazoie and Georgios Vassilakis provided crucial feedback throughout the preparation of this manuscript. IT was supported by the Burroughs Wellcome Fellowship. ST was supported by grants from the NSF (CAREER), DARPA, NHGRI and NIGMS (P50 GM071508).
References
- 1.Cannon WB. The Wisdom of the Body. W.W. Norton; New York, NY: 1932. [Google Scholar]
- 2.Bell-Pedersen D, et al. Nat Rev Genet. 2005;6:544–556. doi: 10.1038/nrg1633. [DOI] [PMC free article] [PubMed] [Google Scholar]
- 3.Bergman A, Siegal ML. Nature. 2003;424:549–552. doi: 10.1038/nature01765. [DOI] [PubMed] [Google Scholar]
- 4.Francois P, Hakim V. Proc Natl Acad Sci U S A. 2004;101:580–585. doi: 10.1073/pnas.0304532101. [DOI] [PMC free article] [PubMed] [Google Scholar]
- 5.Francois P, Hakim V, Siggia ED. Mol Syst Biol. 2007;3:154. doi: 10.1038/msb4100192. [DOI] [PMC free article] [PubMed] [Google Scholar]
- 6.Kashtan N, Alon U. Proc Natl Acad Sci U S A. 2005;102:13773–13778. doi: 10.1073/pnas.0503610102. [DOI] [PMC free article] [PubMed] [Google Scholar]
- 7.Lenski RE, Ofria C, Collier TC, Adami C. Nature. 1999;400:661–664. doi: 10.1038/23245. [DOI] [PubMed] [Google Scholar]
- 8.Rodrigo G, Carrera J, Jaramillo A. CEJB. 2007;2:233–253. [Google Scholar]
- 9.Soyer OS, Pfeiffer T, Bonhoeffer S. J Theor Biol. 2006;241:223–232. doi: 10.1016/j.jtbi.2005.11.024. [DOI] [PubMed] [Google Scholar]
- 10.Wagner A. Proc Natl Acad Sci U S A. 2005;102:11775–11780. doi: 10.1073/pnas.0501094102. [DOI] [PMC free article] [PubMed] [Google Scholar]
- 11.Supporting online material
- 12.Basso K, et al. Nat Genet. 2005;37:382–390. doi: 10.1038/ng1532. [DOI] [PubMed] [Google Scholar]
- 13.Segre D, Deluna A, Church GM, Kishony R. Nat Genet. 2005;37:77–83. doi: 10.1038/ng1489. [DOI] [PubMed] [Google Scholar]
- 14.Dunne C. Inflamm Bowel Dis. 2001;7:136–145. doi: 10.1097/00054725-200105000-00010. [DOI] [PubMed] [Google Scholar]
- 15.Schena M, Shalon D, Davis RW, Brown PO. Science. 1995;270:467–470. doi: 10.1126/science.270.5235.467. [DOI] [PubMed] [Google Scholar]
- 16.Neidhardt FC, et al. Escherichia coli and Salmonella: Cellular and Molecular Biology. American Society for Microbiology; Washington, D. C.: 1996. [Google Scholar]
- 17.Courcelle J, Khodursky A, Peter B, Brown PO, Hanawalt PC. Genetics. 2001;158:41–64. doi: 10.1093/genetics/158.1.41. [DOI] [PMC free article] [PubMed] [Google Scholar]
- 18.Cheung KJ, Badarinarayana V, Selinger DW, Janse D, Church GM. Genome Res. 2003;13:206–215. doi: 10.1101/gr.401003. [DOI] [PMC free article] [PubMed] [Google Scholar]
- 19.Gasch AP, et al. Mol Biol Cell. 2001;12:2987–3003. doi: 10.1091/mbc.12.10.2987. [DOI] [PMC free article] [PubMed] [Google Scholar]
- 20.Yura T, Nakahigashi K. Curr Opin Microbiol. 1999;2:153–158. doi: 10.1016/S1369-5274(99)80027-7. [DOI] [PubMed] [Google Scholar]
- 21.Berman-Frank I, et al. Science. 2001;294:1534–1537. doi: 10.1126/science.1064082. [DOI] [PubMed] [Google Scholar]
- 22.Lenski RE, Travisano M. Proc Natl Acad Sci U S A. 1994;91:6808–6814. doi: 10.1073/pnas.91.15.6808. [DOI] [PMC free article] [PubMed] [Google Scholar]
- 23.Elena SF, Lenski RE. Nat RevGenet. 2003;4:457–469. doi: 10.1038/nrg1088. [DOI] [PubMed] [Google Scholar]
- 24.Giaever G, et al. Nature. 2002;418:387–391. doi: 10.1038/nature00935. [DOI] [PubMed] [Google Scholar]
- 25.Bassler BL, Losick R. Cell. 2006;125:237–246. doi: 10.1016/j.cell.2006.04.001. [DOI] [PubMed] [Google Scholar]
- 26.Branda SS, Vik S, Friedman L, Kolter R. Trends Microbiol. 2005;13:20–26. doi: 10.1016/j.tim.2004.11.006. [DOI] [PubMed] [Google Scholar]
Associated Data
This section collects any data citations, data availability statements, or supplementary materials included in this article.


