Abstract
The phantoms used in standardized dose assessment are based on a median (i.e., 50th percentile) individual of a large population, for example, adult males or females or children of a particular age. Here we describe phantoms that model instead the influence of obesity on specific absorbed fractions (SAFs) and dose factors in adults.
Methods
The literature was reviewed to evaluate how individual organ sizes change with variations in body weight in mildly and severely obese adult men and women. On the basis of the literature evaluation, changes were made to our deformable reference adult male and female total-body models. Monte Carlo simulations of radiation transport were performed. SAFs for photons were generated for mildly and severely obese adults, and comparisons were made to the reference (50th) percentile SAF values.
Results
SAFs studied between the obese phantoms and the 50th percentile reference phantoms were not significantly different from the reference 50th percentile individual, with the exception of intestines irradiating some abdominal organs, because of an increase in separation between folds caused by an increase in mesenteric adipose deposits. Some low-energy values for certain organ pairs were different, possibly due only to the statistical variability of the data at these low energies.
Conclusion
The effect of obesity on dose calculations for internal emitters is minor and may be neglected in the routine use of standardized dose estimates.
Keywords: radiobiology/dosimetry, radiopharmaceuticals, anatomy, radiation dosimetry
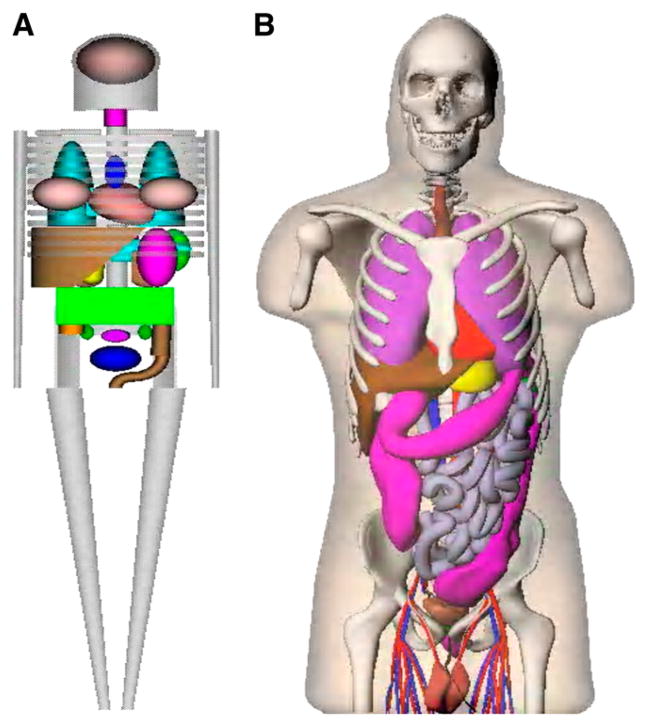
For the calculation of radiation dose estimates for radiopharmaceuticals, stylized anatomic models developed in the 1960s and 1970s have been used, in the form of tables of specific absorbed fractions (SAFs) (1) and dose factors (DFs), implemented in standardized computer programs such as MIRDOSE (2) and OLINDA/EXM code (3). The mathematic descriptions of the body and its organs were formulated on the basis of descriptive and schematic materials from general anatomy references (4). The goal was to make the mathematic equations simple, thus minimizing computing time. Later improvements led to a family of stylized models, which include individuals of both sexes at several ages (5) and pregnant women (6). For several decades, these simplified models have been used on practical applications as the standard mathematic representations of the reference man (4) and other individuals in radiation protection, nuclear medicine, and medical imaging (7,8). However, use of stylized modeling has obvious shortcomings. Recently, models involving increased realism, based on image-based data from human subjects, have replaced the traditional stylized models (9), using updated anatomic information on reference adults and children (10). These models use nonuniform rational B-splines (NURBS), as developed by Dr. Paul Segars of Duke University, to define body and organ surfaces (11). Figure 1 shows a comparison of the traditional stylized models and the newer realistic models.
FIGURE 1.
Comparison of traditional stylized (A) and realistic human (B) body models used in dose assessment.
The phantoms used in standardized dose assessment are based on a median (i.e., 50th percentile) individual of a large population, for example, adult males or females or children of a particular age. We have created a series of phantoms to represent heavier and lighter normal-stature individuals, as described in a companion paper (12). Here we describe phantoms that model instead the influence of obesity on SAFs and DFs in adults. We created models of adult men and women to represent states of moderate and severe obesity, to compare SAFs and DFs with those from our reference adult models representing median (50th percentile) adults (9). The magnitude of the variability in these dose values with obesity in nuclear medicine (and other) populations is important to an understanding of the uncertainty that may exist in the application of the reported values for average individuals to other members of the population (13).
MATERIALS AND METHODS
Initially, 50th percentile phantoms were constructed reflecting the recommended values of ICRP 89 (10) for organ and body mass (9). The body contours of these normal-stature individuals were then adjusted locally to represent the proportions of an obese individual and then scaled according to typical body circumferences. Visceral adipose tissue (VAT) areas, comprising the abdominal organs at the L-4 vertebra, for 2 body mass index groups defined in the literature (14) were used to expand the large and small intestines in the anteroposterior and lateral dimensions from the median individual using an ellipsoidal shape. VATs (cm2) for men and women were calculated as (with age for women in years):
The kidneys were shifted in the anterior direction because of an increase in volume of para- and perirenal fat deposits placed behind them (14). This was done using estimates of the fat deposit thicknesses, which increased proportionally with body mass index. Table 1 shows the tissue densities used in the various organs of the models, following the recommendations of ICRP 89 (10).
TABLE 1.
Organ Density Values Used in Anthropomorphic Models
| Organ | Density (g·cm23) |
|---|---|
| Adrenals | 1.02 |
| Salivary glands | 1.045 |
| Esophagus | 1.045 |
| Stomach | 1.045 |
| Small intestine | 1.045 |
| Large intestine | 1.045 |
| Rectosigmoid | 1.045 |
| Liver | 1.045 |
| Gallbladder | 1.045 |
| Pancreas | 1.045 |
| Brain | 1.04 |
| Heart | 1.03 |
| Eyes | 1.026 |
| Lungs | 0.30 |
| Skeleton | 1.3 |
| Spleen | 1.06 |
| Thymus | 1.025 |
| Thyroid | 1.05 |
| Kidneys | 1.05 |
| Bladder | 1.03 |
| Testes | 1.04 |
| Prostate | 1.03 |
| Ovaries | 1.05 |
| Uterus | 1.05 |
Once the phantoms had been scaled using a scaling tool developed by Dr. Segars (9), the file was converted to voxel format and introduced into the GEANT4 radiation transport code (15). The GEANT coding system does not currently allow explicit modeling of NURBS surfaces; thus, the NURBS models must be converted to voxel format before radiation transport calculations. SAFs for photons of starting energies 0.01, 0.015, 0.02, 0.03, 0.05, 0.1, 0.2, 0.5, 1.0, 1.5, 2, and 4 MeV were generated for most body organs, and comparisons were made to both SAFs from the 50th percentile NURB ICRP 89 phantoms. The phantoms have more than 40 source and target regions important to internal dosimetry—the 26 regions identified in the OLINDA/EXM code (3), plus new regions—including the esophagus, salivary glands, and prostate gland—provided in the new realistic phantoms. The influence of obesity was thought to affect SAFs for organs in the abdominal region more than organs in the head and upper chest or lower torso. Thus, we compared SAFs from the abdominal region with those from the 50th percentile phantoms to evaluate the effects of anatomic changes from the reference individuals on the SAFs (which correlate with differences in DFs).
RESULTS
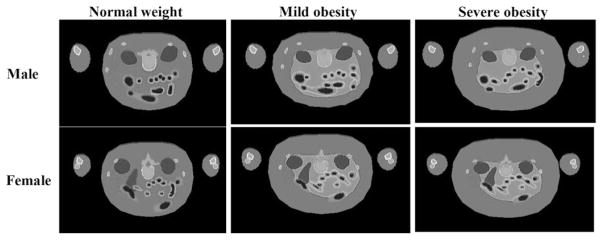
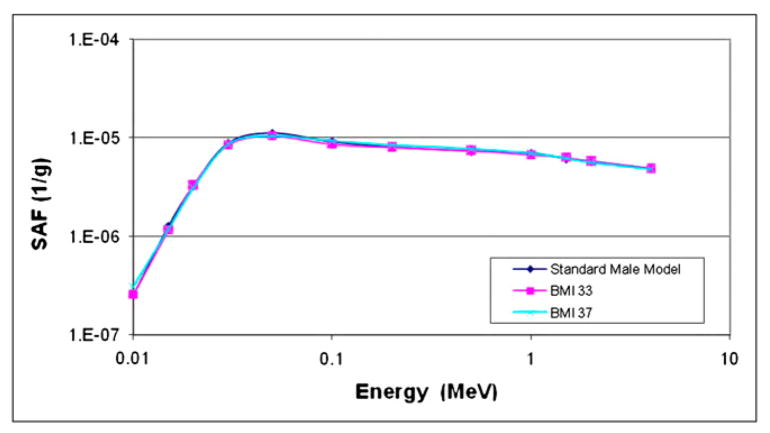
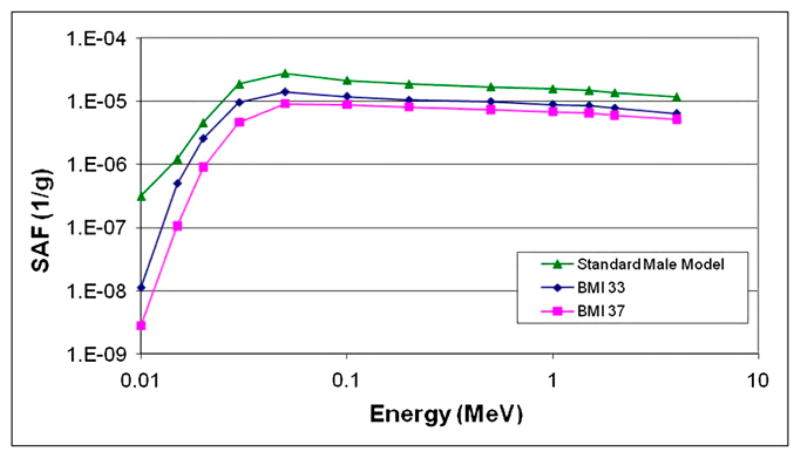
Figure 2 shows cross sections of cases of mild and severe obesity in men and women, modeled with these phantoms. Organ masses within the 2 phantoms did not change from the values in the 50th percentile individuals; they were merely surrounded by layers of adipose tissue, and, in the few cases noted here, slightly displaced. Most SAFs studied did not significantly differ between the obese phantoms and the 50th percentile reference phantoms (example, spleen irradiating lungs; Fig. 3). SAFs for the intestines and most abdominal organs were lower, because of an increase in separation between folds caused by an increase in mesenteric adipose deposits. Figure 4 shows SAFs for large intestines irradiating liver in the adult male, for which most SAFs were about 1.6 times lower in the moderate obesity case and 2 times lower in the severe obesity case than in the reference model. Similar values were seen for kidneys and large intestines. However, for the lungs and large intestines, the SAFs for the moderate obesity case were indistinguishable from the normal case, and those for severe obesity were only 1.3 times higher than those for the reference model. For the heart and large intestines, the values were 1.2 and 1.5 times higher than the 50th percentile values for the moderate and severe obesity cases.
FIGURE 2.
Cross section of male and female models demonstrating mild and severe obesity, in comparison to normal-weight individuals. Scale is different in the 3 plots.
FIGURE 3.
SAFs for spleen irradiating lungs in standard adult male and 2 obese adult male models (body mass index of 33, moderately obese; body mass index of 37, severely obese).
FIGURE 4.
SAFs for large intestines irradiating liver in standard adult male and 2 obese adult male models (body mass index of 33, moderately obese; body mass index of 37, severely obese).
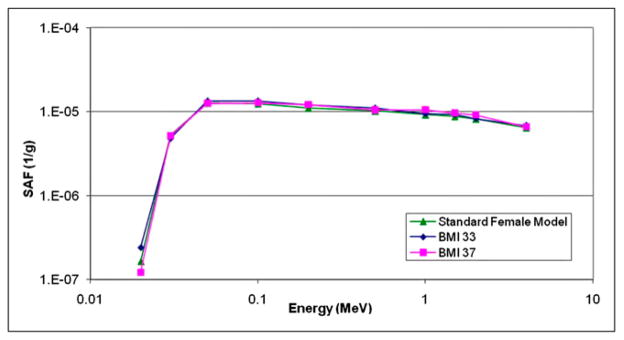
For several organ pairs, the SAFs at low energies were different, but other SAFs were not significantly different. Figure 5 shows an example of the heart irradiating pancreas in the female models.
FIGURE 5.
SAFs for heart irradiating pancreas in standard adult female and 2 obese adult female models (body mass index of 33, moderately obese; body mass index of 37, severely obese).
DISCUSSION
These results show mostly minor variations in SAFs with obesity. SAFs for organs near the intestines were 20% to a factor of 2 higher, because of the expansion of the intestines modeled in the phantoms. At low energies, for which the contribution of radiation has little influence on the overall dose from a given radiopharmaceutical, changes that appear to be significant were reported, but these were at the lowest energies, at which the SAFs are quite low.
Changes in SAFs with obesity are only 1 variable contributing to the overall uncertainty in a radiopharmaceutical dose estimate. One of the major uncertainties in reported dose estimates for radiopharmaceuticals is the biokinetic model used to calculate the dose (13); this analysis suggested that uncertainties of up to a factor of 2 or more may be present in reported dose estimates, with large contributions in uncertainty being attributed to variations in individual biokinetics and organ sizes. If careful patient-specific dosimetry is performed—with attention paid to accurate data acquisition, analysis, and measurement of individual organ volumes—many of the biokinetic model uncertainties can be minimized, and the total uncertainty in the individual dose estimate can be reduced to perhaps plus or minus 10%–20% (13). Without individualized dosimetry (which is routinely done in external beam therapy but not for diagnostic applications of radiopharmaceuticals), any small variations in SAFs, such as were observed here, will be a minor contribution to the overall uncertainties in the dose values. Differences seen for the heavier and lighter normal-stature models (12) were more notable, on the order of 0.3%–1.1% per kilogram, or about 8%–30% overall. Values noted for most organs in this study of obesity were on the order of a few percentage points overall, except for the few cases noted, and may be neglected in the overall uncertainty of the dose estimates.
CONCLUSION
Obesity is a minor influence on the dose to organs from internal emitters. The major organs of obese individuals are mostly in the same positions as in nonobese individuals and are covered only by layers of adipose tissue, resulting in minor differences in backscattered radiation striking the organs. SAFs for most organs and energies were not appreciably different between these phantoms and the median (50th percentile) normal weight phantom. SAFs for the large and small intestines were found to be generally smaller in the more obese phantoms because of an increase in separation between folds caused by an increase in mesenteric adipose deposits. In addition, SAFs for the kidneys to other organs were found to slightly increase because of a decrease in separation from the abdominal organs caused by the deposition of peri- and pararenal adipose tissue behind the kidneys. This slight increase may vary between subjects, depending on actual individual spatial separations. These results were expected but have never been confirmed by calculation. Differences between normal-weight and obese individuals may thus be considered small, particularly considering the inherent uncertainties in all internal dose calculations (13).
References
- 1.Snyder WS, Ford MR, Warner GG. MIRD pamphlet no. 5, revised. New York, NY: The Society of Nuclear Medicine; 1978. Estimates of Specific Absorbed Fractions for Photon Sources Uniformly Distributed in Various Organs of a Heterogeneous Phantom. [Google Scholar]
- 2.Stabin MG. MIRDOSE: the personal computer software for use in internal dose assessment in nuclear medicine. J Nucl Med. 1996;37:538–546. [PubMed] [Google Scholar]
- 3.Stabin MG, Sparks RB, Crowe E. OLINDA/EXM: the second-generation personal computer software for internal dose assessment in nuclear medicine. J Nucl Med. 2005;46:1023–1027. [PubMed] [Google Scholar]
- 4.International Commission on Radiological Protection (ICRP) ICRP publication 23. New York, NY: Pergamon Press; 1975. Report of the Task Group on Reference Man. [Google Scholar]
- 5.Cristy M, Eckerman K. ORNL/TM-8381. Oak Ridge, TN: Oak Ridge National Laboratory; 1987. Specific Absorbed Fractions of Energy at Various Ages from Internal Photon Sources; pp. V1–V7. [Google Scholar]
- 6.Stabin M, Watson E, Cristy M, et al. ORNL report ORNL/TM-12907. Oak Ridge, TN: Oak Ridge National Laboratory; 1995. Mathematical models and specific absorbed fractions of photon energy in the nonpregnant adult female and at the end of each trimester of pregnancy. [Google Scholar]
- 7.International Commission on Radiation Units and Measurements (ICRU) ICRU report 47. Bethesda, MD: ICRU; 1992. Measurement of Dose Equivalents from External Photon and Electron Radiations. [Google Scholar]
- 8.International Commission on Radiological Protection (ICRP) ICRP Publication 80. Oxford, U.K: Pergamon Press; 1998. Radiation Dose to Patients from Radiopharmaceuticals: Addendum 2 to ICRP Publication 53, Also Includes Addendum 1 to ICRP Publication 72. [Google Scholar]
- 9.Stabin MG, Emmons MA, Segars WP, Fernald MJ. The Vanderbilt University reference adult and pediatric phantom series. In: Xu XG, editor. Handbook of Anatomical Models for Radiation Dosimetry. Philadelphia, PA: Taylor & Francis, Inc; 2009. pp. 337–346. [Google Scholar]
- 10.International Commission on Radiological Protection (ICRP) ICRP publication 89. Oxford, U.K: Elsevier Science, Ltd; 2003. Basic Anatomical and Physiological Data for Use in Radiological Protection: Reference Values. [Google Scholar]
- 11.Segars JP. PhD dissertation. Chapel Hill, NC: The University of North Carolina; 2001. Development and Application of the New Dynamic NURBS-Based Cardiac-Torso (NCAT) Phantom. [Google Scholar]
- 12.Marine PM, Stabin MG, Fernald MJ, Brill AB. Changes in radiation dose with variations in human anatomy: larger and smaller normal-stature adults. J Nucl Med. 2010;51:806–811. doi: 10.2967/jnumed.109.073007. [DOI] [PMC free article] [PubMed] [Google Scholar]
- 13.Stabin MG. Uncertainties in internal dose calculations for radiopharmaceuticals. J Nucl Med. 2008;49:853–860. doi: 10.2967/jnumed.107.048132. [DOI] [PubMed] [Google Scholar]
- 14.Bonora E, Micciolo R, Ghiatas AA, et al. Is it possible to derive a reliable estimate of human visceral and subcutaneous abdominal adipose tissue from simple anthropometric measurements? Metabolism. 1995;44:1617–1625. doi: 10.1016/0026-0495(95)90084-5. [DOI] [PubMed] [Google Scholar]
- 15.Agostinelli S, Allison J, Amako K, et al. Geant4: a simulation toolkit. Nucl Instrum Methods Phys Res A. 2003;506:250–303. [Google Scholar]


