

Abstract
Purpose
To evaluate the feasibility of spatially resolving the shear modulus of lung parenchyma using conventional 1H magnetic resonance elastography (MRE) imaging techniques in a small animal model.
Materials and Methods
A 10 cm diameter transmit-receive radio frequency coil was modified to include a specimen stage and a MRE pneumatic drum driver and needle system. MRE was performed on 10 male Sprague-Dawley rats using a 1H spin-echo based MRE imaging sequence with a field of view of 7 cm and slice thickness of 5 mm. Air filled lungs were imaged at transpulmonary inflation pressures of 5, 10, and 15 cm H2O while fluid filled lungs were imaged after infusion of 4 ml of normal saline.
Results
The average shear modulus of air filled lungs was 0.840 ± 0.0524 kPa, 1.07 ± 0.114 kPa and 1.30 ± 0.118 kPa at 5, 10 and 15 cm H2O, respectively. ANOVA analysis indicated that these population means were statistically significantly different from one another (F value = 26.279, P = 0.00004). The shear modulus of the fluid filled lungs was 1.65 ± 0.360 kPa.
Conclusions
It is feasible to perform lung MRE in small animals using conventional MR imaging technologies.
Keywords: shear modulus, transpulmonary pressure, lungs, magnetic resonance elastography
INTRODUCTION
It is appreciated that normal lung function is the result of a dynamic, multi scalar balance between applied forces and the intrinsic mechanical properties of lung and that mechanical forces play a fundamental role not only in the development and maintenance of cellular activities within the lung but also those processes associated with disease initiation and progression (1). In those diseases that directly affect lung parenchyma, such as acute lung injury (ALI) (2) and interstitial lung diseases (ILDs) (3), it is acknowledged that clinical outcome (full recovery or progression to end-stage fibrosis) is related to how the lung responds to regional changes to the mechanical properties of the parenchyma, most likely through the process of mechanotransduction (3). This is supported in part by the fact that the mechanical properties of the lung as a whole do not resemble those of its individual constituents as well as the relatively heterogenous initial spatial distribution of many parenchymal disease related lesions (4). The ability (or inability) of lung parenchyma to respond to local (i.e. regional) change to it’s micromechanical properties suggests that this may be a more sensitive and earlier predictor of parenchymal disease initiation and/or progression than global measures of lung function (3).
Despite evidence that indicates a direct relationship between the regional mechanical proerties of lung parenchyma and disease stage and progression in a variety of lung diseases including ALI(2) and ILD(3), critical scientific questions remain unanswered. For instance are regional changes in the mechanical properties of lung parenchyma a precursor to or a result of disease initiation and progression? Similarly, what is the relationship between regional parenchymal tissue mechanical properties and percolation, a recently proposed concept to describe the disassociation between the presentation of symptoms related to compromised lung function and the development of parenchymal lung pathology (4)? Although there are a variety of parameters that can be derived from standard lung function tests such as lung resistance, compliance, histeresivity and bulk modulus, none of these measures directly assess or spatially resolve the intrinsic mechanical properties of the lung parenchyma. What is needed is a method to quantify local lung parenchymal mechanical properties in order to answer these and other critical lung disease related questions.
A phase contrast based technique known as magnetic resonance elastography (MRE) (5) has been successfully applied to the study of the mechanical properties of a variety of solid organs (6–14). The technique is able to spatially resolve shear modulus, μ by encoding synchronized cyclic shear wave displacements into the phase of the MR signal followed by estimation of the spatial frequency of the shear wave, fspatial and substitution into the relationship: where ρ is the density of the material, and fmechanical is the frequency of excitation of the shear wave.
As a technique to study the mechanical properties of the lung, MRE holds great promise. However what is needed to fully characterize and study the intrinsic mechanical properties of both normal and diseased lung is a method for performing MRE on a conventional MR scanner using an appropriate animal model. More specifically, in those parenchmymal lung diseases in which the inflammatory response leads to end-stage fibrosis, such as in ILDs and ALI, MRE should be capable of differentiating between normal, inflamed and fibrotic lung. The most straight forward approach to answer this question is to perform MRE of the lung using 1H imaging techniques on a well studied and characterized model and to determine if MRE derived measures of shear modulus are consistent with previously reported measures obtained from similar animal models (15–17). The purpose of this work is to develop a small animal MRE model capable of studying the mechanical properties of lung parenchyma under both normal as well as partially flooded lung using conventional 1H MRE imaging techniques on a standard 1.5 Tesla MR scanner. The hypothesis of this work is that MRE derived measures of shear modulus will agree with previously published, independent measures and that partial flooding of the lung (the presence of fluid within alveolar spaces in which there are many small scale air liquid interfaces) biases measurements of parenchymal shear moduli towards higher values.
MATERIALS AND METHODS
Experimental Set Up
All experiments were performed on a Signa EXCITE 1.5 T MR scanner (GE Health Care, Milwaukee, WI). Figures 1(a) through (c) show the experimental set up that includes a custom built 10 centimeter diameter quadrature transmit-receive birdcage coil tuned to the resonant frequency of 1H (~64 MHz) that has been modified to include an adjustable stage for placement and positioning of a small animal specimen, as well as a passive drum driver with an acupuncture needle for direct mechanical interrogation of the organ under study. The drum driver is driven pneumatically by means of an audio speaker, waveform generator, and amplifier at the desired mechanical frequency, fmechanical. In this set up the tip of the needle is inserted directly into the lung resulting in a direct mechanical coupling between the passive driver and lung. The needle creates a radial shear wave pattern within the lung that radiates symmetrically from the needle tip at the chosen mechanical frequency.
Figure 1.

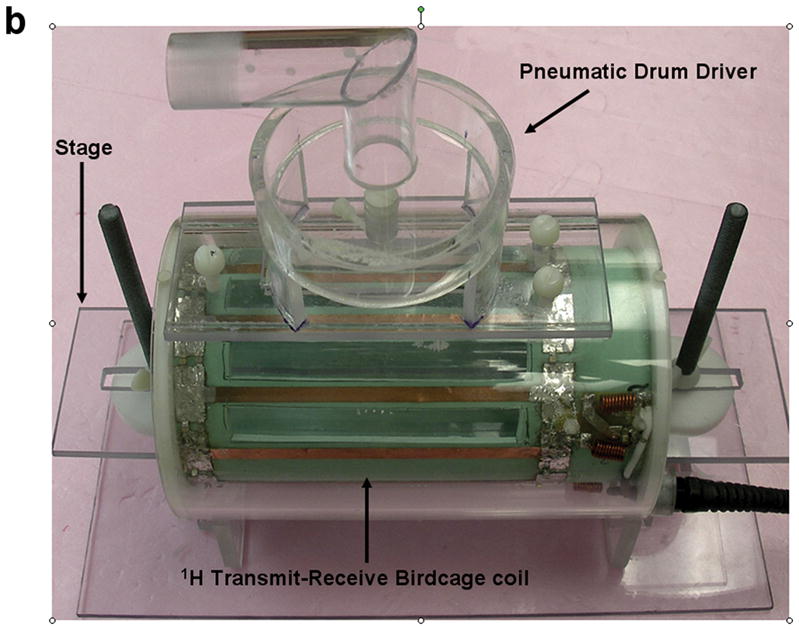
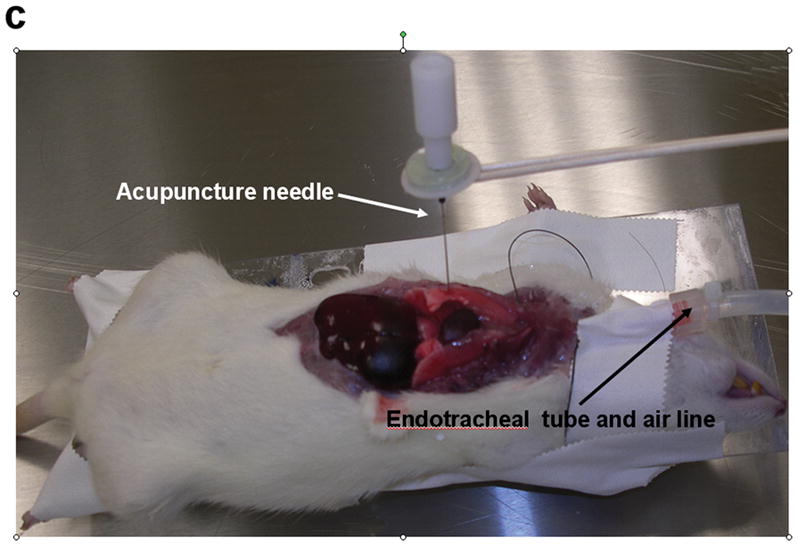
Small animal experimental apparatus. (a) Schematic representation of 10 cm diameter birdcage 1H transmit-receive coil showing pneumatically driven drum driver/acupuncture needle configuration mounted to the top of the coil. The animal is placed in the center of the coil and the needle & driver arrangement is then placed within the lung of interest. (b) Photograph of the coil shown in (a) indentifying the RF coil, specimen stage and pneumatic driver. (c) Photograph of an expired Sprague-Dawley rat after surgical removal of the sternum and anterior ribs with 0.4 mm acupuncture needle inserted into the right lung. The plastic tubing attached to the endotracheal tube is connected to the water column and air pump (not shown) to maintain a constant transpulmonary pressure, Ptp.
A spin echo 1H MRE imaging sequence was used to visualize shear wave propagation within the lung. All imaging was performed in the coronal plane with the following imaging parameters: TE/TR = 22/220 msec, acquisition bandwidth = ±15.6 kHz, field of view = 7 cm, slice thickness = 5 mm, kx/ky = 128/64, number of signal averages (excitations) = 1, amplitude of motion encoding gradients = 40 mT/m, number of motion encoding gradient pairs = 1, motion sensitization direction = physical y-axis of the MR scanner (through plane), and phase offsets = 8. A total of three imaging slices centered on the location of the needle within the right lung were prescribed to cover as best as possible the entire lung volume. The acquisition time for a single phase offset per slice was equal to 28.3 seconds which is a factor 2 longer than a standard spin-echo imaging sequence with the aforementioned parameters. This is because every phase offset involves two acquisitions, each with an alternating polarity of the motion encoding gradient waveforms so as to calculate the phase contrast shear wave displacement image. For eight phase offsets the total imaging time was eight times this value or 3 minutes and 52 seconds. Because of the relatively long TR of 220 msec, slice interleaving was performed enabling all three slices to be acquired within the imaging time of a single slice.
During imaging, the audio speaker was driven with a continuous 200 Hz sinusoidal waveform. This continuous drive mode means that the passive driver is driven throughout the imaging experiment with the motion encoding gradients being synchronized to the phase of a given wave number. The peak-to-peak voltage of the sinusoidal waveform input into the audio speaker ranged between 250–400 milliVolts.
Small Animal Model
Ten adult female Sprague Dawley rats (Harlan Laboratories, Madison, WI) were imaged in accordance with Institutional Animal Care and Use Committee guidelines. The age of these animals was approximately 76 days while their weight ranged from 0.22 to .024 kg. Each animal was euthanized with a lethal injection of pentabarbitol (Ovation Pharmaceuticals, Deerfield, IL) at a dose of 100 mgram/kg of body weight. The chest was then opened and the anterior rib cage was excised to expose the lungs. A small incision was made immediately below the mandible of the animal in order to expose the trachea, which was then severed and cannulated with a 14 gauge intravenous catheter of length 3.175 cm and outer diameter of 2.250 mm (Medex Medical, Dublin, OH). The catheter was sutured in place allowing an external air source to be connected so as to inflate the lungs to known transpulmonary air pressures (Ptp), consistent with previously published ex vivo animal experiments involving rat (17), rabbit (16) and dog (15) lung specimens.
Following expiration and exposure of the chest cavity the endotracheal tube was connected to a water column and air pump (Aquarium Pharmaceuticals Inc, Chalfont, PA) that allowed the lung to be inflated to known values of Ptp measured in centimeters (cm) of H2O. To prevent desiccation during preparation and imaging, the pleural surface of the lungs were irrigated with an isotonic 0.9% sodium chloride solution (Baxter Healthcare Corporation, Deerfield, IL). A 0.4 millimeter diameter silver acupuncture needle was inserted into the lower lobe of the right lung. Care was taken to ensure that the needle did not completely penetrate the lung and become lodged in the posterior wall of the chest cavity. The animal was then placed on the stage of the RF coil and centered within it, directly below the passive driver. The needle was mechanically fastened to the drum driver by means of the adaptor and screw as shown in figure 1(c). Although the susceptibility difference between the needle and tissue (χsilver = −24 ×10−6 versus χtissue~ −11.0 to −7.0 ×10⁻⁶ (18)) had the potential to create susceptibility induced signal loss and distortion within the image, its small diameter as well as the use of a spin echo imaging sequence minimized these effects. Further, previous experiments not reported in this study involving the needle inserted into gel phantoms and imaged with identical imaging parameters did not demonstrate either signal loss or distortion of the gel signal adjacent to the needle.
Of the ten animals, the first two were used to optimize the imaging protocol including standard MR parameters such as slice thickness, field of view as well as the MRE specific parameters described previously. MRE was then performed on the remaining eight animals with each animal being imaged at inflation pressures of 5, 10, and 15 cm H2O. For each experiment, an initial inflation pressure of 10 cm H2O was used while the remaining two inflation pressures (i.e. 5 cm and 15 cm H2O) were randomized between animals. In addition, the lungs of the final five animals (numbers six through 10) were filled with 4 milliliters (ml) of normal saline in order to simulate the effect of fluid within the lung. This volume was chosen to mimic of partial flooding of the lung (i.e. a foam filled interface) and represented between 40% to 60% of the total lung capacity of an adult rat based on weight (Hayatdavoudi et al. reported that the total lung volume of 140 gram and 360 gram rats were 7 ml and 10.8 ml respectively (19)). This volume was infused following completion of the air filled MRE experiments and all imaging parameters were the same between the air and fluid-filled experiments. Before installation of the saline solution the lungs were first disconnected from the air supply and allowed to passively deflate. The 4 ml of saline were then infused manually using 10 ml syringe (Tyco Healthcare, Mansfield, MA). During infusion, the lungs were inspected to check for leaks and observance of increased volume of the lungs was used as a visual cue to ensure that the saline solution perfused into the lung. A three way valve (Medex Inc, Hilliard, OH) in-line with the syringe was used to eliminate leakage of the saline from the lungs.
Data Analysis
Spatially resolved maps of shear modulus were calculated from the phase difference MRE data using an in house analysis program following a protocol similar to that described by Yin et al (20). Briefly, the algorithm is a multistep process that involves unwrapping the phase difference data to remove phase aliasing followed by directional filtering to eliminate reflected shear waves. The first temporal harmonic of the filtered data is then extracted by means of Fourier analysis of the directionally filtered phase offsets. The change in phase as a function of distance (i.e. phase gradient) is then calculated from this data. Because this value is equal to the wave number and shear modulus is inversely proportional to the square of the wave number, it can then be substituted into the aforementioned formula for μ. The process is repeated for each directionally filtered data set and the final estimate of shear modulus is the weighted sum of all estimates.
For all slices within each animal at each inflation pressure and volume of infused saline, shear modulus maps of the right lung were calculated. For each data set (one animal at a single inflation pressure or volume of saline), a single slice was chosen to estimate the average shear modulus of the right lung. This was necessary because of partial volume averaging, as well as needle placement. In general, anterior slices included significant amounts of air, while more posterior slices included the posterior chest wall. Because the needle did not penetrate the entire lung, posterior slices tended to have poor shear wave propagation. The magnitude data was used to define the external contour of the lung. The average shear modulus within the contour was then calculated from the shear modulus map of the lung. To account for the difference in density between solid organs and lung tissue, the average shear stiffness estimates for air-filled lung were multiplied by 0.3, which is within the range of density differences between these two tissue types (~200–300 Kg/m3 (21,22) versus 1000 kg/m3 for solid organs). For the fluid-filled lungs, the physical density was assumed to be equal to that of a solid organ or 1000 kg/m3 and no additional corrections were applied to the shear modulus estimates. Statistical significance between the average estimates of the shear modulus at each inflation pressure was tested by performing a one way analysis of variance (ANOVA) (Origin version 7.0, OriginLab Corporation, Northampton, MA, USA).
RESULTS
For the air filled experiments, MRE was performed on all eight animals. However, data from animals five, six and seven were excluded from the analysis. Animals five and six were excluded because of the inability to successfully unwrap the aliased phase difference data which was a result of too high amplitude shear waves within the lung due to excessive voltage being applied to the audio speaker. Failure to completely unwrap aliasing resulted in an overestimation the shear wavelength and subsequent estimate of shear modulus. For animal seven, only one inflation pressure (10 cm H2O) was obtained. For the fluid filled animal data, all experiments were successfully completed.
Figure 2 shows the magnitude, wave (phase difference) and shear modulus image for the same animal at a Ptp of 5 cm H2O and following infusion of 4 ml of saline. Only four phase offsets (2, 4, 6, & 8) are shown. The phase difference and shear modulus images have been cropped and magnified to more clearly visualize the lung. Despite the relatively low signal within the lung as seen on the magnitude image, there is still sufficient phase coherence to adequately visualize the shear wave as it propagates away from the needle. The mean and standard deviation of the shear modulus averaged over the right lung were 0.906 ± 0.607 kPa and 1.34 ± 0.363 kPa at 5 cm H2O and 4 ml of infused saline, respectively. For the fluid lung, the decrease in wavelength is due in part to the increased physical density of the lung as well as the fact that Ptp was not equal to those values for the air filled data. Because these lungs were not connected to the air pressure system the local Ptp is unknown in so far as airway pressure is not equal to alveolar pressure in flooded regions.
Figure 2.

Magnitude, shear wave displacement and shear modulus maps of the right lung of data set 10 at a transpulmonary pressure of 5 cm H2O and after infusion of 4 ml of saline into the lung. The imaging field of view was 7 centimeters with a slice thickness of 5 mm. Four of the eight phase offsets are shown in the figure. The shear wave emanates from the needle, located between the lower lobe of the right lung and lateral to the heart. Differences in the wavelength are due in part to the differences in density between the air and fluid filled lungs as well as the fact that the effective Ptp of the fluid filled lung was equal to atmospheric pressure or 0 cm H2O.
Figure 3 is a plot of the average shear modulus for the five air filled lungs at the three air inflation pressures as well as the moduli of the fluid filled lungs exposed to atmospheric pressure. The fluid filled data is also included for the purpose of comparison as well as the single shear modulus value of animal seven at 10 cm Ptp. With the exception of data set three, in which the shear modulus was a maximum at the intermediate inflation pressure of 10 cm H2O shear modulus increased with inflation pressure from 5 cm to 10 cm to 15 cm H2O. As a test of statistical significance, an ANOVA was performed by first considering the inflation pressures for each animal data set individually (degrees of freedom = 4). A second ANOVA was performed on the pooled data at the three inflation pressures (degrees of freedom = 2). The shear moduli at each inflation pressure across all five air filled data sets were not statistically significantly different (F value = 0.11301, P = 0.97502). That is to say there was no statistically significant difference between the average shear modulus between individual data sets. However, the population means at the three inflation pressures were found to be statistically significantly different from one another (F value = 26.279, P = 0.00004) indicating that there was a significant increase in shear modulus with increasing inflation pressure. Averaged over the five data sets, the density corrected shear moduli were 0.840 ± 0.0524 kPa, 1.07 ± 0.114 kPa and 1.30 ± 0.118 kPa at 5, 10 and 15 cm H2O Ptp. The signal-to-noise ratio as measured by the ratio of signals within the lung and a 40×40 pixel region of interest in the background of the magnitude image averaged over all animal lungs was 6.82, 6.34, and 5.89 at 5, 10 and 15 cm H2O Ptp respectively.
Figure 3.

Plot of shear modulus averaged over each lung versus inflation pressure as well as fluid filled lungs for each of the five subject data sets. As a function of inflation pressure, an ANOVA analysis demonstrated that the population averaged estimates of shear modulus as a function of inflation pressure are statistically significantly different (F value = 26.279, P = 0.00004).
For the fluid filled lungs, the mean shear modulus for each data set was 2.075, 1.304, 1.537, 1.980 and 1.342 kPa for animals number six through 10 respectively (population average = 1.648 ± 0.360 kPa). Unlike the air filled data, no correction was applied to the value of the physical density of the lung. These data points are also included in Figure 3 and demonstrate that these data both individually as well as a group average are greater than the air filled data. A test for significance was not performed on these data.
DISCUSSIONS
Fundamental questions remain regarding the mechanical properties of the lung in both normal and diseased states. While it is possible to obtain global estimates of lung function from the relationship between pressure and volume throughout the respiratory cycle, none of these measures are capable of quantifying or spatially resolving the intrinsic mechanical properties of lung parencmhya. In this work, the feasibility of spatially resolving the shear modulus of lung parenchyma using 1H MRE imaging techniques has been evaluated, The results indicate that this approach is capable of resolving differences in shear modulus associated with change in inflation pressure and that this technique can also be applied to quantify and spatially resolve the shear modulus of lungs infused with fluid, simulating partial flooding or a foam filled lung.
The rat model used in this experiment is appealing for several reasons including the relatively low costs for purchase and housing of the animals, the fact that this animal has been used extensively to study a wide range of lung disease models and is the model of choice for parenchmal diseases such as ALI and ILD in which fibrosis is an outcome (23–25). Ultimately, as this technique is migrated towards human studies, larger animal models such as sheep and pigs will need to be adapted for MRE. Systems such as those proposed by Biederer et al. (26) could be adapted to perform MRE studies in situ towards the ultimate goal of completely non invasive assessment of shear modulus of the lung within an intact chest.
The MRE technique presented in this work uses conventional 1H imaging techniques by employing a spin-echo based MRE imaging sequence to visualize propagating shear waves within the lung. Figure 2 demonstrates that although the magnitude of the signal within the lung is low, there remains enough phase coherence within the signal to encode displacements resulting from the shear wave. This approach has significant advantages compared to the use of magnetized gases such as 3He including cost, gas availability and overall complexity of the experiment (27). The invasive nature of the current experimental method as well as the need to first euthanize the animal is obviously prohibitive for performing longitudinal studies in lung disease models, however, the results indicate proof of concept of this model. Further work is thus needed to perform the procedure using less invasive approaches as well as reducing the overall imaging time so that serial MRE data could be collected in anesthetized animals.
For future animal studies it is most likely that some type of mechanical ventilation system such as that described by Schuessler and Bates (28) will need to be used in combination with rapid MR imaging techniques such as stimulated or gradient echo pulse sequences and parallel imaging to both monitor and suspend respiration as well as reduce overall imaging time from several minutes to seconds. However, an ultimate challenge for in vivo imaging in live animals is the ability to non-invasively generate shear waves throughout the lung. Direct mechanical contact between a passive driver and the chest wall has been demonstrated to generate shear waves within humans (29). However, the fragile nature and size of the thorax of small animals such as rats suggests that this may not be the most optimal approach. The most likely method of in vivo shear wave generation will be by means of a flexible tip endotracheal catheter that can be first maneuvered through the main airways of the lung and then agitated at its tip in order to generate propagating shear waves within the lung parenchyma.
Figure 4 is a plot of the MRE derived shear modulus estimates reported in this work as well as those values obtained by means of punch indentation testing on dog(15), rabbit(16) and rat(17) lungs. For all data, including the MRE estimates from this study, the shear modulus increases with inflation pressure. In comparison to previously published values for the shear modulus of lung parenchyma, the average shear modulus as a function of inflation pressure for these data is higher than those values recorded for dogs and rabbits and falls between those values reported for rat lungs. While similar, there are several potential reasons why the MRE data vary from previously reported estimates. The first relates to the method by which shear modulus was calculated. In previous studies, punch indentation testing was performed which provided local estimates of shear modulus at the pleural surface of the lung. In the current study, the shear modulus represents the average estimate throughout the lung through which the imaging slice intersected. Another significant contribution is the fact that an average estimate rather than actual value of the physical density of the lung was used in the MRE inversion. It was observed that despite the narrow diameter of the needle, lung tissue around the needle was compressed relative to regions beyond it. Thus, there exist differences in parenchymal physical density that were not included in the average estimate of physical density of 300 kg/m3.
Figure 4.

MRE versus punch indentation testing derived estimate of shear modulus for rat (17), rabbit (16), and dog (15) Plot lungs as a function of inflation pressure. All values are quoted as a function of transpulmonary pressure and are in units of kilopascals. Despite the dramatically different methods for assessing shear modulus (MRE versus punch indentation) the data exhibit the same positive trend with inflation pressure and are within approximately the same absolute range of shear modulus.
Traditional methods of assessing respiratory system mechanics such as impedance, tissue damping, elastance and bulk modulus have relied upon measurement of the relationship between inflation pressure and lung volume throughout the respiratory cycle. With the advent of computer controlled small animal ventilators (28), a large volume of data has been collected for a variety of animal models, in particular the rat (30) and have provided important insights into the physiology of normal lung function, particularly in these small animal models. However, caution should be exhibited when attempting to compare these data to those obtained using the methods proposed in this work. This is because both methods attempt to assess fundamentally different properties of the lung. While ventilation-based measures can be separated into their lung and chest wall components (31), their values represent global estimates of tissue mechanical properties derived from models of the pressure-volume curve as a function of ventilator oscillation frequency. It is also known that alveolar surface tension is an important determinate of the shape of the pressure-volume relationship of the lung and as such, any properties derived from this relationship will include the effect of surface tension as well as its change with lung volume. In contrast, MRE is a method of assessing the ability of tissue to undergo shear deformation at a constant surface tension as quantified by the shear modulus. For the lung, MRE based techniques calculate the shear moduli of the prestressed parenchyma itself. Further, unlike respiratory mechanic based measures, MRE is capable of quantifying and spatially resolving shear modulus, providing further insight into the underlying properties of the lung. The most accurate comparison between MRE-derived and other measures of lung tissue mechanical properties is to compare estimates of shear modulus obtained from MRE and other techniques. In the context of this study, the closest comparison is to compare MRE and punch indentation testing estimates of shear modulus which is shown in Figure 4 and described above.
On review of the shear modulus of the fluid versus air-filled data the average fluid-filled data are stiffer (average shear modulus of 1.648 kPa versus 1.298 kPa for the density corrected average shear modulus at 15 cm H2O Ptp). For a completely fluid filled lung the Wilson Bachofen model (32) predicts the opposite to be true. This is because within the normal lung surface tension balances the hoop stress of alveolar entrance rings. That is, surface tension pre stresses and distorts the microstructure thereby increasing local shear moduli. Eliminating surface tension entirely by replacing gas with fluid (i.e. no foam, no air liquid interfaces) abolishes tissue distortion, unloads the helical collagen support of alveolar ducts which make up the alveolar entrance rings (decreases hoop stress) and therefore would be expected to reduce the parenchymal shear modulus. This effect may be inferred from a comparison of pressure-volume relationships between air and fluid filled lungs as well as the corresponding surface tension/alveolar surface area relationships. Creation of a completely fluid filled lung requires first degassing of the entire lung volume followed by infusion of a volume of saline or other liquid equal to the total lung capacity of the specimen. Instead, the lungs used in this study were only partially flooded by letting the lungs reach equilibrium with atmospheric pressure (Ptp = 0) followed by infusion of a volume of saline less than the total lung capacity. Partially flooding the lung is this manner results in local gas trapping thereby generating a parenchymal network structure internally supported by foam. Under these conditions, the stiffness of the parenchyma is a result of the mechanical properties of the foam, which is why the shear modulus of the saline filled was greater than the air-filled lungs. When comparing MRE derived shear modulus estimates it is important to appreciate that for both the air and fluid-filled lungs, the densities of 300 and 1000 kg/m3 represent approximations instead of actual physical densities. The installation of a volume of saline less than the total lung capacity (i.e. 4 ml) suggests that the fluid-filled lung would have a density less than 1000 kg/m3. However, without direct measurement of density, it was assumed that the density of the fluid-filled lung would be closer to that of a solid organ rather than air-filled lung. As a result, the reported differences between air and fluid-filled lungs are currently qualitative rather than quantitative in nature. Future work will involve quantitative spatial resolution of physical density for MRE derived estimates of shear modulus.
In conclusion, the data demonstrates that it is possible to spatially resolve the shear modulus of normal lung parenchyma in a small animal model using conventional 1H MRE imaging techniques and these values are consistent with previously published values for a variety of animal models derived from direct mechanical testing. The observed differences between air and fluid-filled lungs as well as the ability to correlate shear modulus with inflation pressure suggests that this model could be used to study change in the intrinsic mechanical properties of the lung. Future investigations will involve determining if MRE derived measures of shear modulus can distinguish not only the initial stages of lung injury but also those disease processes in which end stage fibrosis is the ultimate outcome.
Acknowledgments
Grant Support: EB001981
The authors would like to thank Debora Rasmussen of the Thoracic Diseases Research Unit, Mayo Clinic for her help with the preparation and handling of animal data necessary for this experiment as well as the Radiology Research Committee, Mayo Clinic for its financial support of this project.
References
- 1.Suki B, Ito S, Stamenovic D, Lutchen KR, Ingenito EP. Biomechanics of the lung parenchyma: critical roles of collagen and mechanical forces. J Appl Physiol. 2005;98:1892–1899. doi: 10.1152/japplphysiol.01087.2004. [DOI] [PubMed] [Google Scholar]
- 2.Bates JH, Suki B. Assessment of peripheral lung mechanics. Respir Physiol Neurobiol. 2008;163:54–63. doi: 10.1016/j.resp.2008.03.012. [DOI] [PMC free article] [PubMed] [Google Scholar]
- 3.Suki B, Bates JH. Extracellular matrix mechanics in lung parenchymal diseases. Respir Physiol Neurobiol. 2008;163:33–43. doi: 10.1016/j.resp.2008.03.015. [DOI] [PMC free article] [PubMed] [Google Scholar]
- 4.Bates JH, Davis GS, Majumdar A, Butnor KJ, Suki B. Linking parenchymal disease progression to changes in lung mechanical function by percolation. Am J Respir Crit Care Med. 2007;176:617–623. doi: 10.1164/rccm.200611-1739OC. [DOI] [PMC free article] [PubMed] [Google Scholar]
- 5.Muthupillai R, Lomas DJ, Rossman PJ, Greenleaf JF, Manduca A, Ehman RL. Magnetic resonance elastography by direct visualization of propagating acoustic strain waves. Science. 1995;269:1854–1857. doi: 10.1126/science.7569924. [DOI] [PubMed] [Google Scholar]
- 6.Sinkus R, Tanter M, Xydeas T, Catheline S, Bercoff J, Fink M. Viscoelastic shear properties of in vivo breast lesions measured by MR elastography. Magn Reson Imaging. 2005;23:159–165. doi: 10.1016/j.mri.2004.11.060. [DOI] [PubMed] [Google Scholar]
- 7.McKnight AL, Kugel JL, Rossman PJ, Manduca A, Hartmann LC, Ehman RL. MR elastography of breast cancer: preliminary results. AJR Am J Roentgenol. 2002;178:1411–1417. doi: 10.2214/ajr.178.6.1781411. [DOI] [PubMed] [Google Scholar]
- 8.McCracken PJ, Manduca A, Felmlee J, Ehman RL. Mechanical transient-based magnetic resonance elastography. Magn Reson Med. 2005;53:628–639. doi: 10.1002/mrm.20388. [DOI] [PubMed] [Google Scholar]
- 9.Shah NS, Kruse SA, Lager DJ, et al. Evaluation of renal parenchymal disease in a rat model with magnetic resonance elastography. Magn Reson Med. 2004;52:56–64. doi: 10.1002/mrm.20101. [DOI] [PubMed] [Google Scholar]
- 10.Dresner AM, Cheville JC, Myers RP, Ehman RL. MR elastography of prostate cancer. Proceedings of the 11th Annual Meeting of the ISMRM; Toronto. 2003. (Abstract 578) [Google Scholar]
- 11.Kemper J, Sinkus R, Lorenzen J, Nolte-Ernsting C, Stork A, Adam G. MR elastography of the prostate: initial in-vivo application. Rofo. 2004;176:1094–1099. doi: 10.1055/s-2004-813279. [DOI] [PubMed] [Google Scholar]
- 12.Basford JR, Jenkyn TR, An KN, Ehman RL, Heers G, Kaufman KR. Evaluation of healthy and diseased muscle with magnetic resonance elastography. Arch Phys Med Rehabil. 2002;83:1530–1536. doi: 10.1053/apmr.2002.35472. [DOI] [PubMed] [Google Scholar]
- 13.Dresner MA, Rose GH, Rossman PJ, Muthupillai R, Manduca A, Ehman RL. Magnetic resonance elastography of skeletal muscle. J Magn Reson Imaging. 2001;13:269–276. doi: 10.1002/1522-2586(200102)13:2<269::aid-jmri1039>3.0.co;2-1. [DOI] [PubMed] [Google Scholar]
- 14.Jenkyn TR, Ehman RL, An KN. Noninvasive muscle tension measurement using the novel technique of magnetic resonance elastography (MRE) J Biomech. 2003;36:1917–1921. doi: 10.1016/s0021-9290(03)00005-8. [DOI] [PubMed] [Google Scholar]
- 15.Hajji MA, Wilson TA, Lai-Fook SJ. Improved measurements of shear modulus and pleural membrane tension of the lung. J Appl Physiol. 1979;47:175–181. doi: 10.1152/jappl.1979.47.1.175. [DOI] [PubMed] [Google Scholar]
- 16.Stamenovic D, Yager D. Elastic properties of air- and liquid-filled lung parenchyma. J Appl Physiol. 1988;65:2565–2570. doi: 10.1152/jappl.1988.65.6.2565. [DOI] [PubMed] [Google Scholar]
- 17.Salerno FG, Ludwig MS. Elastic moduli of excised constricted rat lungs. J Appl Physiol. 1999;86:66–70. doi: 10.1152/jappl.1999.86.1.66. [DOI] [PubMed] [Google Scholar]
- 18.Schenck JF. The role of magnetic susceptibility in magnetic resonance imaging: MRI magnetic compatibility of the first and second kinds. Med Phys. 1996;23:815–850. doi: 10.1118/1.597854. [DOI] [PubMed] [Google Scholar]
- 19.Hayatdavoudi G, Crapo JD, Miller FJ, O’Neil JJ. Factors determining degree of inflation in intratracheally fixed rat lungs. J Appl Physiol. 1980;48:389–393. doi: 10.1152/jappl.1980.48.2.389. [DOI] [PubMed] [Google Scholar]
- 20.Yin M, Woollard J, Wang X, et al. Quantitative assessment of hepatic fibrosis in an animal model with magnetic resonance elastography. Magn Reson Med. 2007;58:346–353. doi: 10.1002/mrm.21286. [DOI] [PubMed] [Google Scholar]
- 21.Hachenberg T, Lundquist H, Tokics L, Brismar B, Hedenstierna G. Analysis of lung density by computed tomography before and during general anaesthesia. Acta Anaesthesiol Scand. 1993;37:549–555. doi: 10.1111/j.1399-6576.1993.tb03763.x. [DOI] [PubMed] [Google Scholar]
- 22.Moller HE, Chen XJ, Saam B, et al. MRI of the lungs using hyperpolarized noble gases. Magnetic Resonance in Medicine. 2002;47:1029–1051. doi: 10.1002/mrm.10173. [DOI] [PubMed] [Google Scholar]
- 23.Moeller A, Ask K, Warburton D, Gauldie J, Kolb M. The bleomycin animal model: a useful tool to investigate treatment options for idiopathic pulmonary fibrosis? Int J Biochem Cell Biol. 2008;40:362–382. doi: 10.1016/j.biocel.2007.08.011. [DOI] [PMC free article] [PubMed] [Google Scholar]
- 24.Ebihara T, Venkatesan N, Tanaka R, Ludwig MS. Changes in extracellular matrix and tissue viscoelasticity in bleomycin-induced lung fibrosis. Temporal aspects. Am J Respir Crit Care Med. 2000;162:1569–1576. doi: 10.1164/ajrccm.162.4.9912011. [DOI] [PubMed] [Google Scholar]
- 25.Chaudhary NI, Schnapp A, Park JE. Pharmacologic differentiation of inflammation and fibrosis in the rat bleomycin model. Am J Respir Crit Care Med. 2006;173:769–776. doi: 10.1164/rccm.200505-717OC. [DOI] [PubMed] [Google Scholar]
- 26.Biederer J, Liess C, Charalambous N, Heller M. Volumetric interpolated contrast-enhanced MRA for the diagnosis of pulmonary embolism in an ex vivo system. J Magn Reson Imaging. 2004;19:428–437. doi: 10.1002/jmri.20021. [DOI] [PubMed] [Google Scholar]
- 27.McGee KP, Hubmayr RD, Ehman RL. MR elastography of the lung with hyperpolarized 3He. Magn Reson Med. 2008;59:14–18. doi: 10.1002/mrm.21465. [DOI] [PubMed] [Google Scholar]
- 28.Schuessler TF, Bates JH. A computer-controlled research ventilator for small animals: design and evaluation. IEEE Trans Biomed Eng. 1995;42:860–866. doi: 10.1109/10.412653. [DOI] [PubMed] [Google Scholar]
- 29.Goss BC, McGee KP, Ehman EC, Manduca A, Ehman RL. Magnetic resonance elastography of the lung: technical feasibility. Magn Reson Med. 2006;56:1060–1066. doi: 10.1002/mrm.21053. [DOI] [PubMed] [Google Scholar]
- 30.Gomes RF, Shen X, Ramchandani R, Tepper RS, Bates JH. Comparative respiratory system mechanics in rodents. J Appl Physiol. 2000;89:908–916. doi: 10.1152/jappl.2000.89.3.908. [DOI] [PubMed] [Google Scholar]
- 31.Hirai T, McKeown KA, Gomes RF, Bates JH. Effects of lung volume on lung and chest wall mechanics in rats. J Appl Physiol. 1999;86:16–21. doi: 10.1152/jappl.1999.86.1.16. [DOI] [PubMed] [Google Scholar]
- 32.Wilson TA, Bachofen H. A model for mechanical structure of the alveolar duct. J Appl Physiol. 1982;52:1064–1070. doi: 10.1152/jappl.1982.52.4.1064. [DOI] [PubMed] [Google Scholar]