Abstract
Teams are an integral component of quality improvement efforts in healthcare organizations. Quality improvement teams may involve persons either from the same or different disciplines. In either case, the selection of team members may be critical to the team’s success. However, there is little research to guide selection of team members for quality improvement teams. In this paper, we use tools from social network analysis (SNA) to derive principles for the design of effective clinical quality improvement teams and explore the implementation of these principles using social network data collected from the inpatient general medicine services at a large academic medical center in Chicago, USA. While the concept of multidisciplinary teams focuses on the importance of the professional background of team members, SNA emphasizes the importance of the individual and collective connections of team members, both to persons outside the team and to each other. SNA also focuses on the location of individuals and groups between other actors in the flow of information and other resources within larger organizational networks. We hypothesize that external connections may be most important when the collection or dissemination of information or influence are the greatest concerns, while the relationship of team members to each other may matter most when internal coordination, knowledge sharing, and within-group communication are most important.
Keywords: quality improvement, social network analysis, teams, general internal medicine, USA, hospitals
INTRODUCTION AND BACKGROUND
Team-based approaches to patient care and quality improvement have been broadly promoted to address gaps in healthcare quality and safety in the U.S. (Bodenheimer, 1999). Defined as a group of individuals working interdependently to achieve a shared goal, teams have been advocated by the Institute of Medicine (IOM) as an imperative in the redesign of healthcare delivery systems (IOM, 2001), and a cornerstone of safer healthcare organizations (IOM, 2000; 2007). Teams have been identified by the National Quality Forum™ (NQF) as critical components of a “culture” of healthcare quality and safety (NQF, 2007), and The Joint Commission has identified improved team communication as a National Patient Safety Goal (Joint Commission, 2008). Teams are also a core concept in many popular models of healthcare delivery and quality improvement (QI), including: “shared,” (Smith, Allwright, & O’Dowd 2008) “collaborative,” “multidisciplinary,” (Mitchell, Brown, Erikssen, & Tieman, 2008) “interprofessional,” (Vyt, 2008; Lingard, Espin, Evans, & Hawryluck 2004) and “interdisciplinary” models of care; the Chronic Care Model (Wagner, 2000); total quality management (Øvretveit, 2000; Lammers, Cretin, Gilman, Calingo, 1996); continuous quality improvement and other systems-based quality improvement methods (Mohr & Batalden, 2002).
Despite the conceptual popularity of teams in healthcare quality improvement, little systematic theory and research has focused on the design and construction of such teams. How should team members be selected in order to increase the effectiveness of the group in modeling and/or disseminating behavior change within a larger social environment such as an organization?
To address this question, we draw upon the large body of research on social networks which has demonstrated how a person’s location within a social network can affect the volume, quality, and timeliness of information to which he/she has access, and how connections within a group can affect group cohesion, coordination, trust, knowledge sharing, and problem solving/innovation. Our approach is grounded in the view that social relationships are a valuable resource that can be used to improve the flow of information and influence to achieve desired outcomes. In other words, relationships are “social capital” (Coleman, 1988) that can be productively used in health care settings to improve quality. We argue that teams should be constructed not only to optimize the quantity and types of human capital available to the team, but also the amount of social capital available. Building on the analysis of Burt (2005) and other contributors to the management literature on teams (Cross, Erlich, Dawson, & Helferich, 2008), this requires choosing individuals based on their connections to persons both within and outside the team.
While previous studies in the clinical literature have used social network principles to identify effective single opinion leaders (Soumerai et al., 1998; Kravitz et al., 2003), we are not aware of prior studies that have used SNA to improve the design of quality improvement teams in health care, which is our ultimate goal. Our objectives in this paper are twofold. First, we apply theoretical concepts and basic methods of social network analysis (SNA) to develop a systematic approach to quantitatively describing the social environment within healthcare organizations, and to develop general principles based on SNA metrics for constructing quality improvement teams that will effectively disseminate interventions and effect behavior change. Second, we use data on the social network of attending physicians on the general medicine inpatient services at one institution to demonstrate how these principles can be applied to the design of teams.
BUILDING BETTER TEAMS USING SOCIAL NETWORK ANALYSIS
Much of the current clinical literature on teams has been informed by insights gained from quality improvement process evaluations (e.g. Grumbach & Bodenheimer, 2004), or from professional perspectives and expert opinion (Jungers, Pestinger, Elsner, Krumm, & Radbruch, 2007; Harolds, 2005; Mickan and Rodger, 2005; Weinreb, 2004). This literature suggests that teams should be comprised of healthcare professionals with different professional (Harolds, 2005) and diverse sociodemographic backgrounds (Harolds, 2005; Xyrichis & Lowton, 2008). Close communication is an important attribute (Jungers, Pestinger, Elsner, Krumm, & Radbruch, 2007; Grumbach & Bodenheimer, 2004; Mickan & Rodger, 2005; Xyrichis & Lowton, 2008). Effective healthcare teams are also often characterized by having clearly articulated, shared goals and objectives (Grumbach & Bodenheimer, 2004; Mickan & Rodger, 2005; Saltman et al., 2007; Weinreb, 2004; Xyrichis & Lowton, 2008); strong team leadership (Mickan & Rodger, 2005; Weinreb, 2004), and a sense of trust and commitment among team members (Junger et al., 2007; Mickan & Rodger, 2005). The size of team is also often cited as important, with teams including between 5 and 15 members considered to be best in many cases (Harolds, 2005; Weinreb 2004; Grumbach & Bodenheimer, 2004).
Although the importance of social networks has been acknowledged in the field of implementation science, they have largely been viewed as an environmental or contextual feature that may mediate the effects of a quality improvement intervention, or that may prove to be a barrier or facilitator in diffusion (Rubenstein et al. 2000). A recent paper by Braithwaite, Runciman and Merry (2009) argues that healthcare quality improvement efforts can be made more effective by exploiting social capital inhering in the informal social ties that “naturally” form and evolve over time within organizations. Social capital refers to the resources that are “embedded” within social relations between individuals (Podolny and Baron 1997; Lin, Cook and Burt 2001), as well as the overall structure of those relations (Coleman 1988; Burt 1992; Burt 1995). While the productivity of social capital has long been recognized in sociology (Coleman 1988; Portes 1998), political science (Putnam 1994), and economics (Becker 1998), it is a relatively recent import within the literature on clinical organization and processes. Little has been done to apply concepts, theoretical principles, and/or methodological tools from SNA to develop a systematic implementation approach for team-based quality improvement interventions. Yet, SNA may inform a number of challenges inherent in team design, e.g. who to select for the team (team composition), and how to structure the team (team organization). In this paper, we focus on team composition.
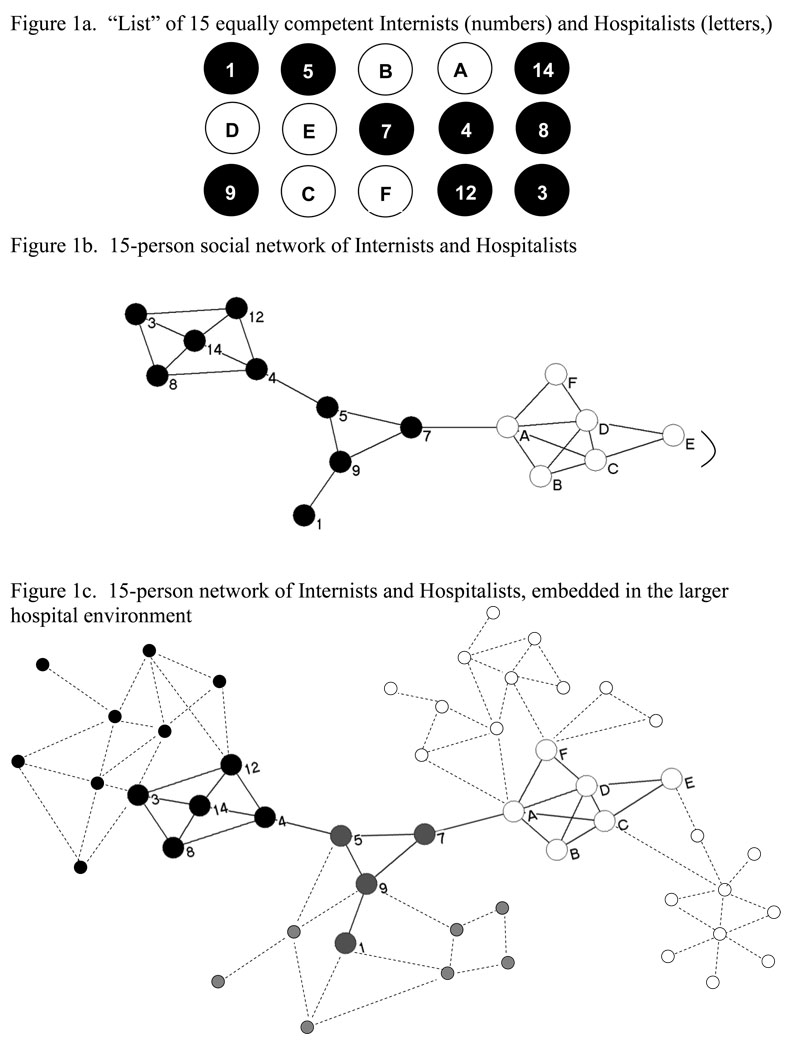
A detailed review of social network theory is beyond the scope of this paper, but the essential concepts needed to convey the value of SNA for guiding team composition can be illustrated in Figure 1.
FIGURE 1.
SNA Implications of Diversifying Team Composition
A simple definition of a social network is that it is a set of social actors and the ties among them. Figure 1a lists a set of hypothetical social actors in our example network. To align with the empirical analysis below, one can imagine that the 15 actors listed are inpatient attending physicians and that they belong to two different groups — general internists (labeled by numbers), and hospitalists (labeled by letters). Figure 1b presents what is known as a sociogram – a visual diagram of a social network in which actors are represented as nodes or vertices between lines which depict connections or “ties” between actors. In Figure 1b, attending physicians are represented by circles, and the relationships between them by lines. Depending on how relations between actors are measured, ties may reflect patterns of: observed interaction or communication; advice; help seeking or provision; resource exchange; information flows, or some other form of social exchange. To be consistent with the data we show later, let us assume that the ties in this hypothetical sociogram reflect patterns of interaction among attending physicians. Information contained in a sociogram can yield a number of simple, yet powerful, measures that can inform decisions about team composition. These measures typically pertain to the relationship of team members either to persons outside the team, or to each other. Based on Burt’s (2005) work as well as work by others (Reagans and Zuckerman 2001; Oh, Chung and Labianca 2004; Ramanadhan et al. 2009) on the comparative advantages of intra-team ties for fostering group cohesion and extra-team ties for information seeking and strategy, we hypothesize that external ties may be more important when the primary function of QI teams is to collect or disseminate information or to act as direct agents of social influence. We also hypothesize that ties among teammates may matter more in circumstances that place a premium on internal coordination, knowledge sharing, and communication.
Using SNA Measures of External Team Connections to Select Team Members
Clinical and management literatures both suggest the value of teams comprised of members who bring varied skills and resources to a group. However, organizational and management literature on teams and social networks provide additional insight into the conditions under which team diversity is beneficial. Diversity in demographic background and organizational experience increases cognitive and perceptual heterogeneity within the group, and this can reduce inertia and catalyze the group in effecting change within the broader organization (Wiersema and Bantel, 1992). Functional diversity -- that is, diversity in the skills and professional background --particularly enhances team performance on tasks requiring innovation and creativity (Simons, Pelled and Smith, 1999; Bantel and Jackson 1989). On the other hand, team diversity can increase coordination costs within the group, because demographic and organizational homogeneity tends to promote cooperation and teamwork (Ancona and Caldwell, 1992). Team homogeneity and heterogeneity can affect cohesion and innovative capacity directly through the uniformity of perspectives, attitudes, and assortment of skills that team members bring to the table. Homogeneity and heterogeneity can also affect cohesion and innovative capacity indirectly through social network pathways (Reagans, Zuckerman and McEvily, 2004; Reagans and Zuckerman, 2001) insofar as broader patterns of interaction between team members and non-team members within an organization present competing interests or demands on a team member, and/or to the extent that heterogeneity represents bridges to diverse pockets of resources within an organization that would not otherwise be available to the team.
Whether one’s intention is to create teams with inherent proclivities towards teamwork or towards innovation, the arguments above suggest that team design requires ability to not only classify prospective members on the basis of relevant demographic and/or professional attributes, but to also summarize the potential network resources that prospective members may bring to the team. SNA offers tools for both tasks of team design. Sociograms and network clusters can highlight pockets of homogeneous individuals within organizations, and within those pockets, network metrics can further differentiate potential team members on the basis of their portfolio of social connections to others in the organization. These simple metrics include an individual’s total number of connections (“degree”), the total number of a group’s non-redundant connections (“net degree”), the extent to which individuals are positioned strategically between information and resource flows, (“betweenness.”), and the extent to which potential social network connections among a group are maximized (“density”).
Clusters
Sociograms attempt to place people connected to each other in close proximity, and people connected to those people are, in turn, located nearby. An important insight of SNA is that people tend to associate with others with whom they share sociodemographic, professional, or other characteristics. As a result of this “homophily” (Lazarsfeld & Merton, 1954), individuals sharing similar characteristics are more likely to cluster together in a sociogram. Conversely, different clusters represent potentially non-overlapping sources of information and knowledge. Ties between different clusters are a form of social capital that confers access to new information (Burt, 1992). By revealing underlying clusters within a population, sociograms provide a visual method to identify characteristics that are associated with social linkages and individuals with membership in distinct social subgroups. Examining empirical clusters based on patterns of interpersonal ties or interactions is particularly useful if sociodemographic variables such as gender, disciplinary background, or broad professional designations are not granular enough to identify meaningful social groupings.
Example
In Figure 1a, imagine a hypothetical situation in which an administrator must assemble a 4-person team from the pool of 15 individuals comprised of general internists (1–14) and hospitalists (A-F). Assuming all these physicians have identical professional expertise any team of two would be expected to be equally effective if expertise was the sole selection criterion. However, the sociogram in Figure 1b reveals several social dissimilarities among the actors. General internists fall into two clusters, and possess different patterns of connections within and between those clusters. The internists on the left of Figure 1b might be a set of group of primary care doctors -- very well connected to each other, but not well connected to the hospitalists, and only loosely connected to the cluster of internists in the middle. In contrast, the cluster of internists in the middle -- perhaps a set of hospital-based primary care physicians -- is tied to hospitalists. The presence of clustering suggests selecting physicians from different clusters for a QI effort may be useful if proximity increases the likelihood of influence or information exchange.
Going further, though each subgroup of physicians may appear to form a fairly homogeneous cluster, closer inspection reveals variation in the number of direct connections to other physicians. D is connected to all other hospitalists, whereas F and E are connected to only two others. A is directly connected to all but one hospitalist (E), and is the only hospitalist directly connected to a non-hospitalist (7). Figure 1c shows how these 15 candidates are embedded in the larger organizational environment and illustrates more structural differences. Each cluster connects to different subgroups in the organization, and four physicians serve as bridges to two additional subgroups. Because direct connections into these subgroups may be useful, assembling a team that can bridge to each subgroup, such as {A, 7, 5, 14}, might be preferable to a team that does not, such as {3, 12,14, 8),
Degree
An actor’s degree is the number of other actors with whom he/she is directly connected, and is a simple quantitative measure of an actor’s social “activity.” 1,2 High degree is important when direct connections are important. In a QI intervention relying on an opinion leader to influence his/her peers by direct personal reminders, degree may be the most important measure of potential social influence.
Example
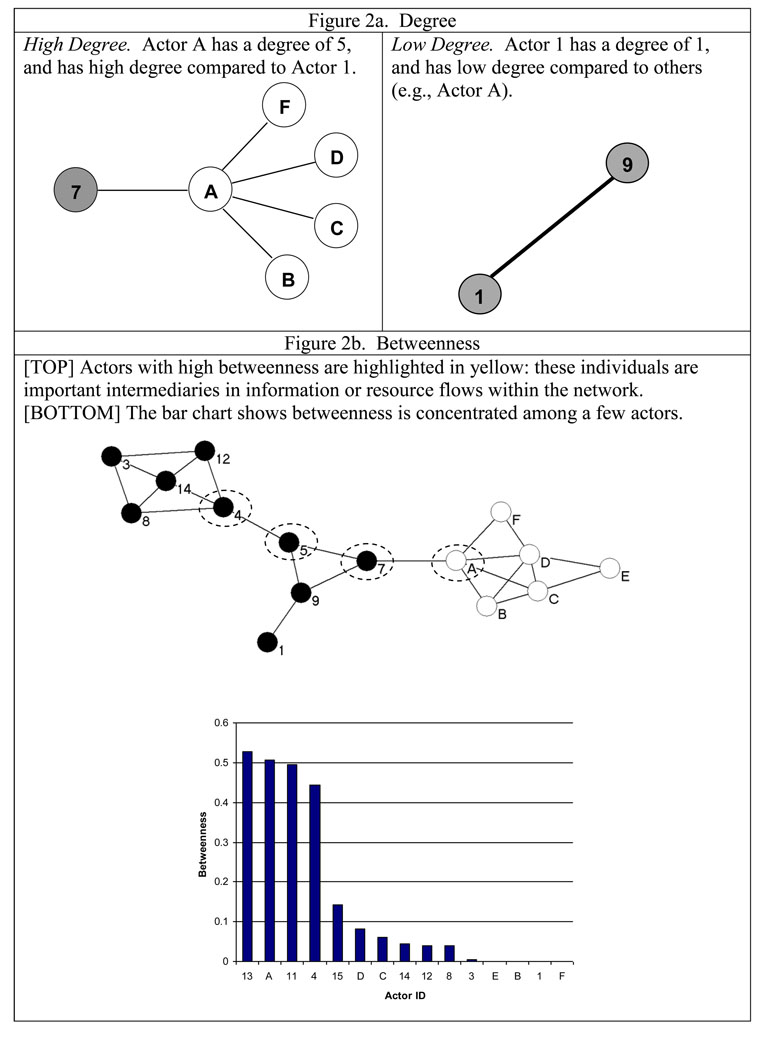
Figure 2a illustrates the concept of degree for the hypothetical network above. With a relatively high degree of 5, physician A would seem better situated to exert direct influence as an opinion leader than physician 1, with a degree of only 1.
FIGURE 2.
SNA Concepts of Degree, Betweenness, and Bridges
Net Degree
When influence through direct social interaction is important, a major objective of team design is to choose a set of individuals who can collectively reach the largest number of persons outside the proposed team through direct connections. Net degree is the total number of unique individuals that a team can reach directly through one or more team members. It is the sum of each member’s degree, minus the number of redundant contacts. Net degree can be interpreted similarly to the way that nodal degree is interpreted. Larger net degree simply means that a group shares a larger total set of non-redundant contacts than a group with a smaller net degree. Maximizing net degree often implies selecting members from different social subgroups within an organization who are not directly connected. Larger values for net degree imply greater access to non-redundant information and other resources. By the same token, availability and maintenance of ties to non-group members may reduce the cohesion and strength of in-group ties (Burt 2005). Thus, the utility of net degree and its role as a design principle must be conditioned on the nature of the team’s task.
Example
If a two-person team were chosen from the hypothetical network in Figure 1b, choosing two physicians from the same cluster would result in lower net degree than choosing the two physicians from distant clusters. For example, A is connected to 5 others {7, F, D, C, and B}. Physician 5 is connected to 3 persons {4, 9, and 7}. The net degree for the {A, 5} team would be 5+3−1=7, since the two have one redundant tie {7}. A team of A and 8 would offer a net degree of 5+4−0=9, due to a collective set of connections to {3, 14, 12, 4, and F, D, C, B, and 7} that do not overlap. Thus, while the social connections of individuals may cluster by nominal sub-groupings (e.g. hospitalists or non-hospitalists), and choosing team members based on their associations with such groups may be a useful heuristic for developing teams, the approach may be improved upon using information from the structural positions of individuals within a network.
A team chosen to maximize net degree will generally not maximize the total number of ties outside the group since net degree counts only non-redundant ties. Redundant ties may be useful if peer influence, social pressure, or reinforcement is important in a QI process. For a concrete example, imagine if opinion leaders are most influential when a clinician caring for a patient sees a team member in the hallway and asks advice of the team member if they happen to be present. The importance of these mechanisms is emphasized in social learning theory (Bandura, 1977), which suggests that agents are most likely to retain information obtained from others when they have obtained it for an immediate purpose and is supported by social network analysis of physicians dating back to the classic work of Coleman showing that physicians are more likely to adopt new practices when they share an office with one or more colleagues who follow that practice (Coleman, Katz, & Menzel, 1966). Redundant ties may also be useful when multiple reminders are desirable because clinicians may forget to regularly implement the targeted practice. Thus, both total degree and net degree may be useful concepts, and decisions about how much weight to put on each concept in team design will generally depend on the perceived importance of redundancy versus reach in any given context.
Betweenness
When teammates need to produce changes in behavior or obtain information from distant parts of an organization, an actor’s ability to mobilize and coordinate social activity beyond their immediate contacts becomes important. Here, a team member’s betweenness may be the most important measure of their social influence. This measure is defined using the network concept of a geodesic, which is the shortest path between two actors. An actor’s betweenness is the proportion of geodesics between all other individuals in a network that involve that actor (Wasserman & Faust, 1994). Actors with high betweenness tend to be strategic intermediaries in the flow of information from one group to another (Hossain, Wu, & Chung, 2006). Betweenness has been shown to be associated with an individual’s ability to coordinate projects within teams (Hossain et al., 2006); other studies have found individuals with high betweenness to be leaders and active participants in task-oriented groups (Mullen, Johnson, & Salas, 1991). Insofar as leadership and coordination have been named among chief characteristics of effective teams in the clinical literature (Xyrichis & Lowton, 2008; Mickan & Rodger, 2005; Weinreb, 2004), betweenness may be a useful network metric for prospectively identifying team members that may facilitate the emergence of leadership and coordination.
Example
The top panel of Figure 2b highlights the actors with the highest betweenness scores, and the bottom panel presents a bar chart of actor betweenness. Although degree and betweenness both pertain to the idea of an individual’s “centrality” within a network and help identify key actors, they are distinct. With the exception of A, the other intermediaries do not possess an extraordinary large number of direct contacts (degree).
Using SNA Measures of Internal Team Connections to Select Team Members
In some cases, the only concern in team design may be whether team members are connected to the people outside the team whose behavior they wish to influence (high degree or net degree). An example would be a set of highly motivated opinion leaders who are already convinced of the value of some change and can be reliably counted upon to seek out their colleagues outside the team and attempt to influence their behavior. In other cases, where the effectiveness of the team depends on the ability to assimilate and disseminate information, or the ongoing motivation of team members requires reinforcement, connections of team measures to each other are more likely to be important and different sociometric measures of potential influence may become more important. For example, betweenness can be important in such settings since it not only can indicate connections to persons outside the team but connections within the team. For instance, if a team is intended to serve as a conduit for information regarding specific but rare clinical topics such that needed information is typically provided by individuals outside the team, a team member who sits between many different pairs of potential holders and users of the information will be most valuable, and betweenness will be critical.
Density
A network or part of a network is said to be dense when a large fraction of the potential contacts among its members are present. In a two-person network in which people are connected or not, density is 0 or 1. With a three-person network, there can be 0, 1, 2 or 3 connections, so that density can be 0, 1/3, 2/3, or 1. Density is important when movement of information among team members is important to its success. In this sense it is similar to betweenness. Density may also matter when team members require reinforcement from each other, perhaps because motivation to continue the project may be less than ideal. The connections among individuals in dense networks can provide social support to team members that strengthen their commitment to follow desired actions and increase the likelihood that deviations from those actions will be noted by their peers.
EMPIRICAL APPLICATION
In this section, we use sociometric, sociodemographic, and professional data from social network surveys to describe the structure of interaction among the 71 physicians attending on the general medicine services at the University of Chicago Medical Center in 2006–2007.
Data
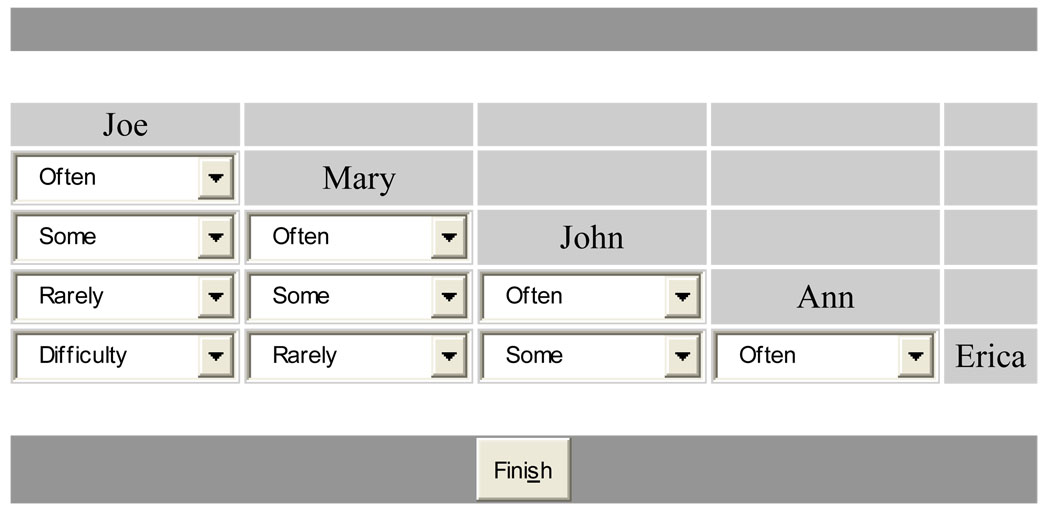
At the University of Chicago Medical Center, all attending physicians on the general medicine inpatient service are sent an annual survey to collect information on various professional and practice characteristics, career satisfaction and sociodemographic background. Since 2003, this survey has included a social network module comprised of 2 sets of questions based on a survey instrument developed by Burt (2005). The first item provides respondents with a roster of attending physicians on the general medicine inpatient service from the same year, and then asks them to select up to 8 other physicians (or “contacts”) with whom they interact most frequently. The second item asks the respondents to assess the frequency and quality of relations between each of their contacts using the following ratings: “often,” indicating that two contacts speak often with one another and are familiar with one another; “some,” indicating that two contacts speak with each other from time to time and know something about one another, but are not especially close; “rarely,” indicating that two physicians speak infrequently and are unfamiliar with each other; and “difficulty,” indicating that contacts have difficulty coordinating between the two contacts for one reason or another. We use a matrix, illustrated in Figure 3, to collect indirect information on ties between actors by asking respondents to provide information on the frequency of interaction between all pairs of contacts that the respondent named. This approach, which measures the cognitive social structure of each respondent’s ego network, allows us to fill out the overall structure of relations in the network of general medicine attending physicians at UCMC in our study year because we administered the survey to all physicians. While this network survey approach also allows researchers to explore self-report bias (Krackhardt 1987), our primary reason for adopting this approach is to address survey non-response or incomplete response.
Figure 3.
University of Chicago Attending Social Network Survey Sociometric Matrix
In our analyses, we define a relationship to exist between two physicians when either names the other as someone with whom they interact most frequently. Thus, a relation can exist between A and B if A names B as a contact, even if B does not name A. Relations between actors where one or both reported interacting only “some,” “rarely,” or “with difficulty” were coded as non-existent. Where two actors provided asymmetric appraisals of interaction frequency, we coded the existence of a relationship on the basis of the higher frequency.
We analyze these data using Pajek v.1.23, an open-source SNA package (Batagelj & Mrvar, 1996). For ease of exposition, we elaborate on our analytic methods as we describe our results.
Results
In 2006–07, all 71 physicians attending on the general medicine services were surveyed, and 56 (79%) responded. Table 1 reports characteristics of these physicians, including, gender, sub-specialty, self-identification as a hospitalist, primary care involvement, and research involvement.
TABLE 1.
Characteristics of Attending Physicians on Medical Service at UCMC, 2006–2007
| Characteristic | N | % |
|---|---|---|
| Subspecialty | ||
| Endocrinology, Diabetes & Metabolism | 3 | 4.23 |
| Infectious Diseases | 3 | 4.23 |
| Geriatric Medicine | 4 | 5.63 |
| General Internal Medicine | 26 | 36.62 |
| No Response | 35 | 49.30 |
| Self-reported Hospitalist Status | ||
| Hospitalist | 15 | 21.13 |
| Not a Hospitalist | 32 | 45.07 |
| No Response | 24 | 33.80 |
| Professional Time in Primary Care Group | ||
| 30% or more | 29 | 40.85 |
| Less than 30% | 24 | 33.80 |
| No Response | 18 | 25.35 |
| Professional Time in Research | ||
| 30% or more | 20 | 28.17 |
| Less than 30% | 33 | 46.48 |
| No Response | 18 | 25.35 |
| Gender | ||
| Female | 30 | 42.86 |
| Male | 40 | 57.14 |
| No Response | 1 | 1.41 |
| Survey Return Rate | ||
| Returned | 51 | 71.83 |
| Not Returned | 20 | 28.17 |
Sociogram
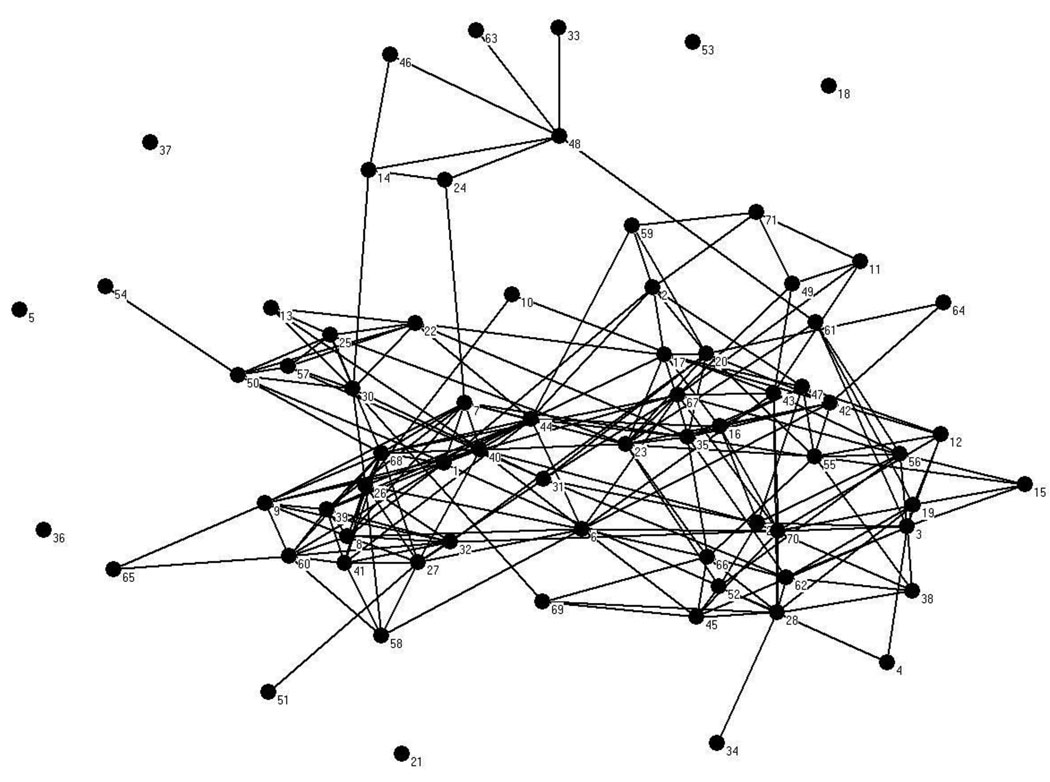
Figure 4 presents the sociogram depicting the 2006–07 attending network. The sociogram is notable for a large mass of more highly connected individuals in the bottom two thirds of the figure, perhaps with clustering on the right and on the left, a third clustering towards the top of the diagram, and a number of individuals located on the periphery who are either not connected to anyone (social isolates) or connected by only one or two people.
FIGURE 4.
Sociogram of 2006–2007 General Medicine Inpatient Attending Physician Social Network
Network Clusters (Partitions)
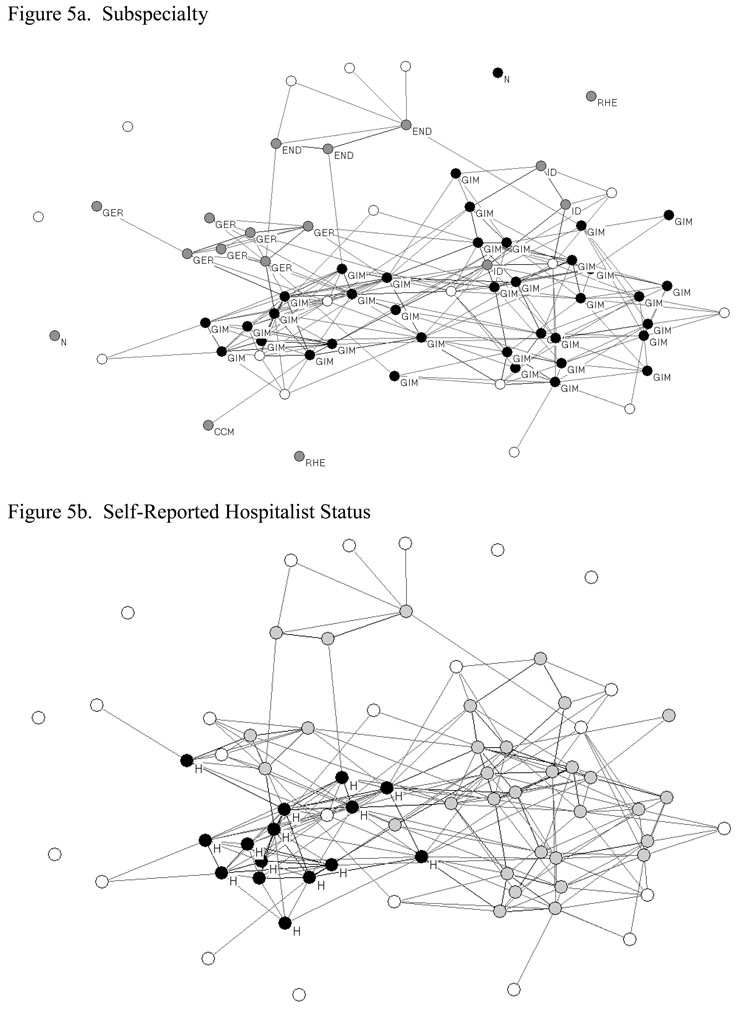
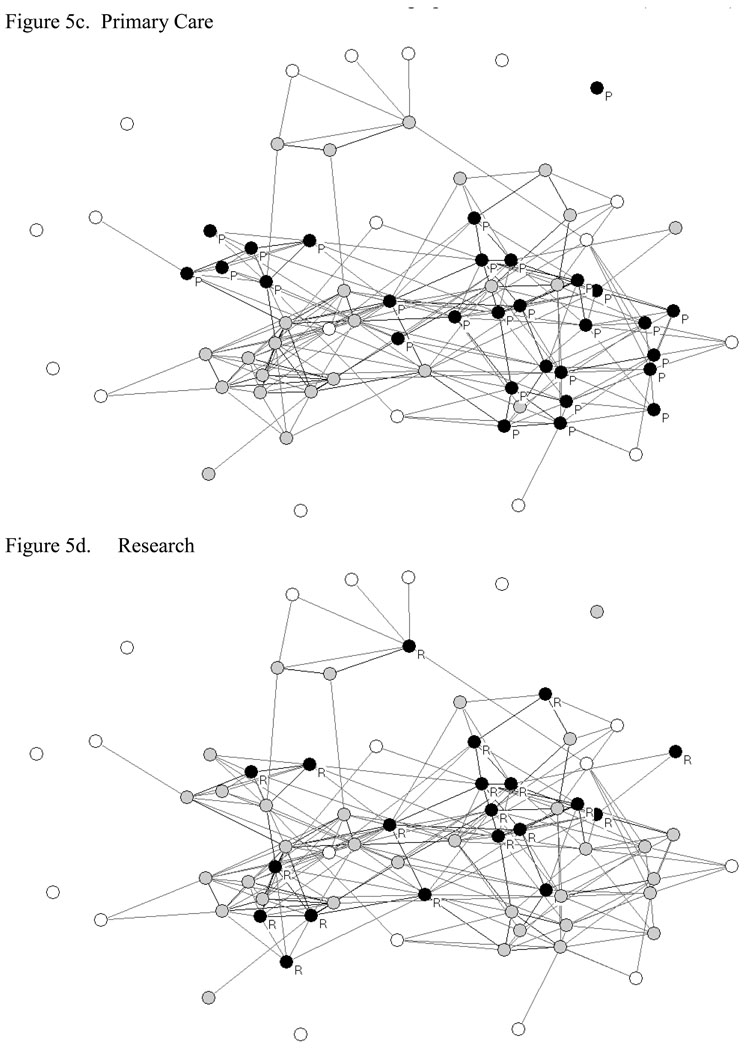
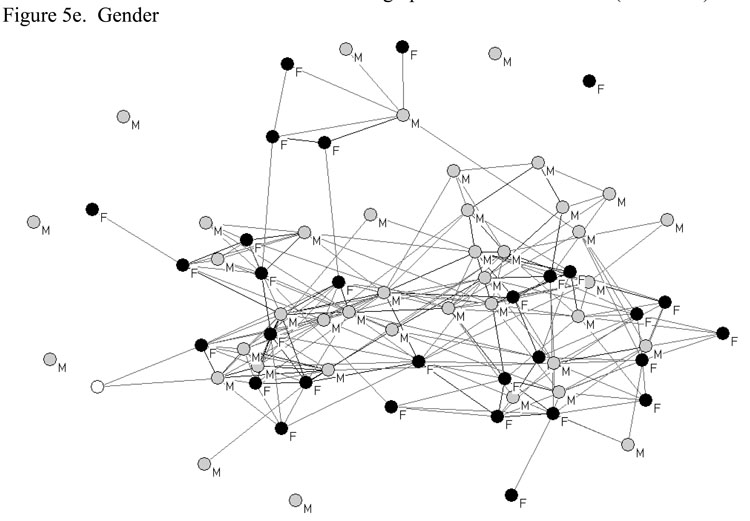
To understand these patterns of interactions among attending physicians, it is useful to examine whether they are associated with any professional and/or sociodemographic characteristics. To do this, we “partitioned” the sociogram in a series of figures by labeling each physician by their subspecialty within medicine, their self-reported hospitalist status, their percent time spent in primary care (30% or more), their percent time spent in research (30% or more), or gender.
The subspecialty partition is illustrated in Figure 5a. Specialties include general internal medicine (GIM), endocrinology (END), infectious disease (ID), critical care medicine (CCM), geriatrics (GER), nephrology (N), and rheumatology (RHE). White circles indicate item non-response/unknown subspecialty. This graph shows relatively distinct clustering by subspecialty, for example with endocrinologists and geriatricians in seemingly cohesive subgroups. Figures 5b–5e illustrate the hospitalist, primary care, research, and gender partitions, respectively. Together, these partitions suggest clustering of interaction by subspecialty and professional activities, and they highlight potential subgroups from which someone responsible for organizing a QI team might consider drawing team members to diversify the human and social capital available to the team as a group. The clustering of attendings by specialty status (e.g. geriatrics and infectious disease) suggests that subspecialists may be less integrated into the set of general medicine attendings than general internists. The general internists and hospitalists are far more closely connected among the set of general medicine attendings. It is also interesting that there appears to be substantial clustering of the physicians who identify themselves as hospitalists and those who identify themselves as general internists. This may reflect the growing independent identities of these groups and suggests the need to consider both as separate but critical players in the design of QI teams for inpatient general medical services. It is also interesting that there is substantial clustering of contact by personal attributes not directly related to clinical roles, such as time allocated to research and physician gender.
FIGURE 5.
Professional and Sociodemographic Network Partitions
Degree
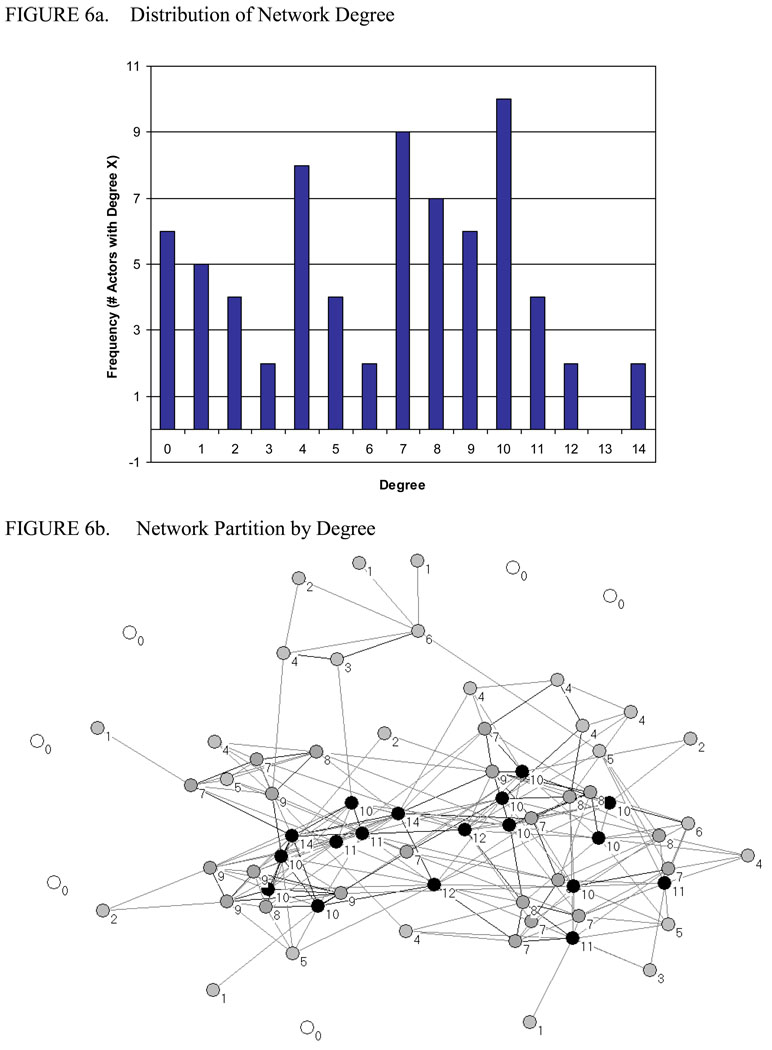
Figure 6a shows the distribution of degree in this network. The number of direct contacts of attendings ranged from 0 to 14, with a median of 7 and mean and standard deviation of 6.30 and 3.78. Figure 6b partitions the network by degree: physicians denoted by black, grey and unfilled circles had 10 or more; 7–9 or fewer than 7 contacts direct contacts, respectively. This partition reveals the most socially active physicians in the network, and where they are located. Combined with any of the previous partitions, this information enables persons designing a team to choose the most active physicians within each professional and/or sociodemographic subgroup. Not surprisingly, many of the physicians with the highest degree are located in the center of the sociogram and are connected to each other. This suggests that the use of degree alone to select team members may produce many redundant ties and result in teams that have trouble reaching less central aspects of the broader social network.
FIGURE 6.
Net Degree
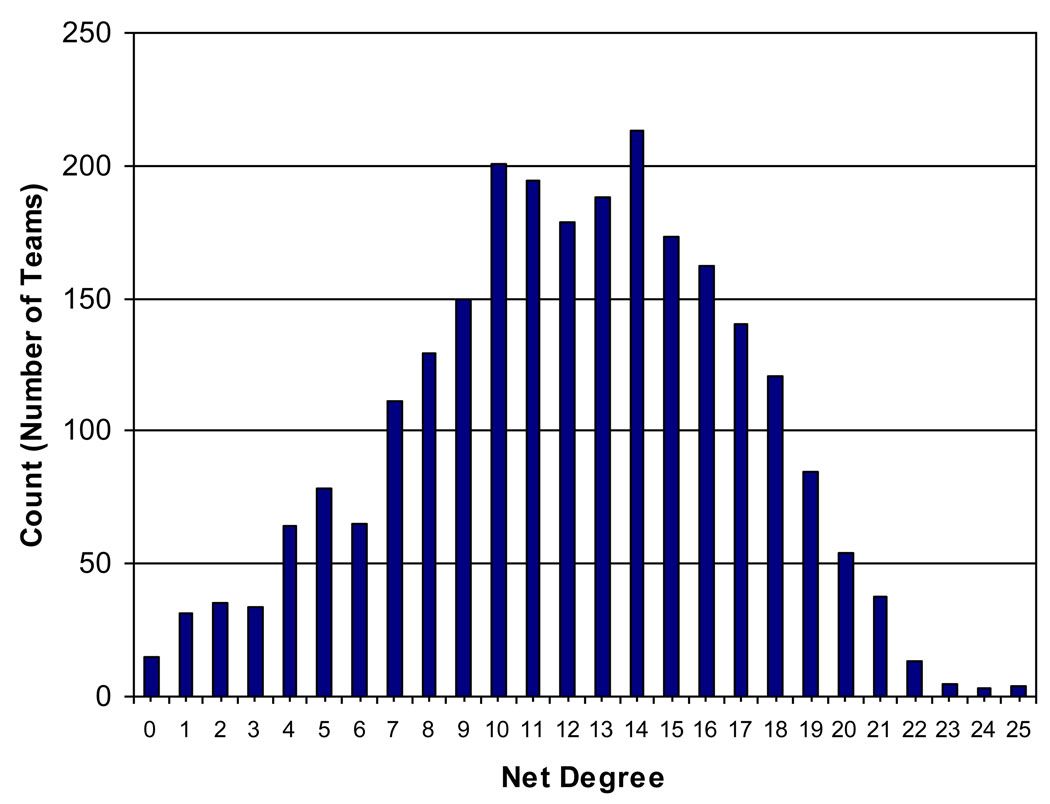
Net degree is a characteristic of teams that reflects the total number of non-redundant ties possessed by the team. Given any proposed team comprised of K team members, it is easy to calculate the net degree of T as the sum of each individual’s degree, minus the total number of redundant ties that members have in common.1 To demonstrate the application of net degree as a tool for identifying optimal teams, we focus on the hypothetical problem of identifying two-person teams with the greatest net degree in our data. To do this, we created a dataset of all 2,485 unique dyads, the number of individuals to whom they were connected based on their sociometric choices (degree), and the identities of those individuals. We then used the countmatch module (Cox, 2006) with Stata 10.0 (Stata Corporation, 2007) to identify redundant contacts. Net degree for each dyad was calculated as the sum of each individual’s degrees, minus the number of redundant contacts.
Figure 7 provides a histogram of net degree in two-person teams constructed from our population of 71 physicians. Net degree ranged from 0–25, with a mean of 12.04 and a standard deviation of 4.76. Approximately 64% of the 2,485 unique, hypothetical dyads had no redundant ties. Only one team had the maximum number of redundant ties (8).
FIGURE 7.
Distribution of Net Degree in Two-Person Teams
Table 2 lists the top 10 2-person teams by net degree and total degree. The teams with greatest net degree involve often individuals with diverse backgrounds – e.g. a hospitalist and non-hospitalist, a male and a female, or a researcher and a non-researcher.
Table 2.
Compositional Characteristics of Top 10 Teams Ranked in Descending Order of Net Degree.
| Rank | Member 1 |
Member 2 |
Net Degree |
Total Degree |
Sub- specialty1 |
Sub- specialty 2 |
Hospi- talist 1 |
Hospi- talist 2 |
PCP 1 | PCP 2 | Research 1 |
Research 2 |
Gender 1 | Gender 2 |
|---|---|---|---|---|---|---|---|---|---|---|---|---|---|---|
| 1 | 3 | 44 | 25 | 25 | IM | IM | No | Yes | Yes | Yes | No | Yes | Female | Male |
| 2 | 28 | 44 | 25 | 25 | IM | IM | No | Yes | Yes | Yes | No | Yes | Female | Male |
| 3 | 3 | 68 | 25 | 25 | IM | IM | No | Yes | Yes | No | No | No | Female | Male |
| 4 | 28 | 68 | 25 | 25 | IM | IM | No | Yes | Yes | No | No | No | Female | Male |
| 5 | 6 | 44 | 24 | 26 | · | IM | Yes | Yes | No | Yes | Yes | Yes | Female | Male |
| 6 | 20 | 68 | 24 | 24 | IM | IM | No | Yes | Yes | No | Yes | No | Male | Male |
| 7 | 42 | 68 | 24 | 24 | · | IM | No | Yes | Yes | No | Yes | No | Male | Male |
| 8 | 67 | 68 | 23 | 24 | ID | IM | No | Yes | No | No | Yes | No | Male | Male |
| 9 | 35 | 68 | 23 | 24 | IM | IM | No | Yes | Yes | No | Yes | No | Male | Male |
| 10 | 44 | 55 | 23 | 24 | IM | IM | Yes | No | Yes | Yes | Yes | Yes | Male | Male |
Density
In two-person teams such as those we examine here, density is described simply by whether the two individuals have a direct connection to each other. As described above, such connections may be useful when team function is especially dependent on trust or communication between team members. However, because individuals with dense ties to one another tend to share similar patterns of relationships, teams selected based only on the density of connection among team members may tend to have lower net degree. Table 3 illustrates this principle by listing the top 10 teams in descending order of net degree and total degree for teams that do and do not share ties between team members. Top teams sharing a tie between members have slightly lower net degree than top teams without those ties. As noted above, the nature of the task expected of the team may guide how to select team members given this tradeoff.
Table 3.
Top 10 Teams in Descending Order of Net Degree and Total Degree, by Presence of Prior Tie between Teammates
| No Actual Tie Present |
Actual Tie Present |
||||||
|---|---|---|---|---|---|---|---|
| Rank | Member 1 | Member 2 | Net Degree | Rank | Member 1 | Member 2 | Net Degree |
| 1 | 3 | 68 | 25 | 1 | 6 | 44 | 24 |
| 2 | 28 | 44 | 25 | 2 | 67 | 68 | 23 |
| 3 | 28 | 68 | 25 | 3 | 6 | 42 | 22 |
| 4 | 3 | 44 | 25 | 4 | 44 | 68 | 22 |
| 5 | 42 | 68 | 24 | 5 | 35 | 44 | 21 |
| 6 | 20 | 68 | 24 | 6 | 40 | 44 | 21 |
| 7 | 68 | 70 | 23 | 7 | 23 | 40 | 21 |
| 8 | 44 | 55 | 23 | 8 | 26 | 44 | 21 |
| 9 | 55 | 68 | 23 | 9 | 23 | 67 | 21 |
| 10 | 35 | 68 | 23 | 10 | 27 | 68 | 20 |
| No Actual Tie Present |
Actual Tie Present |
||||||
|---|---|---|---|---|---|---|---|
| Rank | Member 1 | Member 2 | Total Degree | Rank | Member 1 | Member 2 | Total Degree |
| 1 | 23 | 44 | 26 | 1 | 44 | 68 | 28 |
| 2 | 6 | 68 | 26 | 2 | 6 | 44 | 26 |
| 3 | 23 | 68 | 26 | 3 | 1 | 44 | 25 |
| 4 | 3 | 68 | 25 | 4 | 40 | 44 | 25 |
| 5 | 3 | 44 | 25 | 5 | 1 | 68 | 25 |
| 6 | 28 | 44 | 25 | 6 | 40 | 68 | 25 |
| 7 | 28 | 68 | 25 | 7 | 7 | 44 | 24 |
| 8 | 42 | 68 | 24 | 8 | 8 | 68 | 24 |
| 9 | 35 | 68 | 24 | 9 | 67 | 68 | 24 |
| 10 | 8 | 44 | 24 | 10 | 26 | 68 | 24 |
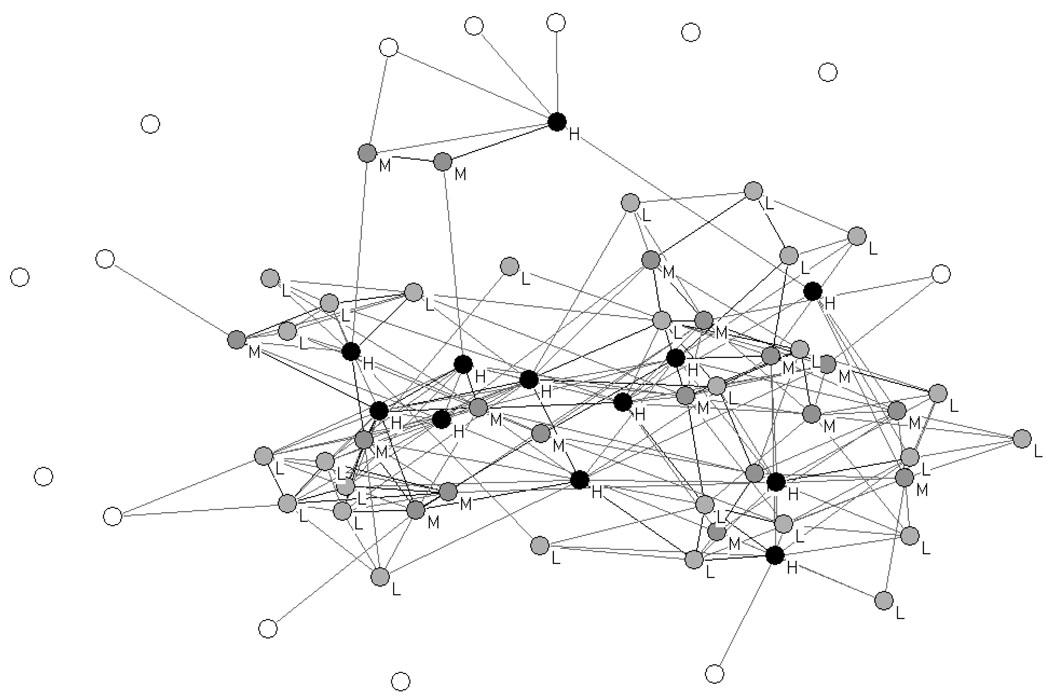
Betweenness
The proportion of shortest paths involving the average physician was 0.02 with a standard deviation of 0.02 and a median of 0.01. Betweenness ranged from a minimum of zero to a maximum of 0.07. Figure 8 partitions the network into high (H), medium, and low (L) levels of betweenness based on whether: physicians are involved in >3%, 2–3% or <2% of geodesics. Figure 8 illustrates how betweenness and degree measure different aspects of social activity or an actor’s social “centrality” within a network. Some actors (e.g. Physicians #48, 24, and 14) with below-average degree, had above-average betweenness. If team members need to disseminate information throughout the organization, betweenness may be helpful in identifying optimal members in the informal communication network and those members who may be most instrumental in coordinating organization-wide action.
FIGURE 8.
Network Partition by Betweenness
DISCUSSION
In this paper, we attempted to outline how principles and methods of social network analysis can provide actionable insight into issues of quality improvement team design. We also demonstrated, using social network data collected from physicians at an academic medical center, that our approach can be feasibly implemented in healthcare settings. While previous studies in the medical literature have used social network principles to identify effective single opinion leaders (Soumerai et al., 1998; Kravitz et al., 2003), we are not aware of prior studies that have used SNA to improve team the design of quality improvement teams in health care. In addition, while research in sociology and management science have investigated the association between factors such as degree, density, compositional homogeneity/heterogeneity, and betweenness and team performance in other fields, these factors and their interrelationships have not previously been systematically investigated in healthcare. We also introduced a new network measure at the group (or team) level, which we call “net degree,” to characterize the total stock of non-redundant social contacts that are available to a group as a whole. To our knowledge, this measure has not yet been proposed by others (for example, Oh, Chung and Labianca 2004). The measure of net degree, as we have conceptualized it, as a derivative of the large body of theoretical and empirical work by Burt (2005), Reagans and Zuckerman (2001), and others who have studied the differential advantages of in-group versus out-group ties in affecting group performance. For small groups, this measure is relatively easy to compute and can be interpreted as a measure of the stock of social capital that may be useful in resource/information acquisition and strategic interactions among non-group members. It is also interesting to note that net degree is related to the concept of structural equivalence in social network analysis; including two individuals on a team who have congruent patterns of ties to all others in a network – and are therefore structurally equivalent (Lorrain and White 1971) – would not increase the net degree of team because shared contacts would be redundant. Exploring the connection between notions of structural equivalence and strategies to optimize team composition seems to be a valuable area for future theoretical and empirical analysis.
The most salient limitation of our current study is our lack of outcomes data, prohibiting us from testing our hypotheses about how team structure and quality improvement context may influence team effectiveness. Clinical trials comparing different team structures in different quality improvement contexts are be needed to determine whether teams designed on the basis network properties confer advantages in performance.
Our current analyses also have several additional limitations. First, our data are limited to a single institution, and reflect only a single type of relational content between individuals, namely “interaction.” Although it might be ideal to measure different types of re social network connections by using multiple name generators to elicit ties with different content (e.g., Podolny and Barron 1997) there is precedence for using a name generator based on communication/interaction frequency to study team structure and team performance (Reagans and Zuckerman 2001). Because social network surveys can be burdensome, we traded off in-depth information on different types of exchange relations in favor of in-depth data on overall network structure. We believe this approach is theoretically defensible, based on the notion that that exchanges are often “embedded” in existing relations (Granovetter 1985). Embedded exchanges may give rise exchange of multiple types of resources or “multiplex” relations between individuals – i.e., the (Uzzi 1996). Thus, although our name generator focuses only on frequency of interaction, it is likely that a variety of resources flow through those enumerated relations, as appropriate to situations as they arise (Oh, Chung, Labianca 2004).
In addition to our lack of data on the content of interaction between physicians, we also lack data on the quality of interaction among physicians. Relationship strength may be a better predictor of the propensity for individuals to turn to another for resources, and/or of the propensity to be influenced by another.
Finally, there are questions about whether social network approaches can be feasibly applied in medical settings for the purpose of QI and, if so, how. It is unclear if healthcare managers will be open to these approaches or even whether healthcare providers would be willing to respond to a social network survey.
Future Research
Future research is necessary to validate net degree as a measure of team-level social capital and to evaluate the usefulness of SNA as a tool for improving care. The well-recognized importance of teams in quality improvement and the strong evidence from other fields that SNA can provide valuable insights into the effectiveness of teams, define a potentially rich area for research at the intersection of implementation science, network analysis, and quality improvement. This can, in turn, lead to the development of new metrics and hypotheses, and ultimately further theoretical refinement in SNA. The field of healthcare quality improvement, with its emphasis on hypothesis testing and rapid cycle studies, offers a unique “laboratory” in which to rigorously evaluate competing social scientific theories. A prime example concerns the unresolved debate over the importance of homogeneity (or heterogeneity) along sociodemographic versus organizational and functional characteristics among team members as they bear on team dynamics and ultimately, performance. Existing research has primarily studied existing top management (Bunderson 2003; Wiersema and Bantel, 1992; Smith et al. 1994; Simons, Pelled and Smith, 1999), research and development (Reagans, Zuckerman and McEvily 2004; Reagans and Zuckerman 2001), and product development (Ancona and Caldwell, 1992) teams in an observational manner. Healthcare quality improvement, with its emphasis on empirically-grounded, rapid-cycle studies, may offer greater opportunities to study teams using trial designs given the pervasiveness of experimental approaches in healthcare organizations. Moreover, longitudinal research on network-engineered teams offers additional opportunities to develop and test network theories of structural dynamics and the evolution of social relationships.
Acknowledgments
We would like to acknowledge that this work was supported by the United States Agency for Healthcare Research and Quality through the Hospital Medicine and Economics Center for Education and Research in Therapeutics (CERT), U18 HS016967-01 (Meltzer, PI).
Footnotes
This is a PDF file of an unedited manuscript that has been accepted for publication. As a service to our customers we are providing this early version of the manuscript. The manuscript will undergo copyediting, typesetting, and review of the resulting proof before it is published in its final citable form. Please note that during the production process errors may be discovered which could affect the content, and all legal disclaimers that apply to the journal pertain.
Given a population, N, of potential team members from which to draw a team of K team members, it is more computationally demanding to identify the team or set of teams that have the greatest net degree: doing so requires computing net degree for all possible teams of size k. The number of possible teams of size k that can be constructed from a population of size n can be determined according to the formula . If we were to consider 2-person teams, there would be possible teams that could be constructed from our population of 71 attending physicians. There would be 57,155 unique 3-person teams that could be constructed.
Hossain L, Wu A, Chung KS. Actor centrality correlates to project based coordination. Computer Supported Cooperative Work: Proceedings of the 2006 20th Anniversary Conference on computer Supported Cooperative Work. 2006;363–372.
Freeman LC. Centrality in Social Networks: Conceptual Clarification. Social Networks. 1978;1:215–239.
REFERENCES
- Ancona DG, Caldwell DF. Demography and design: predictors of new product team performance. Organization Science. 1992;3(3):321–341. [Google Scholar]
- Bandura A. Social learning theory. Englewood Cliffs, NJ: Prentice-Hall; 1977. [Google Scholar]
- Bantel KA, Jackson SE. Top management and innovations in banking: does the composition of the top team make a difference? Strategic Management Journal. 1989;10:107–124. [Google Scholar]
- Batagelj V, Mrvar A. Pajek – Program for Large Network Analysis [computer software] 1996 Available from http://vlado.fmf.uni-lj.si/pub/networks/pajek/
- Becker GS. Accounting for Tastes. Cambridge, MA: Harvard University Press; 1998. [Google Scholar]
- Bodenheimer T. The movement for improved quality in health care. New England Journal of Medicine. 1999;340(6):488–492. doi: 10.1056/NEJM199902113400621. [DOI] [PubMed] [Google Scholar]
- Bunderson JS. Team member functional background and involvement in management teams: direct effects and the moderating role of power centralization. The Academy of Management Journal. 2003;46(4):458–474. [Google Scholar]
- Burt RS. Structural Holes. Cambridge, MA: Harvard University Press; 1992. [Google Scholar]
- Burt RS. Brokerage and Closure: An Introduction to Social Capital. New York: Oxford University Press; 2005. [Google Scholar]
- Coleman JS. Social capital in the creation of human capital. American Journal of Sociology. 1988;94 Suppl:S95–S120. [Google Scholar]
- Coleman J, Katz B, Menzel H. Medical innovation: a diffusion study. New York: Bobbs-Merrill; 1966. [Google Scholar]
- Cox NJ. COUNTMATCH: Stata module to count matching values for one variable in another [computer software] 2006 Available from http://fmwww.bc.edu/repec/bocode/c/countmatch.hlp.
- Cross R, Ehrlich K, Dawson R, Helferich J. Managing Collaboration: Improving Team Effectiveness Through a Network Perspective: California Management Review. 2008;50(4):74–98. [Google Scholar]
- Freeman LC. Centrality in Social Networks: Conceptual Clarification. Social Networks. 1978;1:215–239. [Google Scholar]
- Granovetter MS. Economic action and social structure: the problem of embeddedness. American Journal of Sociology. 1985;91:481–510. [Google Scholar]
- Grumbach K, Bodenheimer T. Can health care teams improve primary care practice? JAMA. 2004;291:1246–1251. doi: 10.1001/jama.291.10.1246. [DOI] [PubMed] [Google Scholar]
- Harolds J. Effective radiology teams. Journal of the American College of Radiology. 2005;2:151–158. doi: 10.1016/j.jacr.2004.07.020. [DOI] [PubMed] [Google Scholar]
- Hossain L, Wu A, Chung KS. Actor centrality correlates to project based coordination. Computer Supported Cooperative Work: Proceedings of the 2006 20 th Anniversary Conference on Computer Supported Cooperative Work; 2006. pp. 363–372. [Google Scholar]
- Institute of Medicine. Crossing the Quality Chasm. Washington, D.C: The National Academies Press; 2001. [Google Scholar]
- Institute of Medicine. To Err is Human: Building a Safer Health System. Washington, D.C: The National Academies Press; 2000. [PubMed] [Google Scholar]
- Institute of Medicine. Preventing Medication Errors. Washington, D.C: The National Academies Press; 2007. [Google Scholar]
- Joint Commission. 2008 National Patient Safety Goals. 2008 Retrieved September 11, 2008 from http://www.jointcommission.org/PatientSafety/NationalPatientSafetyGoals/
- Junger S, Pestinger M, Elsner F, Krumm N, Radbruch L. Criteria for successful multiprofessional cooperation in palliative care teams. Palliative Medicine. 2007;21:347–354. doi: 10.1177/0269216307078505. [DOI] [PubMed] [Google Scholar]
- Krackhardt D. Cognitive social structures. Social Networks. 1987;9:109–134. [Google Scholar]
- Kravitz RL, Krackhardt D, Melnikow J, Franz CE, Gilbert WM, Zach A, Paterniti DA, Romano PS. Networked for Change? Identifying Obstetric Opinion Leaders and Assessing their Opinion on Cesarean Delivery. Social Science and Medicine. 2003;57:2423–2434. doi: 10.1016/s0277-9536(03)00137-0. [DOI] [PubMed] [Google Scholar]
- Lammers JC, Cretin S, Gilman S, Calingo E. Total quality management in hospitals; the contributions of commitment, quality councils, teams, budgets, and training to perceived improvement at Veterans Health Administration Hospitals. Medical Care. 1996;34(5):463–478. doi: 10.1097/00005650-199605000-00008. [DOI] [PubMed] [Google Scholar]
- Lazarsfeld PF, Merton RK. Friendship as a social process; a substantive and methodological analysis. In: Berger M, editor. Freedom and Control in Modern Society. New York: Van Nostrand; 1954. [Google Scholar]
- Lin N, Cook K, Burt RS. Social Capital: Theory and Research. New York: Aldine de Gruyter; 2001. [Google Scholar]
- Lingard L, Espin S, Evans C, Hawryluck L. The rules of the game: interprofessional collaboration on the intensive care unit team. Critical Care. 2004;8(6):R403–R408. doi: 10.1186/cc2958. [DOI] [PMC free article] [PubMed] [Google Scholar]
- Lorrain FP, White JC. Structural equivalence of individuals in social networks. Journal of Mathematical Sociology. 1971;1:49–80. [Google Scholar]
- Mickan SM, Rodger SA. Effective health care teams: a model of six characteristics developed from shared perceptions. Journal of Interprofessional Care. 2005;19(4):358–370. doi: 10.1080/13561820500165142. [DOI] [PubMed] [Google Scholar]
- Mitchell GK, Brown RM, Erikssen L, Tieman JJ. Multidisciplinary care planning in the primary care management of completed stroke: a systematic review. BMC Fam Pract. 2008;9(44) doi: 10.1186/1471-2296-9-44. [DOI] [PMC free article] [PubMed] [Google Scholar]
- Mohr JJ, Batalden PB. Improving safety on the front lines: the role of clinical microsystems. Quality and Safety in Health Care. 2002;11:45–50. doi: 10.1136/qhc.11.1.45. [DOI] [PMC free article] [PubMed] [Google Scholar]
- Mullen B, Johnson C, Salas E. Effects of communication network structure: components of positional centrality. Social Networks. 1991;13(2):169–185. [Google Scholar]
- National Quality Forum. Safe Practices for Better Health care 2006 Update: A Consensus Report. 2007 Retrieved September 11, 2008 from http://www.qualityforum.org/
- Oh H, Chung M, Labianca G. Group social capital and group effectiveness: the role of informal socializing ties. Academy of Management Journal. 2004;47(6):860–875. [Google Scholar]
- Øvretveit J. Total quality management in European health care. International Journal of Health Care Quality Assurance. 2000;13(2):74–79. [Google Scholar]
- Podolny JM, Baron JN. Resources and relationships; social networks and mobility in the workplace. American Sociological Review. 1997;62(5):673–693. [Google Scholar]
- Portes A. Social capital: its origins and applications in modern sociology. Annual Review of Sociology. 1998;24:1–24. [Google Scholar]
- Putnam RD. Social capital and public affairs. Bulletin of the American Academy of Arts and Sciences. 1994;47(8):5–19. [Google Scholar]
- Ramanadhan S, Wiecha JL, Emmons KM, Gortmaker SL, Viswanath K. Extra-team connections for knowledge transfer between staff teams. Health Education Research. 2009 June 15; doi: 10.1093/her/cyp030. Epublication ahead of print. [DOI] [PMC free article] [PubMed] [Google Scholar]
- Reagans R, Zuckerman EW. Networks, diversity and productivity: the social capital of corporate R&D teams. Organization Science. 2001;12(4):502–517. [Google Scholar]
- Reagans R, Zuckerman E, McEvily B. How to make the team: social networks vs. demography as criteria for designing effect teams. Administrative Science Quarterly. 2004;49(1):101–133. [Google Scholar]
- Rubenstein LV, Mittman BS, Yano EM, Mulrow CD. Understanding health care provider behavior to improving health care: the QUERI Framework for Quality Improvement. Medical Care. 2000;38(6):I129–I141. [PubMed] [Google Scholar]
- Rubenstein LV, Pugh J. Strategies for promoting organizational and practice change by advancing implementation research. Journal of General Internal Medicine. 2006;21:S58–S64. doi: 10.1111/j.1525-1497.2006.00364.x. [DOI] [PMC free article] [PubMed] [Google Scholar]
- Saltman DC, O’Dea NA, Farmer J, Veitch C, Rosen G, Kidd MR. Groups or teams in health care: finding the best fit. Journal of Evaluation in Clinical Practice. 2007;13:55–60. doi: 10.1111/j.1365-2753.2006.00649.x. [DOI] [PubMed] [Google Scholar]
- Simons T, Pelled LH, Smith KA. Making use of difference: diversity, debate, and decision comprehensiveness in top management teams. The Academy of Management Journal. 1999;42(6):662–673. [Google Scholar]
- Smith KG, Smith KA, Olian JD, Sims HP, Jr, O’Bannon DP, Scully JA. Top management team demography and process: the role of social integration and communication. Administrative Science Quarterly. 1994;39(3):412–438. [Google Scholar]
- Smith SM, Allwright S, O’Dowd T. Does sharing care across the primary-specialty interface improve outcomes in chronic disease? American Journal of Managed Care. 2008;14(4):213–224. [PubMed] [Google Scholar]
- Soumerai SB, McLaughlin TJ, Gurwitz JH, Guadagnoli E, Hauptman PJ, Borbas C, Morris N, McLaughlin B, Gao X, Willison DJ, Asinger R, Gobel F. Effect of Local Medical Opinion Leaders on Quality of Care for Acute Myocardial Infarction: A Randomized Controlled Trial. JAMA. 1998;279:1358–1363. doi: 10.1001/jama.279.17.1358. [DOI] [PubMed] [Google Scholar]
- StataCorp. Stata Statistical Software: Release 10 [computer software] College Station, TX: StataCorp LP; 2007. [Google Scholar]
- Uzzi B. The sources and consequences of embeddedness for the economic performance of organizations: the network effect. American Sociological Review. 1996;61(4):674–698. [Google Scholar]
- Vyt A. Interprofessional and transdisciplinary teamwork in health care. Diabetes/Metabolism Research and Reviews. 2008;24 Suppl 1:S106–S109. doi: 10.1002/dmrr.835. [DOI] [PubMed] [Google Scholar]
- Wagner EH. The role of patient care teams in chronic disease management. British Medical Journal. 2000;320:569–572. doi: 10.1136/bmj.320.7234.569. [DOI] [PMC free article] [PubMed] [Google Scholar]
- Wasserman S, Faust K. Social Network Analysis: Methods and Applications. Cambridge: Cambridge University Press; 1994. [Google Scholar]
- Weinreb JC. Building a team for change in an academic radiology department. Radiology. 2004;232(2):327–330. doi: 10.1148/radiol.2322032115. [DOI] [PubMed] [Google Scholar]
- Wellman B, Haase AQ, Witte J, Hampton K. Does the internet increase, decrease, or supplement social capital? American Behavioral Scientist. 2001;45(3):436–455. [Google Scholar]
- Wiersema MF, Bantel KA. Top management team demography and corporate strategic change. The Academy of Management Journal. 1992;35(1):91–121. [Google Scholar]
- Xyrichis A, Lowton K. What fasters or prevents interprofessional teamworking in primary and community care? A literature review. International Journal of Nursing Studies. 2008;45:140–153. doi: 10.1016/j.ijnurstu.2007.01.015. [DOI] [PubMed] [Google Scholar]


