

Abstract
Endocannabinoids play an important role in a diverse range of neurophysiological processes including neural development, neuroimmune function, synaptic plasticity, pain, reward and affective state. This breadth of influence and evidence for altered endocannabinoid signalling in a variety of neuropathologies has fuelled interest in the accurate quantification of these lipids in brain tissue. Established methods for endocannabinoid quantification primarily employ solvent-based lipid extraction with further sample purification by solid phase extraction. In recent years in vivo microdialysis methods have also been developed for endocannabinoid sampling from the brain interstitial space. However, considerable variability in estimates of endocannabinoid content has led to debate regarding the physiological range of concentrations present in various brain regions. This paper provides a critical review of factors that influence the quantification of brain endocannabinoid content as determined by lipid extraction from bulk tissue and by in vivo microdialysis. A variety of methodological issues are discussed including analytical approaches, endocannabinoid extraction and purification, post-mortem changes in brain endocannabinoid content, cellular reactions to microdialysis probe implantation and caveats related to lipid sampling from the extracellular space. The application of these methods for estimating brain endocannabinoid content and the effects of endocannabinoid clearance inhibition are discussed. The benefits, limitations and pitfalls associated with each approach are emphasized, with an eye toward the appropriate interpretation of data gathered by each method.
This article is part of a themed issue on Cannabinoids. To view the editorial for this themed issue visit http://dx.doi.org/10.1111/j.1476-5381.2010.00831.x
Keywords: anandamide, 2-arachidonoylglycerol, FAAH, MAGL, brain, microdialysis, extracellular, LC-MS, GC-MS, quantitative analysis
In the early 1990s two arachidonic acid derivatives were identified as endogenous cannabinoid receptor ligands. The first endocannabinoid (eCB) to be discovered was anandamide (N-arachidonoyl-ethanolamine; AEA) (Devane et al., 1992) and within 2 years a second endogenous metabolite, 2-arachidonoylglycerol (2-AG), was shown to function as signalling molecule at CB1 and CB2 receptors (Mechoulam et al., 1995; Sugiura et al., 1995). Both of these lipids retain an arachidonoyl moiety that imparts a significant amount of their bioactivity. Other endogenous molecules have been identified that exert cannabinoid-like effects including 2-arachidonyl-glycerol ether (noladin ether) (Hanus et al., 2001), N-arachidonoyl-dopamine (NA-DA) (Bisogno et al., 2000; Huang et al., 2002), virodhamine (Porter et al., 2002), N-homo-γ-linolenoylethanolamine (HEA) and N-docosatetraenoylethanolamine (DEA) (Hanus et al., 1993; Pertwee et al., 1994). However, the presence of many of these lipids in intact tissue has been a matter of debate and their pharmacological activity and metabolism have not yet been thoroughly characterized. Bioactive eCB congeners such including palmitoylethanolamide (PEA) (Re et al., 2007) and oleoylethanolamide (OEA) (Rodriguez de Fonseca et al., 2001) have also been identified, although these moieties do not interact with cannabinoid receptors. Accordingly, AEA and 2-AG are still considered the primary endogenous mediators of cannabinoid signalling.
Since their discovery, eCBs have been implicated in the regulation of a range of physiological processes including neural development (Fride, 2008), immune function (Pandey et al., 2009; Stella, 2009), metabolism and energy homeostasis (Viveros et al., 2008), synaptic plasticity and learning (Heifets and Castillo, 2009), pain (Guindon and Hohmann, 2009), motivation and reward (Solinas et al., 2008) and emotional state (Lutz, 2009). Substantial evidence implicates eCB involvement in the aetiology of drug addiction (Lopez-Moreno et al., 2008; Parolaro and Rubino, 2008), as well as numerous models of neurodegenerative disease. The involvement of the eCB system in these various functions has been determined through the use of physiological, pharmacological and behavioural approaches. In many instances, the evidence for an eCB mechanism is indirect and the identity of the signalling molecule(s) is not known with certainty. Accordingly, there has been substantial interest in the quantification of eCB content in a variety of biological matrices.
For nearly two decades, brain eCB content has been primarily quantified by lipid extraction and purification from bulk tissue, with subsequent analysis by liquid or gas chromatography coupled with mass spectrometry (MS). Several excellent articles have been written on this topic (Hardison et al., 2006; Kingsley and Marnett, 2007; 2009;Richardson et al., 2007; Muccioli and Stella, 2008). However, the considerable variability in estimates of brain AEA and 2-AG content has led to debate regarding the physiological range of eCB concentrations in various regions, and this issue has not been critically addressed in the literature. In the past 10 years an alternate approach for estimating brain eCB content has been developed that employs in vivo microdialysis for the sampling of interstitial eCBs from awake, behaving animals. Presently, nine publications have utilized in vivo microdialysis to monitor interstitial eCB levels in rodent brain, yet sparse discussion of the benefits and limitations of this procedure exists in the literature.
This paper provides a critical review of factors that influence the quantification of brain eCB content as determined by lipid extraction from bulk tissue and by in vivo microdialysis. A focus is placed on the quantification of AEA and 2-AG in rat brain as supported by the majority of the present literature. The intent is not to provide a comprehensive cataloguing of all studies that have quantified brain eCB content, and as such the authors apologize if specific studies in a given area are not cited or discussed. All drug and target nomenclature contained in this review conforms to the British Journal of Pharmacology Guide to Receptors and Channels (Alexander et al., 2008).
Analysis of eCB content in bulk brain tissue
Analytical methods
The quantitative analysis of eCBs and related lipids from biological matrices nearly always utilizes chromatographic separation, largely due to the complex nature of tissue matrices even after lipid extraction and purification (see below). eCBs and related lipids do not typically possess electroactive, native fluorescent or UV absorbing functional groups. Chemical derivatization of AEA and 2-AG allows for spectrophotometric detection with an on-column sensitivity in the femtomole range (Arai et al., 2000; Yagen and Burstein, 2000;Wang et al., 2001). However, derivatization approaches can label a number of other sample constituents that absorb UV light or fluoresce at similar detection wavelengths, placing a substantial burden on the efficient separation of eCBs from other confounding analytes. For these reasons, most approaches for quantitative eCB analysis rely on mass spectrometric detection coupled with either gas chromatography (GC-MS) or liquid chromatography (LC-MS). These techniques offer excellent sensitivity (typically low picomole on-column) while providing a high degree of selectivity that results from combining chromatographic and mass-to-charge separation. Moreover, hydrophobic eCB molecules readily solubilize in organic solvents well suited for mass spectral analysis.
Both GC and LC separations each have distinct advantages for eCB analyses. A typical GC separation proceeds more quickly and yields greater separation than LC separations, with a single analysis typically running less than 15 min. Chemical ionization single quadruple mass spectrometers achieve detection limits as low as 10 fmol (Hardison et al., 2006), sufficient for measuring AEA and 2-AG for a number of tissues. Additionally, GC-MS instrumentation typically costs less than comparable LC-MS. The initial experiments characterizing the presence of eCBs in biological tissues were performed using GC-MS techniques (Devane et al., 1992; Mechoulam et al., 1995). This work confirmed the presence of AEA in the porcine brain and 2-AG in the canine gut. Subsequent experiments employed GC-MS to confirm the presence of 2-AG in rat brain (Stella et al., 1997) and more recent methods have been developed for analysis of a broader range of eCBs and N-acyl-ethanolamines including 2-AG, palmitoyl (PEA), oleoyl (OEA) and stearoyl ethanolamide (Schmid et al., 1995; Giuffrida and Piomelli, 1998;Schmid et al., 2000).
The vast majority of tissue eCB analyses have been performed using LC-MS. These approaches provide on-column limits of detection in the fmol range without the necessity of chemical derivatization. Many laboratories have successfully utilized single quadrupole instruments run in selected ion monitoring (SIM) mode to measure eCBs; however, the increased selectivity afforded by tandem mass spectrometers has increased their popularity for eCB analysis. These instruments can select an ion of interest, fragment it and then monitor one of the fragmentation products. This process, known as multiple reaction monitoring (MRM), enhances sensitivity by dramatically reducing background noise from tissue samples and subsequently increasing the signal to noise ratio. Several ionization strategies have been employed for LC-MS including protonation, adduction of metal cations such as sodium or silver and coordination with an ammonium cation.
Sample extraction and purification
Preparation for tissue eCB analysis typically consists of sample homogenization in an organic solvent followed by a lipid extraction. The classic methods for extracting total lipid content from tissue samples were described in the late 1950s by Folch (Folch et al., 1957) and Bligh and Dyer (Bligh and Dyer, 1959), and these methods are still widely used today (Williams et al., 2007). However, the relative abundance of eCBs and related lipids in brain tissue is quite low compared with the content of other lipid species in extracted samples. High levels of these other matrix constituents can cause ion suppression and/or create an interfering signal in the MS that compromises quantification. Thus, despite the high degree of specificity afforded by GC-MS and LC-MS analyses, optimization of lipid extractions for eCBs is critical and it is often necessary to further purify the samples using solid phase extraction (SPE) or HPLC.
Several studies have optimized extraction conditions for eCBs. The Hillard group has developed one of the most straightforward approaches in which tissue is sonicated in acetonitrile followed by protein precipitation at –10°C for several hours in the same solvent resulting in suitably clean samples without need for additional purification (Patel et al., 2003; Patel et al., 2005). Other groups have determined that extractions employing ethyl acetate/hexane solutions or methanol are typically more efficient for eCB extraction as compared with chloroform/methanol solutions, and repeated solvent extractions have been found to be necessary to fully recover eCBs from brain tissue (Richardson et al., 2007; Tan et al., 2009). Subsequent SPE procedures can further purify samples to improve the specificity and sensitivity of the MS analysis. Chloroform/methanol mixtures are commonly used to elute eCBs from silica SPE columns; however, these mixtures often elute other lipid species along with the analytes of interest. Recently, Muccioli and Stella tested several solvent systems that effectively elute eCBs from silica and determined that ethyl acetate/acetone mixtures provide superior eCB purification from contaminants when compared with chloroform/methanol mixtures (Muccioli and Stella, 2008). Additionally, Richardson et al. observed that supplementation of TEA and TFA to the SPE solvents improves eCB recovery, and noted that the solvent used for sample reconstitution prior to LC-MS analysis also impacts eCB levels (Richardson et al., 2007). Alternate strategies have included reversed-phase SPE approaches (Bazinet et al., 2005; Bradshaw et al., 2006; Opitz et al., 2007) and polymyxin B resins (Wang et al., 2000; Wang et al., 2001) for eCB retention and sample cleanup. Sample purification can also be performed by HPLC fractionation (Kirkham et al., 2002), but this approach is typically not employed due to its laborious and time-consuming nature.
It is worth noting that some experimental conditions favour recovery of specific eCBs over others (Richardson et al., 2007; Muccioli and Stella, 2008). Moreover, exposure of brain extracts to either acidic or basic conditions can significantly enhance the appearance of AEA (Kempe et al., 1996; Yang et al., 1999), and silica-catalysed deuterium exchange from radiolabelled internal standards has been described that may result in substantial overestimations of endogenous eCB content (Hardison et al., 2006). Thus, although general procedures for lipid extraction have been employed for decades it is clear that a number of methodological factors have a large impact on the extraction and purification of eCBs from biological matrices, and this in turn can result in substantial variance in between-study estimates of tissue eCB content.
Post-mortem accumulation
One confound in tissue analyses is the potential for post-mortem eCB changes following killing of the experimental animal. An unavoidable delay exists between killing and the time when brain tissue of interest is ‘fixed’ by flash freezing. This post-mortem time ranges from seconds to minutes, depending on the tissue handling and dissection procedures required. Post-mortal ischemia following decapitation induces rapid increases in unesterified arachidonoyl lipid species, including ethanolamides (Cenedella et al., 1975; Marion and Wolfe, 1979;Natarajan et al., 1986). Indeed, robust post-mortem increases in brain eCB content have been reported in rat, mouse, sheep, cow and pig brain tissue, with significant AEA increases occurring steadily from 5 h onward (Schmid et al., 1995; Kempe et al., 1996; Maccarrone et al., 2001; Patel et al., 2005). Rapid post-mortem increases in rat brain tissue 2-AG content have also been observed, with a fivefold increase observed within 30 s of decapitation (Sugiura et al., 2001).
Although it has been suggested that the post-mortem increase in 2-AG occurs more rapidly than for AEA in rodent brain, this has not been conclusively established. Only one report simultaneously evaluated the effect of post-mortem interval on both AEA and 2-AG content in the same brain tissue samples (Patel et al., 2005). In this experiment, mouse brain AEA content substantially increased at post-mortem intervals >5 h, while brain 2-AG content was not altered at these times. The shortest post-mortem interval evaluated by Patel et al. was 30 min, and while a statistical comparison of changes in eCB content at this time was not reported, AEA levels appeared unchanged while 2-AG content was decreased. In comparison, Sugiura et al. reported a fivefold increase in rat brain 2-AG content that is evident 30–60 s after decapitation, with decreases from this elevated level apparent 2–5 min after euthanasia (Sugiura et al., 2001). Evaluations were not performed at times >5 min, and as such the duration of post-mortem elevations in brain 2-AG is not known. Experiments by Bazinet et al. suggest a comparable increase in rat brain AEA occurs during the first 5 min post-mortem (Bazinet et al., 2005). Here, anaesthetized rats were exposed to head-focused microwave irradiation to disable enzyme function, a well-established approach for limiting post-mortal biosynthesis of lipid species in rodent brain (Cenedella et al., 1975; Farias et al., 2008; Golovko and Murphy, 2008). In the study by Bazinet et al. brain AEA content was twofold to fivefold higher in tissue that was irradiated 5 min post-mortem compared with tissue irradiated just prior to decapitation, suggesting a rapid post-mortal AEA increase. However, the stability of eCBs and related compounds during microwave irradiation has not been evaluated, suggesting the necessity of further investigation of these changes.
Using tissue from a human brain obtained less than 1 h post-mortem, Felder et al. observed a progressive increase in AEA content in adjacent cerebellar samples left at room temperature for 2–24 h (Felder et al., 1996). Similarly, Palkovits et al. observed a progressive increase in AEA from microdissected brain regions removed 1–6 h after death and in neurosurgical samples subjected to 0–6 h intervals between their removal and freezing (Palkovits et al., 2008). Tissue AEA content increased up to sevenfold in select brain regions during this time, with increased levels in the neurosurgical samples generally occurring at >1 h. In sharp contrast, brain 2-AG content significantly declined within the first 1–2 h following death or surgical removal of tissue. It is unclear whether this represents a decline from a rapid (<1 min) increase in 2-AG formation that has been reported in the rodent literature (Sugiura et al., 2001).
Collectively these findings demonstrate that substantial changes in eCB content occur over time in the post-mortem brain. It is not known whether euthanasia itself alters brain eCB content, although it is anticipated that the means for killing would have a large influence on brain eCB content either through pharmacological interactions (anaesthesia overdose) or stress. Regardless, the findings reviewed above underscore the import of the post-mortem sample handling interval in analyses of brain tissue AEA and 2-AG content.
Endocannabinoid levels in naïve rat brain tissue
Numerous research groups have reported brain tissue levels of eCBs based on some combination of the strategies outlined above. Analyses of whole rat brain estimate 2-AG content to be approximately 1000-fold higher than AEA content (nmol·g−1 vs. pmol·g−1, respectively), although there is a fair degree of variance between studies in estimated levels of each eCB (see Table 1). Several studies suggest that eCB content varies across different brain regions, with threefold to fivefold differences in content reported in studies designed for regional comparisons. However, measures of eCB content in specific brain regions can vary by twofold to threefold in different reports from the same research group (Gonzalez et al., 2002a; 2004b;). Moreover, the pattern of regional differences in eCB content is not always consistent from one study to another. For example, 2-AG content has been estimated to be either sixfold higher (Vigano et al., 2003) or threefold lower (Gonzalez et al., 2004a) in hippocampus versus cerebellum.
Table 1.
Regional brain tissue eCB levels in experimentally naïve rats
| Region | AEA† (pmol·g−1) | 2-AG† (nmol·g−1) | Citations (n) | Footnote |
|---|---|---|---|---|
| Whole brain | 19 (11–28) | 12 (3–37) | 4 | 1 |
| Hindbrain (rhombencephalon) | ||||
| Brainstem | 52 (22–87) | 9 (2–14) | 4 | 2 |
| Cerebellum | 19 (8–35) | 9 (2–20) | 9 | 3 |
| Pons medulla | 13 | 21 | 1 | 4 |
| Medulla | 45 | 11 | 1 | 5 |
| RVM | 62 | 3 | 1 | 6 |
| Midbrain (mesencephalon) | 27 (11–47) | 12 (4–24) | 8 | 7 |
| Dorsal raphe | 57 (56–57) | 6 (6–6) | 2 | 8 |
| Periaqueductal grey | 43 (8–72) | 9 (2–21) | 3 | 9 |
| Ventral mesencephalom | 10 | 19 | 1 | 10 |
| Ventral tegmental area | 68 | 8 | 1 | 11 |
| Interbrain (diencephalon) | 16 (10–21) | 5 (2–8) | 4 | 12 |
| Hypothalamus | 24 (9–46) | 15 (3–30) | 8 | 13 |
| MB hypothalamus | 60 | 5 | 1 | 14 |
| Pituitary | 12 | 12 | 1 | 15 |
| Anterior pituitary | 50 | 11 | 1 | 16 |
| Thalamus | 20 (13–30) | 11 (6–18) | 4 | 17 |
| Cerebrum (telencephalon) | ||||
| Amygdala | 43 (25–53) | 13 (2–27) | 3 | 18 |
| Striatum | 41 (17–76) | 8 (1–18) | 10 | 19 |
| Caudate putamen | 42 (17–72) | 6 (1–14) | 6 | 20 |
| Nucleus accumbens | 31 (15–65) | 11 (2–23) | 4 | 21 |
| Globus pallidus | 87 (17–198) | 6 (1–11) | 3 | 22 |
| Substantia nigra | 35 (22–49) | 16 (12–19) | 2 | 23 |
| SNr | 214 | 1 | 1 | 24 |
| Cortex | 20 (13–39) | 10 (1–35) | 8 | 25 |
| Frontal cortex | 15 (5–25) | 17 (11–22) | 2 | 26 |
| Prefrontal cortex | 26 (17–38) | 7 (1–12) | 5 | 27 |
| mPFC | 29 | 5 | 1 | 28 |
| ACC | 25 | 3 | 1 | 29 |
| Entorhinal cortex | 55 | 12 | 1 | 30 |
| Occipital cortex | 17 | 19 | 1 | 31 |
| Hippocampus | 44 (12–84) | 10 (1–40) | 11 | 32 |
| Dorsal hippocampus | 47 | 7 | 1 | 33 |
| Ventral hippocampus | 51 | 11 | 1 | 34 |
| Limbic structures | 34 (21–54) | 8 (4–12) | 6 | 35 |
eCB levels in brain tissue from experimentally naïve rats expressed as average literature value, with the range in parenthesis. When necessary, some values were calculated by measurement of reported graphs.
(Bisogno et al., 1999; Di Marzo et al., 2000; Kirkham et al., 2002; Vigano et al., 2003; Gonzalez et al., 2004a; Cabranes et al., 2005; Bradshaw et al., 2006; Bortolato et al., 2007; Richardson et al., 2007);
(Bisogno et al., 1999; Gonzalez et al., 2002b; 2004a; Vigano et al., 2003; Cabranes et al., 2005; Bradshaw et al., 2006; Bortolato et al., 2007; Richardson et al., 2007);
(Gonzalez et al., 2000; Kirkham et al., 2002; Vigano et al., 2003; Patel et al., 2004; Bradshaw et al., 2006; Richardson et al., 2007; Rubio et al., 2007; Soria-Gomez et al., 2007);
(Stella et al., 1997; Bisogno et al., 1999; Di Marzo et al., 2000; Gonzalez et al., 2002b; Vigano et al., 2003; Valenti et al., 2004; Bradshaw et al., 2006; Hardison et al., 2006; Bortolato et al., 2007; Richardson et al., 2007);
(Ferrer et al., 2003; Gonzalez et al., 2004a; Cabranes et al., 2005; Rubio et al., 2007; Malinen et al., 2009; Seillier et al., 2009);
(Bisogno et al., 1999; Di Marzo et al., 2000; Ferrer et al., 2003; Vigano et al., 2003; Gonzalez et al., 2004a; Cabranes et al., 2005; Palazzo et al., 2006; Bortolato et al., 2007);
(Stella et al., 1997; Gonzalez et al., 2002b; Valenti et al., 2004; Rubio et al., 2007; Malinen et al., 2009);
(Bisogno et al., 1999; Di Marzo et al., 2000; Gonzalez et al., 2002b; 2004a; Vigano et al., 2003; Valenti et al., 2004; Cabranes et al., 2005; Bradshaw et al., 2006; Bortolato et al., 2007; Richardson et al., 2007; Malinen et al., 2009);
(Bisogno et al., 1999; Kirkham et al., 2002; Vigano et al., 2003; Gonzalez et al., 2004a; Cabranes et al., 2005; Bortolato et al., 2007).
2-AG, 2-arachidonoylglycerol; AEA, anandamide, N-arachidonoyl-ethanolamine; eCB, endocannabinoid.
Several factors likely contribute to the variability in brain tissue eCB estimates between studies. As reviewed above, the parameters for lipid extraction and purification can have a large impact of eCB recovery, as can the post-mortem handling of tissue prior to extraction. In addition, eCB estimates made by GC-MS may vary from estimates made by LC-MS as a result of the derivatization required for GC analyses. For example, N-acyl phosphatidylethanolamine (NAPE) is present in brain tissue in much greater levels than is AEA, and some derivatization approaches can produce a derivatized NAPE complex that is indistinguishable from derivatized AEA (Yang et al., 1999). Insufficient selectivity may also be problematic when using single quadrupole MS instruments, and this may underlie differences in eCB levels estimated by SIM versus MRM (LC-MS/MS) analyses. In addition to these sample handling and analytical issues, it is well known that stress, diet, gender and circadian cycle all have an impact on brain eCB content (Patel et al., 2004; Valenti et al., 2004; Hohmann et al., 2005; Bradshaw et al., 2006; Bortolato et al., 2007), and it is likely that strain differences in brain eCB content also exist. Thus, a number of factors likely contribute to the varying estimates of brain eCB content reported in the literature.
To provide a more comprehensive picture of regional differences in eCB levels, we compiled data from 30 publications in which both AEA and 2-AG were quantified in multiple brain regions of experimentally naïve rats. From these papers we identified six brain regions for which there are at least eight published estimates of AEA and 2-AG content: cerebellum, midbrain, hypothalamus, striatum, hippocampus and cortex (Figure 1). Each data point in this figure represents the average value of AEA and 2-AG content reported in an individual study derived from the analysis of tissue samples from 4–10 separate animals. The collective AEA and 2-AG levels were calculated for each brain region based on these studies, and the mean and standard error are represented as ovals in the scatter plot. Thus, the ovals representing each brain region are derived from at least 32 (often more than 80) separate tissue samples. As exemplified in Figure 1, a great deal of variability exists between studies in estimating regional AEA and 2-AG content, as would be anticipated based on the discussion above. Nonetheless, it is interesting that regional differences in AEA appear greater than those of 2-AG. For example, the hippocampus and striatum contain markedly higher AEA levels than the other four regions (cerebellum, cortex, hypothalamus and midbrain) or whole brain. In contrast, the 2-AG content does not differ substantially between the six regions, with the average measure of each region falling within from the estimate of whole brain. This suggests a comparatively greater regional variance in brain AEA content.
Figure 1.
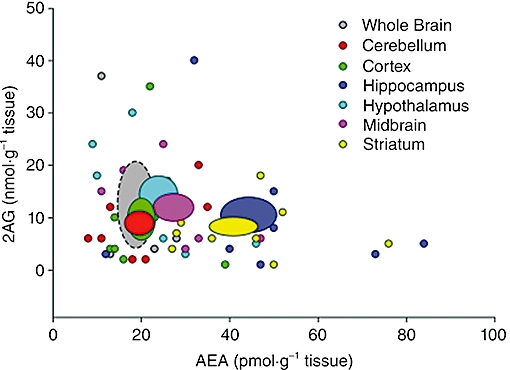
Comparison of published estimates of brain tissue endocannabinoid content in six brain regions of drug-naïve rats. Data are compiled from 30 publications in which both AEA (anandamide, N-arachidonoyl-ethanolamine) and 2-arachidonoylglycerol (2-AG) were quantified in tissue samples from multiple brain regions, as well as whole brain for comparison. Each small data point represents the average value of AEA and 2-AG content reported in an individual study, with average values from at least eight publications presented for each brain region. The mean and standard error of the collective AEA and 2-AG measures are represented as large ovals.
Overall, the variability in quantitative measures of brain tissue eCB levels highlights the difficulty in assigning ‘hard’ numbers as definitions of eCB content. Certainly the unambiguous identification of AEA, 2-AG and other related lipids in brain tissue has been of great importance, and the comparison of relative levels of different eCB moieties and possible regional differences in their expression has provided insight into the neurobiology eCB signalling. However, for the reasons discussed above it is appropriate to be cautious when considering quantitative measures of tissue eCB levels, particularly measures obtained in separate experiments. In this context, quantitative assessment of relative changes in tissue eCB content can be highly informative. However, the assessment of relative change requires inclusion of control subjects in each experiment, with identical sample processing for both the experimental and control groups. This comparative approach allows reliance on the considerable precision of mass spectrometric techniques while reducing the influence of the somewhat more limited accuracy associated with the analysis of total tissue eCB content. As described below, this approach has been used to evaluate alterations in brain eCB content resulting from eCB clearance inhibition or in the context of animal models of disease.
Effect of eCB biosynthesis and clearance inhibition on brain eCB content
Endogenous cannabinoid levels in brain appear to be tightly controlled by enzymatic biosynthesis and degradation in vivo. A number of different pathways have been implicated in ethanolamine formation, but the specific enzymes responsible for AEA biosynthesis have not been conclusively identified. To date, three main enzymatic routes for AEA formation from NAPE have been characterized: (i) hydrolysis by a NAPE-specific phospholipase D (NAPE-PLD); (ii) sequential phospholipase A/B activity of ABHD4, followed by a metal-dependent phosphodiesterase; and (iii) sequential phospholipase C (PLC) and phosphatase activity. 2-AG formation has been primarily attributed to diacylglycerol lipase (DAGL) activity on diacylglycerol. Two DAGL genes, DAGLα and DAGLβ, have been identified and shown to generate monoacylglycerols; however, a number of studies specifically implicated DAGLα as the enzyme responsible for 2-AG biosynthesis in vivo. Because each lipid signalling molecule may be generated via multiple pathways the development of biosynthetic inhibitors has been a substantial challenge and presently there are no reasonably selective inhibitors of eCB biosynthesis. Some compounds such as tetrahydrolipstatin (THL, also named Orlistat) and RHC80267 can inhibit DAGLα and effectively reduce 2-AG synthesis in cell culture systems (Bisogno et al., 2003; 2006;). However, in addition to their effects on DAGLα these compounds also inhibit a number of other serine hydrolases (Hoover et al., 2008), and therefore do not exhibit sufficient selectivity for studies employing systemic administration.
The hydrolytic clearance of AEA is principally done by fatty acid amide hydrolase (FAAH), whereas the hydrolytic clearance of 2-AG appears to be primarily mediated by monoacylglycerol lipase (MAGL) (Cravatt et al., 1996; Lambert and Fowler, 2005;Blankman et al., 2007). Inhibition of these clearance mechanisms produces dramatic increases in brain tissue eCB content and a variety of cannabinoid receptor-dependent behavioural phenotypes (Kathuria et al., 2003; Lichtman et al., 2004b; Long et al., 2009). A number of research groups have developed small molecules targeting FAAH; of these molecules, URB597 has been the most studied. Administration of URB597 (0.3 mg·kg−1, i.p.) reduces FAAH activity by over 90% and produces a twofold to fourfold increase in rat and mouse brain AEA content without altering tissue levels of 2-AG (Kathuria et al., 2003; Fegley et al., 2005; Gobbi et al., 2005; Bortolato et al., 2006). URB597-induced increases in AEA content have been observed in multiple brain regions, although the magnitude of the effect appears to differ between regions (Gobbi et al., 2005; Bortolato et al., 2007). Other reportedly more selective FAAH inhibitors, such as OL-135 (Lichtman et al., 2004a) and JNJ-1661010 (Karbarz et al., 2009) increase brain AEA levels to a similar degree as URB597, however, the recently developed FAAH inhibitor PF-3845 causes a more than 10-fold increase in mouse brain AEA content at doses that do no alter brain 2-AG content (Ahn et al., 2009). FAAH (−/−) mice display 50–100-fold reductions in AEA hydrolysis and greater than 10-fold elevations in brain levels of many fatty acid amides including AEA, with no concurrent alteration in brain 2-AG levels (Cravatt et al., 2001; Fegley et al., 2005; Osei-Hyiaman et al., 2005).
Preliminary work evaluating the effect of MAGL inhibition was performed using URB602. Although its low potency limits the use of this inhibitor systemically (Hohmann et al., 2005), when administered regionally by microinjection (Hohmann et al., 2005) or used ex vivo on rat brain slices (King et al., 2007) URB602 selectively raises 2-AG levels. Recently, JZL184 has been developed as a potent and selective inhibitor of MAGL (Long et al., 2009). Systemic administration of JZL184 (4–40 mg·kg−1, i.p.) results in greater than 10-fold increase in 2-AG in the mouse brain, without any significant effects on AEA below 40 mg·kg−1. While JZL184 (16 mg·kg−1, i.p.) increases 2-AG levels in a number of organs, the magnitude of 2-AG changes varies significantly between these tissues (Long et al., 2009). Simultaneous inhibition of FAAH and MAGL, by either combined treatment with PF-3845 and JZL184 or using the dual inhibitor JZL195, raises both AEA and 2-AG in the brain (Long et al., 2009). Interestingly, this work determined that dual inhibition, but neither FAAH nor MAGL alone, produced THC-like responses, and suggest that both eCBs play an important role in CB1 signalling in vivo.
Sampling of brain eCBs by in vivo microdialysis
In vivo brain microdialysis has received widespread application as a neurochemical sampling technique since its development in the early 1970s. The idea of microdialysis is to mimic the passive function of a capillary blood vessel by implanting a small semi-permeable dialysis membrane in tissue and perfusing the sealed system with an artificial CSF solution. Molecules present in the extracellular space surrounding the membrane diffuse into the probe as a result of the concentration gradient, and the dialysate concentration of these substances can subsequently be quantified. There are many benefits afforded by microdialysis sampling. The closed nature of the probe results in minimal tissue disturbance during sample collection (i.e. once post-implantation equilibrium of the tissue is established), and the membrane acts as a filter against large molecules thereby minimizing enzymatic degradation of sample constituents and reducing the need for sample cleanup prior to analysis. Analytes are collected from the extracellular space and as such dialysate concentrations of neuroactive substances may provide a better index of ‘signalling competent’ levels than is provided by whole tissue analyses. Microdialysis allows sampling from discrete brain regions, and experiments are typically performed in conscious, freely moving animals. Because samples may be collected for several hours it is possible to temporally correlate changes in dialysate analyte concentration with specific behavioural or pharmacological events.
Most brain microdialysis studies focus on small, polar neurotransmitters such as the monoamines, acetylcholine and neuroactive amino acids that readily diffuse into the dialysis probe from the extracellular space. However, the aqueous environment within the dialysis probe minimizes diffusion of lipophilic eCBs, resulting in very low collection efficiencies and subsequent eCB concentrations. This obstacle has prevented broad application of microdialysis to the analysis of extracellular eCBs. However, several advances in this technique have been made to allow reliable detection of several eCBs in microdialysates collected from rodent brain. The following sections will review several important factors affecting the sampling of extracellular eCBs.
Factors influencing microdialysis recovery of eCBs
Perfusate flowrate
In general, the absolute recovery of an analyte (e.g. the mass of analyte collected per unit time) is directly proportional to the perfusate flow rate (Wages et al., 1986). Based on this relationship the first report of eCB microdialysis in rodent brain employed a fast perfusate flowrate (10 µL·min−1) and long collection intervals (30 min) as a means for maximizing eCB recovery (Giuffrida et al., 1999). Under these conditions baseline dialysate AEA, PEA and OEA levels were quantifiable by GC-MS (0.7–1.5 pmol per sample), although levels dropped below the limits of quantitation when slower perfusate flow rates or shorter collection intervals were employed. Although this work demonstrated the utility of maximizing eCB collection using fast perfusate flowrates it is worth noting that disturbance of extracellular equilibrium is positively correlated with perfusate flowrate (Dykstra et al., 1992). As such, fast flow rates cause greater neurochemical disruptions in a larger volume of tissue than do slower flow rates. It is advisable to minimize the perfusate flowrate, ideally to <1 µL·min−1 if possible. However, this results in very small sample volumes (typically <10 µL) that place substantial strain on the analytical method.
Membrane composition
Microdialysis probes are available with a wide variety of semi-permeable membranes including regenerated cellulose, polyacrylonitrile, polycarbonate, polysulfone and cuprophan. Membranes made of these materials can differ in wall thickness, pore geometry and electrostatic charge, and these factors can exert large effects on analyte recovery (Maidment and Evans, 1991). Among these types of membrane materials we and others have found that polyethylsulfone (PES) provides the highest in vitro recovery and best temporal correlation between dialysate eCB content and changes in external eCB concentration, possibly due to reduced eCB adsorption to this type of membrane as has been observed by others (Bequet et al., 2007). Each type of membrane is typically available with various molecular weight cut-off ratings ranging from 6–40 kDa. Because all presently identified eCBs and related lipids are relatively small (<1 kDa) it is anticipated that any of these ratings would be suitable for eCB sampling. However, as discussed in a later section it is possible that eCBs associate with carrier proteins or other ‘chaperone’ moieties in the brain interstitial space and the sampling efficiency of these complexes may be poor with low molecular weight cut-off membranes. However, caution is warranted in the use of high cut-off membranes that are prone to ultrafiltration (e.g. physical passage of the aCSF perfusate across the membrane) as this process can compromise analyte sampling efficiency. Indeed, we find the in vitro eCB sampling efficiency of 35 kDa PES membranes is approximately 50% less than that obtained with 15 kDa PES membranes, and this relative difference in sampling efficiency is sensitive to the perfusate flow rate (e.g. internal probe pressure), suggesting the reduced efficiency of the 35 kDa membrane is related to ultrafiltration. In addition to adversely affecting sampling efficiency, ultrafiltration can induce physical disruption of the tissue adjacent to the probe membrane.
Perfusate composition
Another factor strongly influencing eCB collection by microdialysis is the poor solubility of lipid eCBs in the polar perfusate within the probe, and this severely limits the microdialysis recovery of eCBs. One approach for increasing eCB recovery is the inclusion of β-cyclodextrin (β-CD) in the perfusate (Walker et al., 1999). Cyclodextrins possess a hydrophilic outer surface and hydrophobic central cavity that is able to form inclusion complexes with non-polar molecules (Schneiderman and Stalcup, 2000) that greatly improve the aqueous solubility of hydrophobic moieties (Uekama et al., 1998). In addition, eCB–β-CD complexes effectively lower the concentration of free eCB at the inner membrane surface, thereby creating a greater concentration gradient into the probe and increasing eCB recovery through ‘facilitated diffusion’ (Khramov and Stenken, 1999). Perfusate β-CD may also reduce eCB adsorption to the probe membrane and tubing materials (Bequet et al., 2007). As a result of these effects, perfusate β-CDs produce a more than 10-fold increase in the sampling efficiency of eCBs (Walker et al., 1999) greatly facilitating the quantification of these analytes from in vivo microdialysis samples. Accordingly, most in vivo eCB microdialysis studies have employed perfusate β-CD (Walker et al., 1999; Bequet et al., 2007; Caille et al., 2007; Ferrer et al., 2007; Alvarez-Jaimes et al., 2009a,b; Long et al., 2009; Orio et al., 2009; Villanueva et al., 2009).
One caveat with the use of perfusate β-CD is the possible delivery of the β-CD to the tissue immediately surrounding the dialysis probe. Although CDs themselves are not toxic and have been widely used in pharmaceutical and food preparations (Uekama et al., 1998), these compounds can extract cholesterol from plasma membranes (Ohvo and Slotte, 1996) resulting in a disruption of lipid raft integrity (Ohvo and Slotte, 1996; Bari et al., 2005; Maccarrone et al., 2009). Because this may increase 2-AG synthesis it is conceivable that inclusion of β-CD in microdialysis perfusates results in artificially high interstitial 2-AG levels. However, several observations suggest that this is not the case under standard microdialysis conditions.
First, most studies of lipid raft integrity employ methyl-β-cyclodextrin (MCD) for extraction of membrane cholesterol (Bari et al., 2005; Maccarrone et al., 2009) as the methylated form is efficacious for cholesterol extraction (Klein et al., 1995; Rodal et al., 1999). In contrast, microdialysis studies utilize hydroxy-propyl-β-CD (HP-β-CD) and this form is much less efficacious at extracting membrane cholesterol (Klein et al., 1995; Abulrob et al., 2005). Second, the efficiency of CD delivery via reverse dialysis is likely less than 2% under conditions employed in most studies (Khramov and Stenken, 1999). Thus, despite the use relatively high perfusate HP-β-CD concentrations (1–20 mM) the HP-β-CD concentration at the outer surface of the dialysis membrane is likely substantially less than that employed for cholesterol extraction in in vitro brain slices (Maccarrone et al., 2009). Moreover, the HP-β-CD concentration likely drops precipitously at short distances from the dialysis membrane (Dykstra et al., 1992). Third, were HP-β-CD delivery from the dialysis probe sufficient to disrupt lipid raft integrity, the concentration-dependent enhancement on eCB recovery in dialysate would likely differ between in vitro and in vivo experiments. However, as shown in Figure 2 dialysate eCB levels are relatively constant with perfusate HP-β-CD concentrations ranging from 10–30% regardless of whether the dialysis collections are performed from an in vitro eCB solution or rat brain tissue. Lastly, given the important influence of CB1 receptors on amino acid and monoamine release in the nucleus accumbens (Hoffman and Lupica, 2001;Schoffelmeer et al., 2006; Sperlagh et al., 2009) it would be expected that an HP-β-CD-induced alteration in interstitial eCB levels would affect dialysate levels of these neurotransmitters collected in vivo. However, in vivo dialysate levels of gamma aminobutyric acid (GABA), glutamate, dopamine and serotonin are unaltered by perfusion with an HP-β-CD solution (L.H. Parsons et al., unpubl. obs.). Collectively these findings suggest that HP-β-CD-induced enhancement of dialysate eCB content observed in vivo results from increased eCB collection efficiency and not from an artificial stimulation of eCB formation induced by compromised lipid raft integrity.
Figure 2.
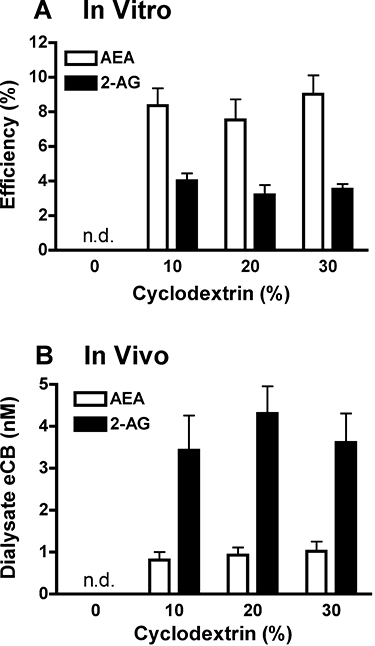
Effect of perfusate hydroxy-propyl-β-cyclodextrin (HP-β-CD) content on dialysate endocannabinoid (eCB) levels. (A) Evaluation of in vitro eCB sampling efficiency. Dialysis probes (n= 6) were suspended in a medium containing 200 nM AEA (anandamide, N-arachidonoyl-ethanolamine) and 2-arachidonoylglycerol (2-AG), and dialysates were collected with aCSF perfusates containing 0–30% HP-β-CD. (B) Effect of perfusate HP-β-CD (0–30%) on eCB content in dialysates collected from the rat nucleus accumbens (n= 6). In both experiments dialysate AEA and 2-AG levels were below limits of quantification (n.d.) in samples collected without perfusate HP-β-CD. Inclusion of 10% HP-β-CD in the perfusate significantly enhanced dialysate eCB recovery, and higher HP-β-CD perfusate levels did not further improve dialysate eCB content collected either in vitro or in vivo.
Cellular reactions to dialysis probe implantation
The tissue damage caused by microdialysis probe implantation causes a massive transient increase in the extracellular concentration of neurotransmitters and other intracellular neurochemicals, and a period of time must elapse before a post-implantation extracellular equilibrium is established. Although some studies indicate that the blood–brain barrier integrity is unaffected by dialysis probe implantation (Tossman and Ungerstedt, 1986;Benveniste et al., 1987; Hascup et al., 2009), other reports describe a transient opening of the BBB that is ameliorated a few hours after probe implantation (Dykstra et al., 1992). For these reasons collection of brain microdialysis samples typically does not commence until several hours (>6 h) after probe implantation.
However, as the post-implantation time progresses the magnitude of various tissue reactions to the probe increases. Early studies described minimal tissue changes within 1–2 days following implantation, although areas of oedema and astrocyte hypertrophy were evident 3 days post implantation and a growing presence of connective tissue (collagen) were observed near the probe tract 14–60 days post implantation (Benveniste and Diemer, 1987). More recent studies have shown that astrocyte density is unaltered within the first 24 h, but progressively increases 3–7 days after probe implantation (Hascup et al., 2009). Post-implantation changes in microglial density follow the same pattern (Grabb et al., 1998; Hascup et al., 2009) with microglial cytokine production near the dialysis probe tract progressively increasing 48 h after probe implantation (Woodroofe et al., 1991). Although light and electron microscopy show evidence of gliosis, oedema, axonal damage and neuronal degeneration up to 400 µm from the probe 40 h after implantation, these effects are not observed in the first 24 h (Clapp-Lilly et al., 1999). The relative magnitude and time course of these tissue disruptions may be dependent on the type of membrane material that is implanted (Collias and Manuelidis, 1957;Stensas and Stensas, 1976;Benveniste and Diemer, 1987).
Overall these findings suggest a somewhat limited time window for optimal sampling of interstitial eCBs by microdialysis. Increased eCB formation following brain tissue trauma is well documented (Panikashvili et al., 2001; Mechoulam et al., 2002; Mechoulam and Shohami, 2007), and while most of this evidence was gathered using models of closed head injury it is likely that tissue trauma induced by probe implantation also results in acute increases in eCB production. Indeed, dialysate AEA and 2-AG levels are relatively high immediately following probe implantation and decrease to stable equilibrated levels within 2–3 h post implantation (L.H. Parsons, unpubl. obs.). In contrast, at longer post-implantation (>24 h) times dialysate eCB levels may be progressively influenced by an increased presence of astrocytes and microglia (Walter et al., 2004; Witting et al., 2004). Accordingly, it is generally recommended that brain eCBs should be sampled 6–24 h after microdialysis probe implantation.
Relationship between dialysate and extracellular eCB concentrations
Within the CNS eCB signalling appears to occur in a retrograde manner with post-synaptically derived eCBs traversing the extracellular space to interact with CB1 receptors on the presynaptic terminal. The best lines of evidence supporting this action are eCB-dependent long-term synaptic depression (eLTD) and eCB-dependent depolarization-induced suppression of inhibition or excitation (DSI and DSE respectively) (Alger, 2002; Wilson and Nicoll, 2002;Gerdeman and Lovinger, 2003;Heifets and Castillo, 2009). However, it has been unclear how lipophilic eCBs overcome the diffusional barrier of the aqueous extracellular fluid to move from the post-synaptic site of synthesis to the presynaptic membrane for signalling.
Several mechanisms for trans-synaptic eCB transport have been theorized. For example, eCBs could incorporate into exosomes (microvesicles of endosomal origin) that neurons actively secrete into the extracellular space upon stimulation (Faure et al., 2006). Exosomes mirror the composition of lipid rafts, containing high levels of cholesterol, flotillin-1 and glycosylphosphatidylinositol-anchored proteins (de Gassart et al., 2003; Wubbolts et al., 2003); thus, exosomes potentially involved in eCB transport could originate directly from lipid rafts. An alternative mechanism involves eCB binding to carrier proteins that facilitate eCB diffusion between cells (Bojesen and Hansen, 2003;Makriyannis et al., 2005a,b;). Although no extracellular binding protein for eCBs has been identified, it is known that eCBs can bind to bovine serum albumin with nanomolar affinity (Bojesen and Hansen, 2003) and to fatty acid binding proteins (FABPs) present in brain (e.g. FABP5 and FABP7). These FABPs have recently been shown to facilitate intracellular AEA diffusion through aqueous cytosol (Kaczocha et al., 2009), although it is unknown whether these or similar FABPs are present in the extracellular space.
The possibility of these types of ‘chaperone’ mechanisms for intercellular eCB transport has substantial implications for microdialysis eCB measures as it is likely that eCB–chaperone complexes are sufficiently large to limit diffusion across a microdialysis membrane. Accordingly, the in vivo eCB sampling efficiency may be considerably lower than estimates obtained in vitro[which are typically <10%; (Giuffrida et al., 1999; Walker et al., 1999; Bequet et al., 2007)]. As such, interstitial eCB concentrations are likely much higher than might be predicted from eCB levels quantified in brain microdialysates, although the exact relationship between dialysate and extracellular levels is not known. Based on these considerations, however, it is clearly inappropriate to utilize in vitro recovery conversions for estimation of extracellular eCB concentrations.
Endocannabinoid signalling may also occur through autocrine mechanisms. CB1 receptors appear to be localized within lipid rafts (Bari et al., 2005; Maccarrone et al., 2009) along with biosynthetic enzymes for AEA and 2-AG, and AEA and 2-AG molecules themselves (Rimmerman et al., 2008; Maccarrone et al., 2009). Based on this co-localization it is possible that AEA and 2-AG interact with CB1 receptors through lateral movement within lipid rafts. A physiological example of this action is self-induced slow long-lasting inhibition (SSI) observed in cortical interneurons and pyramidal cells following a burst of action potentials (Bacci et al., 2004; Marinelli et al., 2008; 2009;). This form of eCB signalling would occur without eCB transfer through the extracellular space, and as such would not be accounted for by microdialysis measures.
Analytical considerations
There is no need to subject microdialysates to extraction procedures prior to LC-MS analysis because dialysates do not contain particulates or tissue matter. However, dialysate samples contain high concentrations of salts and β-CD that both cause ion suppression and reduce MS sensitivity. Accordingly, samples should be ‘cleaned’ prior to MS analysis by a reverse phase SPE, performed either offline using disposable columns or online using an automated SPE, prior to LC separation. For automated SPE, dialysate samples are first injected onto a reversed-phase pre-column equilibrated with a low organic mobile phase to retain lipophilic eCBs while eluting salts and β-CD to waste; following sample cleanup, increased organic content in the mobile phase delivers the eCBs to the analytical column for separation and ultimate elution to the MS analyser.
Brain dialysate samples contain very low eCB concentrations, typically in the low nanomolar range. Moreover, flowrate constraints and the need for reasonable sampling intervals result in quite small sample volumes (5–30 µL). Accordingly the total amount of eCB delivered to an LC-MS system is typically in the attomole to femtomole range. Dialysate analyses therefore require careful optimization of the analytical method to obtain maximal sensitivity. Downscaling of the LC dimensions (Legido-Quigley et al., 2002; Roy et al., 2003) and miniaturization of the ESI process using micro- or nanospray substantially improves the limit of detection by enhancing ionization efficiency (Oosterkamp et al., 1998; Roy et al., 2003), resulting in fivefold to 50-fold improvements in sensitivity (Lanckmans et al., 2006). Additional sensitivity can be gained through the optimization of the m/z used for SIM of each analyte, and this is best performed for each mass spectrometer used to account for between-instrument differences in ion focusing. Similar optimization of the parameters used for MRM analysis by LC-MS/MS can provide even greater sensitivity by reducing background noise and increasing selectivity (Baseski et al., 2005).
Temporal resolution
The eCB content in an individual dialysate sample reflects the average extracellular eCB level near the probe over the collection period. Brief, transient eCB changes can thus be diluted over the course of the sampling period and thus the sampling interval should be minimized. Unfortunately, low dialysate eCB concentrations often necessitate relatively long collection times to provide sufficient eCB mass for detection. Published limits of quantitation for microdialysate AEA and 2-AG range from 50–440 amol for LC-MS analyses employing SIM (Walker et al., 1999; Caille et al., 2007; Ferrer et al., 2007; Alvarez-Jaimes et al., 2009a,b; Long et al., 2009; Orio et al., 2009; Villanueva et al., 2009) and 30–300 amol for LC-MS/MS measures using MRM (Bequet et al., 2007). Baseline dialysate levels from these reports range from 18–123 amol·µL−1 for AEA and 106–657 amol·µL−1for 2-AG. Thus, several minutes of sample collection are typically required to provide sufficient analyte for detection (10–30 min collections in the references cited above). Although future technical improvements in microdialysis and analytical instrumentation are anticipated, sub-minute temporal resolution is unlikely using this technique. This highlights a general shortcoming of microdialysis when compared with other neurochemical approaches such as voltammetric analyses or electrophysiological recordings of cell activity.
Implications of factors influencing eCB recovery by microdialysis
As described above the eCB sampling efficiency by microdialysis is quite low and the eCB concentrations in brain microdialysates are influenced by a number of factors including the perfusate flowrate, size and composition of the dialysis membrane and the composition of the perfusion fluid. These factors must be considered when interpreting or comparing microdialysis data across literature reports. More importantly, while microdialysates provide a viable index of eCB levels in the brain interstitial space, the exact relationship between dialysate and extracellular eCB concentrations is not known (although interstitial eCB levels are likely to be much higher than levels quantified in dialysates). Thus, microdialysis is likely not a viable means for obtaining quantitative estimates of brain eCB content. Rather, microdialysis provides a reasonable approach for evaluating relative changes in interstitial eCB content, particularly for the temporal profiling of eCB content related to pharmacological or behavioural manipulations.
Applications of in vivo brain eCB microdialysis
Baseline dialysate eCB content
At the present time there are nine published reports of in vivo brain microdialysis in rats (Giuffrida et al., 1999; Walker et al., 1999; Bequet et al., 2007; Caille et al., 2007; Ferrer et al., 2007; Alvarez-Jaimes et al., 2009a,b; Orio et al., 2009; Villanueva et al., 2009), one report of dialysis in mice (Long et al., 2009) and one report of dialysis eCB measures in humans (Schabitz et al., 2002). The rat studies were performed by four independent research groups, each using slight methodological variations for collection and analysis and each targeting different brain regions. Despite these methodological differences, baseline dialysate eCB levels are remarkably consistent across studies, with both AEA and 2-AG levels in the low nanomolar range (see Table 2).
Table 2.
Summary of in vivo microdialysis publications
| Reference | Membrane (type/cut-off/length) | Flowrate; sampling interval | Species | Region | Method | AEA= | 2-AG= | 2-AG/AEA< |
|---|---|---|---|---|---|---|---|---|
| Giuffrida et al. (1999) | PC, 20 kDa, 4 mm | 10 µL·min−1; 30 min | Rat | DStr | GC-MS | 5 nM per 1.5 pmol | Not determined | – |
| Walker et al. (1999) | RC, 40 kDa, 2 mm | 1 µL·min−1; 15–30 min | Rat | PAG | LC-MS | 0.19 nM per 2.8 fmol | Not determined | – |
| Caille et al. (2007) | PES, 15 kDa, 2 mm | 0.6 µL·min−1; 10 min | Rat | NAcc | LC-MS | 2.2 nM per 0.44 fmol | 5.3 nM per 1.1 fmol | 2.4 |
| Ferrer et al. (2007) | PES, 15 kDa, 2 mm | 0.6 µL·min−1; 10 min | Rat | NAcc | LC-MS | 2.0 nM per 0.40 fmol | Not determined | – |
| Bequet et al. (2007) | PES, 6 kDa, 2 mm | 1 µL·min−1; 30 min | Rat | HTh | LC-MS/MS | 0.12 nM per 3.7 fmol | 0.66 nM per 19.7 fmol | 5.5 |
| Alvarez-Jaimes et al. (2009b) | PES, 15 kDa, 2 mm | 0.6 µL·min−1; 10 min | Rat | NAcc | LC-MS | 2.8 nM per 0.56 fmol | 5.6 nM per 1.1 fmol | 2.0 |
| Alvarez-Jaimes et al. (2009a) | PES, 15 kDa, 3 mm | 0.6 µL·min−1; 10 min | Rat | PFC | LC-MS | 1.4 nM per 0.28 fmol | 8.5 nM per 1.7 fmol | 6.1 |
| Orio et al. (2009) | PES, 15 kDa, 2 mm | 0.6 µL·min−1; 10 min | Rat | NAcc | LC-MS | 2.3 nM per 0.46 fmol | 10.3 nM per 2.1 fmol | 4.5 |
| Villanueva et al. (2009) | PES, 15 kDa, 1 mm | 0.6 µL·min−1; 10 min | Rat | POA | LC-MS | 1.0 nM per 0.2 fmol | 3.2 nM per 0.64 fmol | 3.2 |
| Long et al. (2009) | PES, 15 kDa, 1 mm | 0.6 µL·min−1; 10 min | Mouse | NAcc | LC-MS | 0.56 nM per 0.11 fmol | 4.4 nM per 0.88 fmol | 7.9 |
Dialysate eCB content listed as concentration (nM) and amount per sample (pmol or fmol).
Ratio of 2-AG to AEA concentration in the dialysate sample.
Membrane: PC, polycarbonate; RC, regenerated cellulose; PES, polyethylsulfone.
Region: DStr, dorsal striatum; PAG, periaqueductal grey; NAcc, nucleus accumbens; HTh, hypothalamus; PFC, prefrontal cortex; POA, preoptic area of the thalamus.
2-AG, 2-arachidonoylglycerol; AEA, anandamide, N-arachidonoyl-ethanolamine; eCB, endocannabinoid; GC-MS, gas chromatography – mass spectrometry; LC-MS, liquid chromatography – mass spectrometry.
Lipid extracts of rat whole brain estimate 2-AG content to be approximately 1000-fold higher than AEA (nmol·g−1 vs. pmol·g−1, respectively; see Table 1). However, microdialysate 2-AG levels are less than 10-fold higher than AEA in several different brain structures (Bequet et al., 2007; Caille et al., 2007; Alvarez-Jaimes et al., 2009a,b;). Although the microdialysis sampling efficiency for 2-AG is lower than that for AEA (see Figure 2), this is likely insufficient to account for the large discrepancy in 2-AG/AEA ratio between dialysis and tissue measures. Alternatively, it is possible that a relatively large proportion of the tissue 2-AG content is not accessible for microdialysis sampling due to associations with binding proteins, lipid rafts (Rimmerman et al., 2008; Maccarrone et al., 2009) or intracellular localization. While such associations might preclude 2-AG sampling by microdialysis, these distinct ‘pools’ of 2-AG would be fully accounted for in extractions from bulk tissue. However, this scenario would require a preferential partitioning of 2-AG versus AEA into these inaccessible ‘pools’ and there is limited data to support this hypothesis (Rimmerman et al., 2008). More evidence suggests that post-mortal mechanisms increase 2-AG much more rapidly (<1 min) than AEA (>5 h) (Sugiura et al., 2001; Patel et al., 2005), and this may help explain why 2-AG/AEA ratio measured bulk tissue are much higher than in vivo microdialysates.
To investigate this possibility we characterized the effect of euthanasia on dialysate eCB levels. A group of six experimentally naïve rats were each implanted with a unilateral microdialysis probe into the nucleus accumbens following previously described methods (Caille et al., 2007; Ferrer et al., 2007; Alvarez-Jaimes et al., 2009b). Baseline dialysates were collected for 90 min during which time the animal was undisturbed in their homecage. Baseline AEA and 2-AG levels were 1.0 ± 0.2 and 4.7 ± 0.9 nM respectively. Subsequently the animals were killed by filling the homecage with CO2 vapour. Death was achieved within 1 min of CO2 delivery, and this approach did not require any animal handling or disturbance. As shown in Figure 3 dialysate 2-AG levels were significantly increased by 200% within the first 10 min of death, and reached a stable plateau of approximately 600% of baseline for the subsequent 40 min of sampling. In contrast, there was a subtle decrease in dialysate AEA levels within the first 20 min post-mortem with a subsequent return to baseline levels for the remaining period of collection. These data are consistent with previous evidence for a rapid post-mortem increase in brain 2-AG content (Sugiura et al., 2001), although the duration of this increase differs from previous evidence of relative decreases in brain 2-AG 30 min post-mortem (Patel et al., 2005). While further studies are warranted, these findings suggest that selective post-mortem increases in 2-AG contribute to the much higher 2-AG/AEA ratio observed in bulk brain tissue extracts versus in vivo microdialysates.
Figure 3.
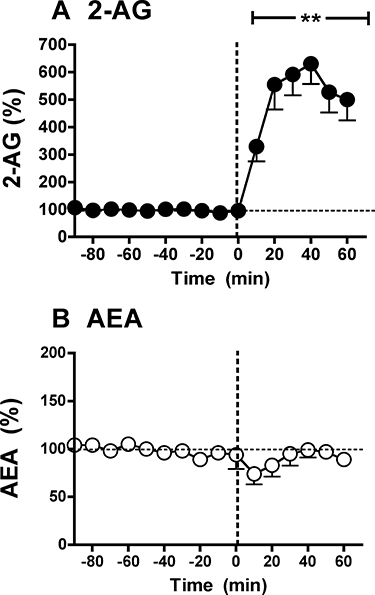
Effect of euthanasia on in vivo microdialysate endocannabinoid levels. Microdialysis samples were collected from the nucleus accumbens of naïve Wistar rats (n= 6) at 10 min intervals starting 90 min prior to euthanasia by CO2 narcosis (induced at time zero) until 60 min post-mortem. (A) Dialysate 2-arachidonoylglycerol (2-AG) levels were stable over the 90 min pre-euthanasia baseline period (repeated measures anova, F5,45= 0.578, not significant), but were significantly increased during the 60 min post-mortem sampling period (F5,30= 32.635, P < 0.0001). (B) AEA (anandamide, N-arachidonoyl-ethanolamine) levels measured in these same samples were also stable during the baseline period (F5,45= 1.824, not significant) and were not significantly altered during the 60 min post-mortem period (F5,30= 1.367, not significant). The double asterisks denote P < 0.01 versus pre-euthanasia baseline at individual post-mortem time points as determined by Fisher's post hoc comparisons following anova. See text for additional details.
Effect of neuronal depolarization on dialysate eCB content
AEA and 2-AG are believed to be synthesized on an ‘as needed’ basis and are released from neurons in a nonvesicular manner in response to depolarization-induced elevations in Ca2+ (Di Marzo et al., 1994; Cadas et al., 1996; Di Marzo et al., 1996; Stella et al., 1997; Stella and Piomelli, 2001). To test whether eCB release is enhanced by increased neuronal activity, two microdialysis studies have evaluated the effect of neuronal depolarization on dialysate eCB levels (Giuffrida et al., 1999; Bequet et al., 2007). Giuffrida et al. observed that localized perfusion with an aCSF solution containing 60 mM KCl significantly increased AEA content in dialysates collected from the rat dorsal striatum without a concomitant increase in dialysate 2-AG levels. The effect of high K+ on dialysate AEA levels was prevented by co-perfusion with the Na+-channel blocker tetrodotoxin (TTX) and by removal of perfusate Ca2+ ions (Giuffrida et al., 1999) confirming that the observed increase in dialysate AEA resulted from enhanced neuronal activity. Bequet et al. observed subtle increases in dialysate AEA and 2-AG during perfusion of the anterior hypothalamus with 60 mM KCl, with more robust increases in both eCBs during perfusion with 90 mM KCl (Giuffrida et al., 1999; Bequet et al., 2007). Substantially greater increases in dialysate AEA and 2-AG levels were observed when a combination of high K+ and high Ca2+ was employed (Bequet et al., 2007), consistent with similar effects observed in vitro (Di et al., 2005; Ohno-Shosaku et al., 2005). In contrast to the stimulatory effect of depolarization on dialysate 2-AG and/or AEA levels, dialysate OEA and PEA levels were not affected by any of these ionic manipulations (Giuffrida et al., 1999; Bequet et al., 2007) suggesting that formation of these related lipids is not sensitive to changes in neural activity. The relative magnitude of depolarization-induced increases in dialysate 2-AG and/or AEA content (<75% increase from baseline; (Giuffrida et al., 1999; Bequet et al., 2007) was substantially lower than typically observed with dialysate monoamine or acetylcholine levels (300–1000% increase from baseline) (Maysinger et al., 1988; Westerink et al., 1988; Herrera-Marschitz et al., 1990; 1992; 1996;). This may be related to the much lower microdialysis sampling efficiency for eCBs versus the more polar neurotransmitters. However, on demand synthesis of eCB would likely cause slow and subtle changes in their synaptic levels when compared with the dramatic transient changes that follow the massive depolarization-induced release of vesicular neurotransmitter stores.
Perfusion with TTX or with Ca2+-free perfusates dramatically reduces baseline dialysate monoamine and acetylcholine levels, and this has been used as evidence that neurotransmitters in dialysates arise from neuronal sources (Maysinger et al., 1988; Westerink et al., 1988; Herrera-Marschitz et al., 1990; 1992; 1996;). In this regard it is interesting that TTX perfusion induced a modest, non-significant reduction in dialysate eCB levels, while delivery of a Ca2+-free perfusate induced a slight, non-significant increase in dialysate eCBs (Giuffrida et al., 1999). A similar profile is observed with dialysate amino acids such as glutamate and GABA, and from this it has been suggested that baseline dialysate amino acid levels arise from non-neuronal sources (likely glia) (Herrera-Marschitz et al., 1996; Timmerman and Westerink, 1997). Thus, a similar conclusion may be warranted for eCBs, given that astrocytes and microglia can also produce these molecules (Walter et al., 2004; Witting et al., 2004). It should be noted that the eCB experiments by Giuffrida et al. employed lower perfusate TTX concentrations than has traditionally been used in experiments with monoamines and acetylcholine (10–500 µM) (Osborne et al., 1990; Keefe et al., 1992; Herrera-Marschitz et al., 1996), and the Ca2+-free perfusate used for the eCB evaluations was not supplemented with EGTA or Mg2+ that are important for demonstrating Ca2+-dependent reductions in dialysate neurotransmitter levels (Herrera-Marschitz et al., 1992; 1996; You et al., 1994a,b;). Further work is needed to elucidate the relative contributions of neurons and glia to basal dialysate eCB levels.
Effect of eCB clearance inhibition on dialysate eCB content
Endogenous cannabinoid levels in brain are tightly controlled by enzymatic biosynthesis and degradation in vivo. The hydrolytic clearance of AEA is principally mediated by FAAH while the hydrolytic clearance of 2-AG appears to be primarily mediated by MAGL (Cravatt et al., 1996; Lambert and Fowler, 2005; Blankman et al., 2007). Inhibition of these clearance mechanisms produces dramatic increases in brain tissue eCB content and a variety of cannabinoid receptor-dependent behavioural phenotypes (Cravatt et al., 2001; Kathuria et al., 2003; Lichtman et al., 2004b; Long et al., 2009). Several recent microdialysis experiments have evaluated the consequences of FAAH and MAGL inhibition on interstitial AEA and 2-AG levels in the rodent brain.
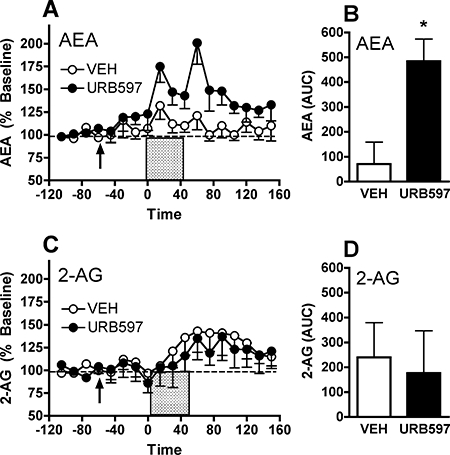
Bequet et al. evaluated the effect of the FAAH inhibitor URB597 on dialysate AEA and 2-AG collected from the rat hypothalamus (Bequet et al., 2007). Systemic administration of 0.5 mg·kg−1 URB597 increased dialysate AEA levels by approximately 80% without altering 2-AG levels. We have obtained similar results with dialysates collected from the rat nucleus accumbens (L.H. Parsons et al., unpubl. obs.). As shown in Figure 4, 0.3 mg·kg−1 URB597 significantly increased dialysate AEA levels without altering 2-AG content in these same samples. Although we observed a more modest AEA increase than reported by Bequet et al., it is notable that baseline dialysate AEA levels were approximately 10-fold lower in the Bequet study (0.1 vs. 1.7 nM respectively). As such, the absolute change in dialysate AEA following URB597 treatment was actually greater in the nucleus accumbens (approximately 0.5 nM) as compared with the hypothalamus (approximately 0.1 nM). These results may reflect regional variances in baseline extracellular AEA concentration, although differences in perfusate flowrate (1 vs. 0.6 µL·min−1) is likely a greater contributing factor in these different baseline dialysate AEA levels. Together, these findings demonstrate that pharmacological inhibition of FAAH activity by URB597 induces a subtle but selective enhancement in dialysate AEA content.
Figure 4.
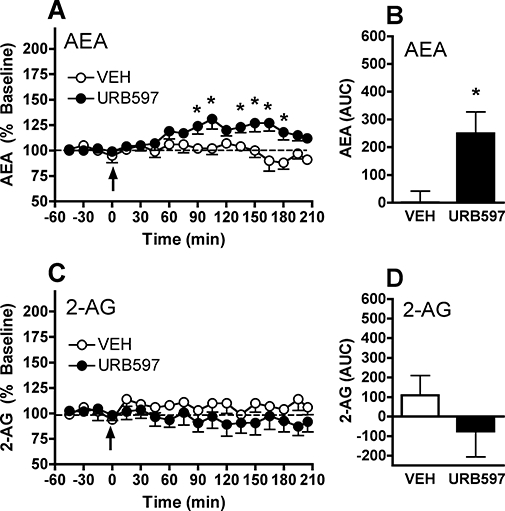
Effect of systemic URB597 administration on AEA (anandamide, N-arachidonoyl-ethanolamine) and 2-arachidonoylglycerol (2-AG) levels in microdialysates collected from rat nucleus accumbens. Baseline dialysate AEA levels were 1.7 ± 0.6 nM in animals in the URB597 group (n= 7) and 1.9 ± 0.8 nM in animals in the vehicle (VEH) group (n= 6). Baseline dialysate 2-AG levels were 10.2 ± 1.0 and 9.4 ± 1.2 nM in these groups respectively. (A) Administration of 0.3 mg·kg−1 URB597 (arrow, time 0 min) induced a significant increase in dialysate AEA levels observable 60 min after administration that persisted for over 2 h. (B) Group comparison of URB597 effect as determined by the area under the curve (AUC). (C and D) Levels of 2-AG measured in these same dialysate samples were not significantly altered by either URB597 or vehicle administration. The asterisk denotes P < 0.05 between URB and VEH groups, as determined by Fisher's post hoc evaluations following anova (A and C) or by anova of group AUC values (B and D).
In comparison with these microdialysis studies, similar URB597 doses induce substantially greater increases in AEA levels measured from bulk brain tissue (Cravatt et al., 2001; Kathuria et al., 2003; Lichtman et al., 2004b). As such, these results highlight a distinction between the effects of FAAH inhibition on interstitial AEA levels versus total brain tissue content. These URB597 doses also produce significant behavioural effects in a variety of paradigms. However, most studies observe behavioural effects of this FAAH inhibitor in the context of a stressor such as forced swimming, pain or bright light (Kathuria et al., 2003; Lichtman et al., 2004b; Gobbi et al., 2005; Hohmann et al., 2005) while behavioural effects of eCB clearance inhibition are less evident under non-stressed conditions (Haller et al., 2004; Bortolato et al., 2006; Naidu et al., 2007; Moreira et al., 2008). This ‘state dependent’ difference in the behavioural effects of eCB clearance inhibition may result from stress-related increases in neuronal activity that increases eCB production, and therefore the behavioural effects of URB597 may reflect a potentiation or prolongation of stimulus-induced AEA formation rather than an accumulation tonically produced AEA. From this, we theorized that URB597-induced alterations in dialysate AEA levels may be enhanced by manipulations that increase eCB production.
To evaluate this possibility we performed a microdialysis study to characterize the effect of FAAH inhibition on dialysate eCB levels during increased neuronal activity (e.g. depolarization; Figure 5). As previously observed, perfusion of vehicle-treated rats with a high potassium/calcium solution induced a subtle but significant increase in dialysate AEA. This effect was significantly enhanced in URB597-pretreated animals, and these elevated AEA levels persisted well after removal of the high potassium/calcium solution reflecting reduced clearance of interstitial AEA in URB597 treated animals. Similar to the results described above (Figure 4) there was a modest increase in dialysate AEA levels during the 60 min period between the systemic administration of the FAAH inhibitor and the induction of depolarization (Figure 5A, time –60–0 min) although this effect did not reach statistical significance. While dialysate 2-AG levels also increased in response to high potassium/calcium solution, URB597 pretreatment had no significant effect on 2-AG clearance.
Figure 5.
Effect of the fatty acid amide hydrolase inhibitor URB597 on depolarization-induced increases in dialysate AEA (anandamide, N-arachidonoyl-ethanolamine) and 2-arachidonoylglycerol (2-AG) levels in the rat nucleus accumbens. Baseline dialysate AEA levels were 1.9 ± 0.4 nM in animals in the URB597 group (n= 7) and 2.1 ± 0.9 nM in animals in the vehicle (VEH) group (n= 6). Baseline dialysate 2-AG levels were 9.4 ± 1.1 and 8.3 ± 1.5 nM respectively. URB597 (0.3 mg·kg−1, i.p.) or saline were administered 60 min prior to delivery of high KCl (90 mM) and CaCl2 (10 mM) perfusate for 45 min. (A) High K+/Ca2+ solution (shaded bar) induced a subtle, transient increase in dialysate AEA that was more pronounced in rats pretreated with URB597. (B) Group comparison of URB597 effect as determined by the area under the curve (AUC). (C and D) High K+/Ca2+ solution induced a similar transient change in dialysate 2-AG levels; URB597 pretreatment had no effect on this profile. The asterisk denotes P < 0.05 between URB and VEH groups, as determined by Fisher's post hoc evaluations following anova (A and C) or by anova of group AUC values (B and D).
The effects of the MAGL inhibitor JZL184 on interstitial eCB levels have been evaluated using microdialysis in C57BL/6 mice (Long et al., 2009). As shown in Figure 6, dialysate 2-AG levels were significantly increased in vehicle-treated mice during and after the high K+/Ca2+ solution pulse, and this effect was substantially more pronounced in mice treated with JZL184. The effect of depolarization on dialysate 2-AG in JZL184-treated mice was blocked by co-perfusion with TTX, confirming that high K+/Ca2+ perfusates increase dialysate eCB levels in an impulse-dependent manner. As expected, JZL184 did not alter dialysate AEA levels. Surprisingly, neither did the high K+/Ca2+ pulse, which could be attributed the smaller area of active dialysis membrane in this experiment compared with those used in rats. Regardless, these data provide in vivo evidence that JZL184 selectively modulate interstitial levels of 2-AG in mouse brain without affecting interstitial AEA.
Figure 6.
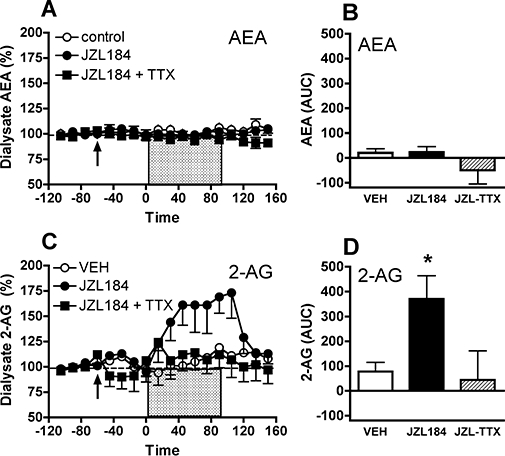
Effect of the monoacylglycerol lipase inhibitor JZL184 on dialysate AEA (anandamide, N-arachidonoyl-ethanolamine) and 2-arachidonoylglycerol (2-AG) levels in the nucleus accumbens of C57BL/6 mice. JZL184 (10 mg·kg−1, i.p.) or saline were administered 60 min prior to a 90 min perfusion of high concentrations of KCl (150 mM) and CaCl2 (10 mM). High K+/Ca2+ solution (shaded bar) did not significantly alter dialysate AEA levels, as determined (A) by temporal analysis or (B) by area under the curve (AUC) comparison of the experimental groups. Baseline dialysate AEA levels were 0.54 ± 0.1 nM for the JZL184 group (n= 8), 0.55 ± 0.1 nM for the JZL184 + TTX (tetrodotoxin) group (n= 6) and 0.58 ± 0.08 nM for the vehicle (VEH) group (n= 6). (C and D) Depolarization subtly increased dialysate 2-AG levels in vehicle-treated mice, and JZL184 pretreatment substantially enhanced this effect. Co-perfusion with TTX blocked the effects of high K+/Ca2+ and JZL184, confirming that dialysate 2-AG increases in an impulse-dependent manner. The asterisk denotes P < 0.05 between JZL and VEH groups, as determined by Fisher's post hoc evaluations following anova (A and C) or by anova of group AUC values (B and D). Baseline dialysate 2-AG levels were 4.6 ± 0.7 nM for the JZL184 group, 4.4 ± 0.3 nM for the JZL184 + TTX group and 4.2 ± 0.4 nM for the vehicle group.
Genetic deletion of FAAH is reported to result in >10-fold elevations of many fatty acid amides including AEA in bulk brain tissue (Cravatt et al., 2001; Gobbi et al., 2005), although fivefold increases in brain tissue AEA content have also been observed in FAAH (−/−) mice (Patel et al., 2005). When assessed by microdialysis, baseline AEA levels are twofold higher in the frontal cortex of FAAH (−/−) mice (1.58 ± 0.1 nM; n= 9) as compared with levels in wild types (0.82 ± 0.1 nM; n= 9) (L.H. Parsons et al., unpubl. obs.). Similar differences in AEA levels are also evident in dialysates from the nucleus accumbens of FAAH (−/−) and wild-type mice (0.88 ± 0.2 nM and 0.49 ± 0.1 nM, respectively; n= 7/genotype). As expected there was no genotypic difference 2-AG levels in nucleus accumbens dialysates (FAAH (−/−), 5.6 ± 5 nM; wild type, 5.1 ± 0.8 nM), but surprisingly FAAH (−/−) mice had significantly higher 2-AG levels in cortical dialysates (13.3 ± 1.9 nM) as compared with wild types (8.9 ± 0.7 nM). Although uncommon, 2-AG hydrolysis by FAAH has been reported in vitro (Goparaju et al., 1998) and the present data suggest that some 2-AG clearance in regions including the frontal cortex may rely on FAAH activity.
Collectively, these in vivo microdialysis data suggest that interstitial eCBs do not robustly accumulate following acute FAAH or MAGL inhibition in undisturbed animals, although the influence of these clearance mechanisms is clearly evident following stimulation of eCB formation. In contrast, genetic deletion of FAAH causes significant elevations of interstitial AEA even under quiescent behavioural conditions, suggesting that pharmacologically induced clearance inhibition is transient or incomplete. Moreover, the effects of clearance inhibition are typically more pronounced in measures of total brain tissue eCB content as compared with in vivo microdialysis. While this may result from technical methodological issues, it also raises the possibility that distinct, regulated pools of eCBs exist in brain that are differentially accessed by microdialysis and bulk tissue analyses.
Summary and concluding remarks
Substantial advances have been made in methods for the quantitative analysis of brain eCB content. The initial identification of AEA and 2-AG in brain tissue was made using MS, and LC-MS and GC-MS approaches continue to be the predominant methods employed today, albeit with substantial refinements. Analysis of eCB content in bulk brain tissue offers a number of advantages. It provides an index of total tissue eCB content that is minimally influenced by eCB associations with membrane lipid rafts, binding proteins or other ‘chaperone’ mechanisms. Moreover, bulk tissue measurements can efficiently map regional eCB differences and identify spatially targeted responses to pharmacological or physiological challenge. Furthermore, analysis of relatively large samples provides sufficient analyte mass to enable discovery and characterization of novel eCB molecules. There are also several caveats associated with bulk tissue analyses. Tissue samples are likely influenced by rapid post-mortem changes in eCB production, and sample eCB content is heavily influenced by the extraction and purification procedures employed. The variability introduced by these extraction procedures complicates interpretation of data between studies, and necessitates inclusion of control subjects in evaluations of relative changes in eCB content associated with pharmacological challenge or pathologic state. This approach is not well suited for temporal analyses, and cannot easily differentiate distinct subcellular eCB pools.
Microdialysis offers an alternate approach by sampling interstitial eCBs from the brains of conscious animals, thereby avoiding complications that arise post-mortem. Multiple samples are collected within a single experiment, and this provides a within-animal baseline reference and allows for temporal profiling of relative changes in interstitial eCB levels following pharmacologic, physiological or behavioural challenge. In general microdialysates do not require extraction or purification and can be directly analysed by LC-MS, and samples can be split for the analysis of multiple analytes (e.g. eCB and amino acid content in individual samples). Microdialysis is also associated with a number of disadvantages, such as the need for stereotaxic surgical preparation and specialized equipment (liquid swivels, perfusion pumps, etc.). Cellular reactions to probe implantation may confound eCB measures obtained at substantial post-implantation times (>24 h). The relationship between dialysate eCB content and actual interstitial eCB levels is not characterized, and is complicated by potential chaperone mechanisms for eCB diffusion (e.g. binding proteins, exosomes, etc.) and microdialysis measures likely do not index autocrine eCB signalling. Inefficient eCB sampling results in very low analyte concentrations in small sample volumes, placing substantial burden on the analytical technique and resulting in poor temporal resolution.
Although differences in effect magnitude exist between tissue and microdialysis eCB measures, both approaches have demonstrated higher levels of 2-AG versus AEA in various brain regions, and both approaches have been used to demonstrate the selective influence of MAGL and FAAH activity on brain 2-AG and AEA content respectively. Moreover, these approaches have provided similar evidence that drugs of abuse can alter brain eCB content in a drug-specific manner. These consistent observations provide some amount of cross-method validation.
Conservatism is warranted when interpreting quantitative eCB measures made either by extraction from bulk tissue or by in vivo microdialysis due to the large number of factors influencing both methods. While both of these approaches can provide a reasonable index of relative changes in brain eCB content, it is likely that neither method provides an accurate measure of eCB concentrations at cannabinoid receptors.
Most quantitative eCB studies in brain have focused on AEA and 2-AG, and frequently only one of these moieties has been analysed. Because of growing evidence for interactions between these eCBs (Di Marzo and Maccarrone, 2008;Maccarrone et al., 2008), the simultaneous analysis of both eCBs will be important in future studies. Moreover, little is known about the content and function of other putative eCBs (e.g. HEA, DEA, virodhamine, noladin ether and NA-DA), and even less is known about the metabolism and function of other arachidonoyl conjugates of amino acids and other monoamine neurotransmitters that have been detected in brain tissue. Thus a major challenge is the development of reliable and sensitive methods for the quantitation of a broad range of eCBs and related entourage compounds from individual samples. Availability of these methods will be of substantial importance for characterizing the role eCB signalling in normal and abnormal physiological function.
Acknowledgments
We would like to thank David Stouffer for assistance in the microdialysis evaluation of post-mortem changes in interstitial eCB levels. This work was supported by research grants from the National Institute on Alcohol Abuse and Alcoholism (RO1AA014619, P60AA006420) and National Institute on Drug Abuse (P01DA017259). This is publication #20657 from The Scripps Research Institute.
Glossary
Abbreviations:
- 2-AG
2-arachidonoylglycerol
- AEA
anandamide, N-arachidonoyl-ethanolamine
- β-CD
β-cyclodextrin
- CB1
cannabinoid-1 receptor
- CB2
cannabinoid-2 receptor
- eCB
endocannabinoid
- FAAH
fatty acid amide hydrolase
- GABA
gamma aminobutyric acid
- GC-MS
gas chromatography – mass spectrometry
- HP-β-CD
hydroxy-propyl-β-cyclodextrin
- LC-MS
liquid chromatography – mass spectrometry
- MAGL
monoacylglycerol lipase
- MRM
multiple reaction monitoring
- MS
mass spectrometry
- NA-DA
N-arachidonoyl-dopamine
- NAE
N-acyl-ethanolamine
- NAPE
N-acyl phosphatidylethanolamine
- OEA
oleoylethanolamide
- PAG
periaqueductal grey
- PEA
palmitoylethanolamide
- PES
polyethylsulfone
- SIM
selected ion monitoring
- SPE
solid phase extraction
- TTX
tetrodotoxin
Conflict of interest
The authors affirm no conflicts of interest.
References
- Abulrob A, Tauskela JS, Mealing G, Brunette E, Faid K, Stanimirovic D. Protection by cholesterol-extracting cyclodextrins: a role for N-methyl-D-aspartate receptor redistribution. J Neurochem. 2005;92:1477–1486. doi: 10.1111/j.1471-4159.2005.03001.x. [DOI] [PubMed] [Google Scholar]
- Ahn K, Johnson DS, Mileni M, Beidler D, Long JZ, McKinney MK, et al. Discovery and characterization of a highly selective FAAH inhibitor that reduces inflammatory pain. Chem Biol. 2009;16:411–420. doi: 10.1016/j.chembiol.2009.02.013. [DOI] [PMC free article] [PubMed] [Google Scholar]
- Alexander SP, Mathie A, Peters JA. Guide to Receptors and Channels (GRAC), 3rd edition. Br J Pharmacol. 2008;153(Suppl. 2):S1–209. doi: 10.1038/sj.bjp.0707746. [DOI] [PMC free article] [PubMed] [Google Scholar]
- Alger BE. Retrograde signaling in the regulation of synaptic transmission: focus on endocannabinoids. Prog Neurobiol. 2002;68:247–286. doi: 10.1016/s0301-0082(02)00080-1. [DOI] [PubMed] [Google Scholar]
- Alvarez-Jaimes L, Polis I, Parsons LH. Regional influence of CB1 receptor signaling on ethanol self-administration by rats. The Open Neuropsychopharmacology. 2009a;2:77–85. doi: 10.2174/1876523800902020077. [DOI] [PMC free article] [PubMed] [Google Scholar]
- Alvarez-Jaimes L, Stouffer DG, Parsons LH. Chronic ethanol treatment potentiates ethanol-induced increases in interstitial nucleus accumbens endocannabinoid levels in rats. J Neurochem. 2009b;111:37–48. doi: 10.1111/j.1471-4159.2009.06301.x. [DOI] [PMC free article] [PubMed] [Google Scholar]
- Arai Y, Fukushima T, Shirao M, Yang X, Imai K. Sensitive determination of anandamide in rat brain utilizing a coupled-column HPLC with fluorimetric detection. Biomed Chromatogr. 2000;14:118–124. doi: 10.1002/(SICI)1099-0801(200004)14:2<118::AID-BMC936>3.0.CO;2-O. [DOI] [PubMed] [Google Scholar]
- Artmann A, Petersen G, Hellgren LI, Boberg J, Skonberg C, Nellemann C, et al. Influence of dietary fatty acids on endocannabinoid and N-acylethanolamine levels in rat brain, liver and small intestine. Biochim Biophys Acta. 2008;1781:200–212. doi: 10.1016/j.bbalip.2008.01.006. [DOI] [PubMed] [Google Scholar]
- Bacci A, Huguenard JR, Prince DA. Long-lasting self-inhibition of neocortical interneurons mediated by endocannabinoids. Nature. 2004;431:312–316. doi: 10.1038/nature02913. [DOI] [PubMed] [Google Scholar]
- Bari M, Battista N, Fezza F, Finazzi-Agro A, Maccarrone M. Lipid rafts control signaling of type-1 cannabinoid receptors in neuronal cells. Implications for anandamide-induced apoptosis. J Biol Chem. 2005;280:12212–12220. doi: 10.1074/jbc.M411642200. [DOI] [PubMed] [Google Scholar]
- Baseski HM, Watson CJ, Cellar NA, Shackman JG, Kennedy RT. Capillary liquid chromatography with MS3 for the determination of enkephalins in microdialysis samples from the striatum of anesthetized and freely-moving rats. J Mass Spectrom. 2005;40:146–153. doi: 10.1002/jms.733. [DOI] [PubMed] [Google Scholar]
- Bazinet RP, Lee H-J, Felder CC, Porter AC, Rapoport SI, Rosenberger TA. Rapid high-energy microwave fixation is required to determine the ananadamide (N-arachidonoylethanolamine) concentration of rat brain. Neurochem Res. 2005;30:597–601. doi: 10.1007/s11064-005-2746-5. [DOI] [PubMed] [Google Scholar]
- Benveniste H, Diemer NH. Cellular reactions to implantation of a microdialysis tube in the rat hippocampus. Acta Neuropathol. 1987;74:234–238. doi: 10.1007/BF00688186. [DOI] [PubMed] [Google Scholar]
- Benveniste H, Drejer J, Schousboe A, Diemer NH. Regional cerebral glucose phosphorylation and blood flow after insertion of a microdialysis fiber through the dorsal hippocampus in the rat. J Neurochem. 1987;49:729–734. doi: 10.1111/j.1471-4159.1987.tb00954.x. [DOI] [PubMed] [Google Scholar]
- Bequet F, Uzabiaga F, Desbazeille M, Ludwiczak P, Maftouh M, Picard C, et al. CB1 receptor-mediated control of the release of endocannabinoids (as assessed by microdialysis coupled with LC/MS) in the rat hypothalamus. Eur J Neurosci. 2007;26:3458–3464. doi: 10.1111/j.1460-9568.2007.05900.x. [DOI] [PubMed] [Google Scholar]
- Bisogno T, Berrendero F, Ambrosino G, Cebeira M, Ramos JA, Fernandez-Ruiz JJ, et al. Brain regional distribution of endocannabinoids: implications for their biosynthesis and biological function. Biochem Biophys Res Commun. 1999;256:377–380. doi: 10.1006/bbrc.1999.0254. [DOI] [PubMed] [Google Scholar]
- Bisogno T, Melck D, Bobrov M, Gretskaya NM, Bezuglov VV, De Petrocellis L, et al. N-acyl-dopamines: novel synthetic CB(1) cannabinoid-receptor ligands and inhibitors of anandamide inactivation with cannabimimetic activity in vitro and in vivo. Biochem J. 2000;351(Pt 3):817–824. [PMC free article] [PubMed] [Google Scholar]
- Bisogno T, Howell F, Williams G, Minassi A, Cascio MG, Ligresti A, et al. Cloning of the first sn1-DAG lipases points to the spatial and temporal regulation of endocannabinoid signaling in the brain. J Cell Biol. 2003;163:463–468. doi: 10.1083/jcb.200305129. [DOI] [PMC free article] [PubMed] [Google Scholar]
- Bisogno T, Cascio MG, Saha B, Mahadevan A, Urbani P, Minassi A, et al. Development of the first potent and specific inhibitors of endocannabinoid biosynthesis. Biochim Biophys Acta. 2006;1761:205–212. doi: 10.1016/j.bbalip.2005.12.009. [DOI] [PubMed] [Google Scholar]
- Blankman JL, Simon GM, Cravatt BF. A comprehensive profile of brain enzymes that hydrolyze the endocannabinoid 2-arachidonoylglycerol. Chem Biol. 2007;14:1347–1356. doi: 10.1016/j.chembiol.2007.11.006. [DOI] [PMC free article] [PubMed] [Google Scholar]
- Bligh EG, Dyer WJ. A rapid method of total lipid extraction and purification. Can J Biochem Physiol. 1959;37:911–917. doi: 10.1139/o59-099. [DOI] [PubMed] [Google Scholar]
- Bojesen IN, Hansen HS. Binding of anandamide to bovine serum albumin. J Lipid Res. 2003;44:1790–1794. doi: 10.1194/jlr.M300170-JLR200. [DOI] [PubMed] [Google Scholar]
- Bortolato M, Campolongo P, Mangieri RA, Scattoni ML, Frau R, Trezza V, et al. Anxiolytic-like properties of the anandamide transport inhibitor AM404. Neuropsychopharmacology. 2006;31:2652–2659. doi: 10.1038/sj.npp.1301061. [DOI] [PubMed] [Google Scholar]
- Bortolato M, Mangieri RA, Fu J, Kim JH, Arguello O, Duranti A, et al. Antidepressant-like activity of the fatty acid amide hydrolase inhibitor URB597 in a rat model of chronic mild stress. Biol Psychiatry. 2007;62:1103–1110. doi: 10.1016/j.biopsych.2006.12.001. [DOI] [PubMed] [Google Scholar]
- Bradshaw HB, Rimmerman N, Krey JF, Walker JM. Sex and hormonal cycle differences in rat brain levels of pain-related cannabimimetic lipid mediators. Am J Physiol Regul Integr Comp Physiol. 2006;291:R349–R358. doi: 10.1152/ajpregu.00933.2005. [DOI] [PubMed] [Google Scholar]
- Cabranes A, Venderova K, de Lago E, Fezza F, Sanchez A, Mestre L, et al. Decreased endocannabinoid levels in the brain and beneficial effects of agents activating cannabinoid and/or vanilloid receptors in a rat model of multiple sclerosis. Neurobiol Dis. 2005;20:207–217. doi: 10.1016/j.nbd.2005.03.002. [DOI] [PubMed] [Google Scholar]
- Cadas H, Gaillet S, Beltramo M, Venance L, Piomelli D. Biosynthesis of an endogenous cannabinoid precursor in neurons and its control by calcium and cAMP. J Neurosci. 1996;16:3934–3942. doi: 10.1523/JNEUROSCI.16-12-03934.1996. [DOI] [PMC free article] [PubMed] [Google Scholar]
- Caille S, Alvarez-Jaimes L, Polis I, Stouffer DG, Parsons LH. Specific alterations of extracellular endocannabinoid levels in the nucleus accumbens by ethanol, heroin, and cocaine self-administration. J Neurosci. 2007;27:3695–3702. doi: 10.1523/JNEUROSCI.4403-06.2007. [DOI] [PMC free article] [PubMed] [Google Scholar]
- Cenedella RJ, Galli C, Paoletti R. Brain free fatty levels in rats sacrificed by decapitation versus focused microwave irradiation. Lipids. 1975;10:290–293. doi: 10.1007/BF02532702. [DOI] [PubMed] [Google Scholar]
- Clapp-Lilly KL, Roberts RC, Duffy LK, Irons KP, Hu Y, Drew KL. An ultrastructural analysis of tissue surrounding a microdialysis probe. J Neurosci Methods. 1999;90:129–142. doi: 10.1016/s0165-0270(99)00064-3. [DOI] [PubMed] [Google Scholar]
- Collias JC, Manuelidis EE. Histopathological changes produced by implanted electrodes in cat brains; comparison with histopathological changes in human and experimental puncture wounds. J Neurosurg. 1957;14:302–328. doi: 10.3171/jns.1957.14.3.0302. [DOI] [PubMed] [Google Scholar]
- Cravatt BF, Giang DK, Mayfield SP, Boger DL, Lerner RA, Gilula NB. Molecular characterization of an enzyme that degrades neuromodulatory fatty-acid amides. Nature. 1996;384:83–87. doi: 10.1038/384083a0. [DOI] [PubMed] [Google Scholar]
- Cravatt BF, Demarest K, Patricelli MP, Bracey MH, Giang DK, Martin BR, et al. Supersensitivity to anandamide and enhanced endogenous cannabinoid signaling in mice lacking fatty acid amide hydrolase. Proc Natl Acad Sci USA. 2001;98:9371–9376. doi: 10.1073/pnas.161191698. [DOI] [PMC free article] [PubMed] [Google Scholar]
- Devane WA, Hanus L, Breuer A, Pertwee RG, Stevenson LA, Griffin G, et al. Isolation and structure of a brain constituent that binds to the cannabinoid receptor. Science. 1992;258:1946–1949. doi: 10.1126/science.1470919. [DOI] [PubMed] [Google Scholar]
- Di S, Boudaba C, Popescu IR, Weng FJ, Harris C, Marcheselli VL, et al. Activity-dependent release and actions of endocannabinoids in the rat hypothalamic supraoptic nucleus. J Physiol. 2005;569:751–760. doi: 10.1113/jphysiol.2005.097477. [DOI] [PMC free article] [PubMed] [Google Scholar]
- Di Marzo V, Maccarrone M. FAAH and anandamide: is 2-AG really the odd one out? Trends Pharmacol Sci. 2008;29:229–233. doi: 10.1016/j.tips.2008.03.001. [DOI] [PubMed] [Google Scholar]
- Di Marzo V, Fontana A, Cadas H, Schinelli S, Cimino G, Schwartz JC, et al. Formation and inactivation of endogenous cannabinoid anandamide in central neurons. Nature. 1994;372:686–691. doi: 10.1038/372686a0. [DOI] [PubMed] [Google Scholar]
- Di Marzo V, De Petrocellis L, Sugiura T, Waku K. Potential biosynthetic connections between the two cannabimimetic eicosanoids, anandamide and 2-arachidonoyl-glycerol, in mouse neuroblastoma cells. Biochem Biophys Res Commun. 1996;227:281–288. doi: 10.1006/bbrc.1996.1501. [DOI] [PubMed] [Google Scholar]
- Di Marzo V, Hill MP, Bisogno T, Crossman AR, Brotchie JM. Enhanced levels of endogenous cannabinoids in the globus pallidus are associated with a reduction in movement in an animal model of Parkinson's disease. FASEB J. 2000;14:1432–1438. doi: 10.1096/fj.14.10.1432. [DOI] [PubMed] [Google Scholar]
- Dykstra KH, Hsiao JK, Morrison PF, Bungay PM, Mefford IN, Scully MM, et al. Quantitative examination of tissue concentration profiles associated with microdialysis. J Neurochem. 1992;58:931–940. doi: 10.1111/j.1471-4159.1992.tb09346.x. [DOI] [PubMed] [Google Scholar]
- Farias SE, Basselin M, Chang L, Heidenreich KA, Rapoport SI, Murphy RC. Formation of eicosanoids, E2/D2 isoprostanes, and docosanoids following decapitation-induced ischemia, measured in high-energy-microwaved rat brain. J Lipid Res. 2008;49:1990–2000. doi: 10.1194/jlr.M800200-JLR200. [DOI] [PMC free article] [PubMed] [Google Scholar]
- Faure J, Lachenal G, Court M, Hirrlinger J, Chatellard-Causse C, Blot B, et al. Exosomes are released by cultured cortical neurones. Mol Cell Neurosci. 2006;31:642–648. doi: 10.1016/j.mcn.2005.12.003. [DOI] [PubMed] [Google Scholar]
- Fegley D, Gaetani S, Duranti A, Tontini A, Mor M, Tarzia G, et al. Characterization of the fatty acid amide hydrolase inhibitor cyclohexyl carbamic acid 3′-carbamoyl-biphenyl-3-yl ester (URB597): effects on anandamide and oleoylethanolamide deactivation. J Pharmacol Exp Ther. 2005;313:352–358. doi: 10.1124/jpet.104.078980. [DOI] [PubMed] [Google Scholar]
- Felder CC, Nielsen A, Briley EM, Palkovits M, Priller J, Axelrod J, et al. Isolation and measurement of the endogenous cannabinoid receptor agonist, anandamide, in brain and peripheral tissues of human and rat. FEBS Lett. 1996;393:231–235. doi: 10.1016/0014-5793(96)00891-5. [DOI] [PubMed] [Google Scholar]
- Ferrer B, Asbrock N, Kathuria S, Piomelli D, Giuffrida A. Effects of levodopa on endocannabinoid levels in rat basal ganglia: implications for the treatment of levodopa-induced dyskinesias. Eur J Neurosci. 2003;18:1607–1614. doi: 10.1046/j.1460-9568.2003.02896.x. [DOI] [PubMed] [Google Scholar]
- Ferrer B, Bermudez-Silva FJ, Bilbao A, Alvarez-Jaimes L, Sanchez-Vera I, Giuffrida A, et al. Regulation of brain anandamide by acute administration of ethanol. Biochem J. 2007;404:97–104. doi: 10.1042/BJ20061898. [DOI] [PMC free article] [PubMed] [Google Scholar]
- Folch J, Lees M, Sloane Stanley GH. A simple method for the isolation and purification of total lipides from animal tissues. J Biol Chem. 1957;226:497–509. [PubMed] [Google Scholar]
- Fride E. Multiple roles for the endocannabinoid system during the earliest stages of life: pre- and postnatal development. J Neuroendocrinol. 2008;20(Suppl. 1):75–81. doi: 10.1111/j.1365-2826.2008.01670.x. [DOI] [PubMed] [Google Scholar]
- de Gassart A, Geminard C, Fevrier B, Raposo G, Vidal M. Lipid raft-associated protein sorting in exosomes. Blood. 2003;102:4336–4344. doi: 10.1182/blood-2003-03-0871. [DOI] [PubMed] [Google Scholar]
- Gerdeman GL, Lovinger DM. Emerging roles for endocannabinoids in long-term synaptic plasticity. Br J Pharmacol. 2003;140:781–789. doi: 10.1038/sj.bjp.0705466. [DOI] [PMC free article] [PubMed] [Google Scholar]
- Giuffrida A, Piomelli D. Isotope dilution GC/MS determination of anandamide and other fatty acylethanolamides in rat blood plasma. FEBS Lett. 1998;422:373–376. doi: 10.1016/s0014-5793(98)00046-5. [DOI] [PubMed] [Google Scholar]
- Giuffrida A, Parsons LH, Kerr TM, Rodriguez de Fonseca F, Navarro M, Piomelli D. Dopamine activation of endogenous cannabinoid signaling in dorsal striatum. Nat Neurosci. 1999;2:358–363. doi: 10.1038/7268. [DOI] [PubMed] [Google Scholar]
- Gobbi G, Bambico FR, Mangieri R, Bortolato M, Campolongo P, Solinas M, et al. Antidepressant-like activity and modulation of brain monoaminergic transmission by blockade of anandamide hydrolysis. Proc Natl Acad Sci USA. 2005;102:18620–18625. doi: 10.1073/pnas.0509591102. [DOI] [PMC free article] [PubMed] [Google Scholar]
- Golovko MY, Murphy EJ. An improved LC-MS/MS procedure for brain prostanoid analysis using brain fixation with head-focused microwave irradiation and liquid-liquid extraction. J Lipid Res. 2008;49:893–902. doi: 10.1194/jlr.D700030-JLR200. [DOI] [PubMed] [Google Scholar]
- Gonzalez S, Bisogno T, Wenger T, Manzanares J, Milone A, Berrendero F, et al. Sex steroid influence on cannabinoid CB(1) receptor mRNA and endocannabinoid levels in the anterior pituitary gland. Biochem Biophys Res Commun. 2000;270:260–266. doi: 10.1006/bbrc.2000.2406. [DOI] [PubMed] [Google Scholar]
- Gonzalez S, Cascio MG, Fernandez-Ruiz J, Fezza F, Di Marzo V, Ramos JA. Changes in endocannabinoid contents in the brain of rats chronically exposed to nicotine, ethanol or cocaine. Brain Res. 2002a;954:73–81. doi: 10.1016/s0006-8993(02)03344-9. [DOI] [PubMed] [Google Scholar]
- Gonzalez S, Fernandez-Ruiz J, Sparpaglione V, Parolaro D, Ramos JA. Chronic exposure to morphine, cocaine or ethanol in rats produced different effects in brain cannabinoid CB(1) receptor binding and mRNA levels. Drug Alcohol Depend. 2002b;66:77–84. doi: 10.1016/s0376-8716(01)00186-7. [DOI] [PubMed] [Google Scholar]
- Gonzalez S, Fernandez-Ruiz J, Di Marzo V, Hernandez M, Arevalo C, Nicanor C, et al. Behavioral and molecular changes elicited by acute administration of SR141716 to Delta9-tetrahydrocannabinol-tolerant rats: an experimental model of cannabinoid abstinence. Drug Alcohol Depend. 2004a;74:159–170. doi: 10.1016/j.drugalcdep.2003.12.011. [DOI] [PubMed] [Google Scholar]
- Gonzalez S, Valenti M, de Miguel R, Fezza F, Fernandez-Ruiz J, Di Marzo V, et al. Changes in endocannabinoid contents in reward-related brain regions of alcohol-exposed rats, and their possible relevance to alcohol relapse. Br J Pharmacol. 2004b;143:455–464. doi: 10.1038/sj.bjp.0705963. [DOI] [PMC free article] [PubMed] [Google Scholar]
- Goparaju SK, Ueda N, Yamaguchi H, Yamamoto S. Anandamide amidohydrolase reacting with 2-arachidonoylglycerol, another cannabinoid receptor ligand. FEBS Lett. 1998;422:69–73. doi: 10.1016/s0014-5793(97)01603-7. [DOI] [PubMed] [Google Scholar]
- Grabb MC, Sciotti VM, Gidday JM, Cohen SA, van Wylen DG. Neurochemical and morphological responses to acutely and chronically implanted brain microdialysis probes. J Neurosci Methods. 1998;82:25–34. doi: 10.1016/s0165-0270(98)00025-9. [DOI] [PubMed] [Google Scholar]
- Guindon J, Hohmann AG. The endocannabinoid system and pain. CNS Neurol Disord Drug Targets. 2009;8:403–421. doi: 10.2174/187152709789824660. [DOI] [PMC free article] [PubMed] [Google Scholar]
- Haller J, Varga B, Ledent C, Barna I, Freund TF. Context-dependent effects of CB1 cannabinoid gene disruption on anxiety-like and social behaviour in mice. Eur J Neurosci. 2004;19:1906–1912. doi: 10.1111/j.1460-9568.2004.03293.x. [DOI] [PubMed] [Google Scholar]
- Hanus L, Gopher A, Almog S, Mechoulam R. Two new unsaturated fatty acid ethanolamides in brain that bind to the cannabinoid receptor. J Med Chem. 1993;36:3032–3034. doi: 10.1021/jm00072a026. [DOI] [PubMed] [Google Scholar]
- Hanus L, Abu-Lafi S, Fride E, Breuer A, Vogel Z, Shalev DE, et al. 2-arachidonyl glyceryl ether, an endogenous agonist of the cannabinoid CB1 receptor. Proc Natl Acad Sci USA. 2001;98:3662–3665. doi: 10.1073/pnas.061029898. [DOI] [PMC free article] [PubMed] [Google Scholar]
- Hardison S, Weintraub ST, Giuffrida A. Quantification of endocannabinoids in rat biological samples by GC/MS: technical and theoretical considerations. Prostaglandins Other Lipid Mediat. 2006;81:106–112. doi: 10.1016/j.prostaglandins.2006.08.002. [DOI] [PubMed] [Google Scholar]
- Hascup ER, af Bjerken S, Hascup KN, Pomerleau F, Huettl P, Stromberg I, et al. Histological studies of the effects of chronic implantation of ceramic-based microelectrode arrays and microdialysis probes in rat prefrontal cortex. Brain Res. 2009;1291:12–20. doi: 10.1016/j.brainres.2009.06.084. [DOI] [PMC free article] [PubMed] [Google Scholar]
- Heifets BD, Castillo PE. Endocannabinoid signaling and long-term synaptic plasticity. Annu Rev Physiol. 2009;71:283–306. doi: 10.1146/annurev.physiol.010908.163149. [DOI] [PMC free article] [PubMed] [Google Scholar]
- Herrera-Marschitz M, Goiny M, Utsumi H, Ferre S, Hakansson L, Nordberg A, et al. Effect of unilateral nucleus basalis lesion on cortical and striatal acetylcholine and dopamine release monitored in vivo with microdialysis. Neurosci Lett. 1990;110:172–179. doi: 10.1016/0304-3940(90)90807-l. [DOI] [PubMed] [Google Scholar]
- Herrera-Marschitz M, Meana JJ, O'Connor WT, Goiny M, Reid MS, Ungerstedt U. Neuronal dependence of extracellular dopamine, acetylcholine, glutamate, aspartate and gamma-aminobutyric acid (GABA) measured simultaneously from rat neostriatum using in vivo microdialysis: reciprocal interactions. Amino Acids. 1992;2:157–179. doi: 10.1007/BF00806086. [DOI] [PubMed] [Google Scholar]
- Herrera-Marschitz M, You ZB, Goiny M, Meana JJ, Silveira R, Godukhin OV, et al. On the origin of extracellular glutamate levels monitored in the basal ganglia of the rat by in vivo microdialysis. J Neurochem. 1996;66:1726–1735. doi: 10.1046/j.1471-4159.1996.66041726.x. [DOI] [PubMed] [Google Scholar]
- Hoffman AF, Lupica CR. Direct actions of cannabinoids on synaptic transmission in the nucleus accumbens: a comparison with opioids. J Neurophysiol. 2001;85:72–83. doi: 10.1152/jn.2001.85.1.72. [DOI] [PubMed] [Google Scholar]
- Hohmann AG, Suplita RL, Bolton NM, Neely MH, Fegley D, Mangieri R, et al. An endocannabinoid mechanism for stress-induced analgesia. Nature. 2005;435:1108–1112. doi: 10.1038/nature03658. [DOI] [PubMed] [Google Scholar]
- Hoover HS, Blankman JL, Niessen S, Cravatt BF. Selectivity of inhibitors of endocannabinoid biosynthesis evaluated by activity-based protein profiling. Bioorg Med Chem Lett. 2008;18:5838–5841. doi: 10.1016/j.bmcl.2008.06.091. [DOI] [PMC free article] [PubMed] [Google Scholar]
- Huang SM, Bisogno T, Trevisani M, Al-Hayani A, De Petrocellis L, Fezza F, et al. An endogenous capsaicin-like substance with high potency at recombinant and native vanilloid VR1 receptors. Proc Natl Acad Sci USA. 2002;99:8400–8405. doi: 10.1073/pnas.122196999. [DOI] [PMC free article] [PubMed] [Google Scholar]
- Kaczocha M, Glaser ST, Deutsch DG. Identification of intracellular carriers for the endocannabinoid anandamide. Proc Natl Acad Sci USA. 2009;106:6375–6380. doi: 10.1073/pnas.0901515106. [DOI] [PMC free article] [PubMed] [Google Scholar]
- Karbarz MJ, Luo L, Chang L, Tham CS, Palmer JA, Wilson SJ, et al. Biochemical and biological properties of 4-(3-phenyl-[1,2,4] thiadiazol-5-yl)-piperazine-1-carboxylic acid phenylamide, a mechanism-based inhibitor of fatty acid amide hydrolase. Anesth Analg. 2009;108:316–329. doi: 10.1213/ane.0b013e31818c7cbd. [DOI] [PubMed] [Google Scholar]
- Kathuria S, Gaetani S, Fegley D, Valino F, Duranti A, Tontini A, et al. Modulation of anxiety through blockade of anandamide hydrolysis. Nat Med. 2003;9:76–81. doi: 10.1038/nm803. [DOI] [PubMed] [Google Scholar]
- Keefe KA, Zigmond MJ, Abercrombie ED. Extracellular dopamine in striatum: influence of nerve impulse activity in medial forebrain bundle and local glutamatergic input. Neuroscience. 1992;47:325–332. doi: 10.1016/0306-4522(92)90248-z. [DOI] [PubMed] [Google Scholar]
- Kempe K, Hsu FF, Bohrer A, Turk J. Isotope dilution mass spectrometric measurements indicate that arachidonylethanolamide, the proposed endogenous ligand of the cannabinoid receptor, accumulates in rat brain tissue post mortem but is contained at low levels in or is absent from fresh tissue. J Biol Chem. 1996;271:17287–17295. doi: 10.1074/jbc.271.29.17287. [DOI] [PubMed] [Google Scholar]
- Khramov AN, Stenken JA. Enhanced microdialysis recovery of some tricyclic antidepressants and structurally related drugs by cyclodextrin-mediated transport. Analyst. 1999;124:1027–1033. doi: 10.1039/a901236b. [DOI] [PubMed] [Google Scholar]
- King AR, Duranti A, Tontini A, Rivara S, Rosengarth A, Clapper JR, et al. URB602 inhibits monoacylglycerol lipase and selectively blocks 2-arachidonoylglycerol degradation in intact brain slices. Chem Biol. 2007;14:1357–1365. doi: 10.1016/j.chembiol.2007.10.017. [DOI] [PMC free article] [PubMed] [Google Scholar]
- Kingsley PJ, Marnett LJ. LC-MS-MS analysis of neutral eicosanoids. Methods Enzymol. 2007;433:91–112. doi: 10.1016/S0076-6879(07)33005-X. [DOI] [PubMed] [Google Scholar]
- Kingsley PJ, Marnett LJ. Analysis of endocannabinoids, their congeners and COX-2 metabolites. J Chromatogr B Analyt Technol Biomed Life Sci. 2009;877:2746–2754. doi: 10.1016/j.jchromb.2009.05.024. [DOI] [PMC free article] [PubMed] [Google Scholar]
- Kirkham TC, Williams CM, Fezza F, Di Marzo V. Endocannabinoid levels in rat limbic forebrain and hypothalamus in relation to fasting, feeding and satiation: stimulation of eating by 2-arachidonoyl glycerol. Br J Pharmacol. 2002;136:550–557. doi: 10.1038/sj.bjp.0704767. [DOI] [PMC free article] [PubMed] [Google Scholar]
- Klein U, Gimpl G, Fahrenholz F. Alteration of the myometrial plasma membrane cholesterol content with beta-cyclodextrin modulates the binding affinity of the oxytocin receptor. Biochemistry. 1995;34:13784–13793. doi: 10.1021/bi00042a009. [DOI] [PubMed] [Google Scholar]
- de Lago E, Petrosino S, Valenti M, Morera E, Ortega-Gutierrez S, Fernandez-Ruiz J, et al. Effect of repeated systemic administration of selective inhibitors of endocannabinoid inactivation on rat brain endocannabinoid levels. Biochem Pharmacol. 2005;70:446–452. doi: 10.1016/j.bcp.2005.05.011. [DOI] [PubMed] [Google Scholar]
- Lambert DM, Fowler CJ. The endocannabinoid system: drug targets, lead compounds, and potential therapeutic applications. J Med Chem. 2005;48:5059–5087. doi: 10.1021/jm058183t. [DOI] [PubMed] [Google Scholar]
- Lanckmans K, Van Eeckhaut A, Sarre S, Smolders I, Michotte Y. Capillary and nano-liquid chromatography-tandem mass spectrometry for the quantification of small molecules in microdialysis samples: comparison with microbore dimensions. J Chromatogr A. 2006;1131:166–175. doi: 10.1016/j.chroma.2006.07.090. [DOI] [PubMed] [Google Scholar]
- Lastres-Becker I, Fezza F, Cebeira M, Bisogno T, Ramos JA, Milone A, et al. Changes in endocannabinoid transmission in the basal ganglia in a rat model of Huntington's disease. Neuroreport. 2001;12:2125–2129. doi: 10.1097/00001756-200107200-00017. [DOI] [PubMed] [Google Scholar]
- Legido-Quigley C, Smith NW, Mallet D. Quantification of the sensitivity increase of a micro-high-performance liquid chromatography-electrospray ionization mass spectrometry system with decreasing column diameter. J Chromatogr A. 2002;976:11–18. doi: 10.1016/s0021-9673(02)01156-1. [DOI] [PubMed] [Google Scholar]
- Lichtman AH, Leung D, Shelton CC, Saghatelian A, Hardouin C, Boger DL, et al. Reversible inhibitors of fatty acid amide hydrolase that promote analgesia: evidence for an unprecedented combination of potency and selectivity. J Pharmacol Exp Ther. 2004a;311:441–448. doi: 10.1124/jpet.104.069401. [DOI] [PubMed] [Google Scholar]
- Lichtman AH, Shelton CC, Advani T, Cravatt BF. Mice lacking fatty acid amide hydrolase exhibit a cannabinoid receptor-mediated phenotypic hypoalgesia. Pain. 2004b;109:319–327. doi: 10.1016/j.pain.2004.01.022. [DOI] [PubMed] [Google Scholar]
- Long JZ, Li W, Booker L, Burston JJ, Kinsey SG, Schlosburg JE, et al. Selective blockade of 2-arachidonoylglycerol hydrolysis produces cannabinoid behavioral effects. Nat Chem Biol. 2009;5:37–44. doi: 10.1038/nchembio.129. [DOI] [PMC free article] [PubMed] [Google Scholar]
- Lopez-Moreno JA, Gonzalez-Cuevas G, Moreno G, Navarro M. The pharmacology of the endocannabinoid system: functional and structural interactions with other neurotransmitter systems and their repercussions in behavioral addiction. Addict Biol. 2008;13:160–187. doi: 10.1111/j.1369-1600.2008.00105.x. [DOI] [PubMed] [Google Scholar]
- Lutz B. Endocannabinoid signals in the control of emotion. Curr Opin Pharmacol. 2009;9:46–52. doi: 10.1016/j.coph.2008.12.001. [DOI] [PubMed] [Google Scholar]
- Maccarrone M, Attina M, Cartoni A, Bari M, Finazzi-Agro A. Gas chromatography-mass spectrometry analysis of endogenous cannabinoids in healthy and tumoral human brain and human cells in culture. J Neurochem. 2001;76:594–601. doi: 10.1046/j.1471-4159.2001.00092.x. [DOI] [PubMed] [Google Scholar]
- Maccarrone M, Rossi S, Bari M, De Chiara V, Fezza F, Musella A, et al. Anandamide inhibits metabolism and physiological actions of 2-arachidonoylglycerol in the striatum. Nat Neurosci. 2008;11:152–159. doi: 10.1038/nn2042. [DOI] [PubMed] [Google Scholar]
- Maccarrone M, De Chiara V, Gasperi V, Viscomi MT, Rossi S, Oddi S, et al. Lipid rafts regulate 2-arachidonoylglycerol metabolism and physiological activity in the striatum. J Neurochem. 2009;109:371–381. doi: 10.1111/j.1471-4159.2009.05948.x. [DOI] [PubMed] [Google Scholar]
- Maidment NL, Evans CJ. Measurement of extracellular neuropeptides in the brain: microdialysis linked to solid-phase radioimmunoassays with sub-femtomole limits of detection. In: Robinson TE, Justice JB Jr, editors. Microdialysis in the Neurosciences. Amsterdam: Elsevier; 1991. pp. 275–303. [Google Scholar]
- Maione S, Bisogno T, de Novellis V, Palazzo E, Cristino L, Valenti M, et al. Elevation of endocannabinoid levels in the ventrolateral periaqueductal grey through inhibition of fatty acid amide hydrolase affects descending nociceptive pathways via both cannabinoid receptor type 1 and transient receptor potential vanilloid type-1 receptors. J Pharmacol Exp Ther. 2006;316:969–982. doi: 10.1124/jpet.105.093286. [DOI] [PubMed] [Google Scholar]
- Makriyannis A, Guo J, Tian X. Albumin enhances the diffusion of lipophilic drugs into the membrane bilayer. Life Sci. 2005a;77:1605–1611. doi: 10.1016/j.lfs.2005.05.008. [DOI] [PubMed] [Google Scholar]
- Makriyannis A, Tian X, Guo J. How lipophilic cannabinergic ligands reach their receptor sites. Prostaglandins Other Lipid Mediat. 2005b;77:210–218. doi: 10.1016/j.prostaglandins.2004.01.010. [DOI] [PubMed] [Google Scholar]
- Malinen H, Lehtonen M, Hyytia P. Modulation of brain endocannabinoid levels by voluntary alcohol consumption in alcohol-preferring AA rats. Alcohol Clin Exp Res. 2009;33:1711–1720. doi: 10.1111/j.1530-0277.2009.01008.x. [DOI] [PubMed] [Google Scholar]
- Marinelli S, Pacioni S, Bisogno T, Di Marzo V, Prince DA, Huguenard JR, et al. The endocannabinoid 2-arachidonoylglycerol is responsible for the slow self-inhibition in neocortical interneurons. J Neurosci. 2008;28:13532–13541. doi: 10.1523/JNEUROSCI.0847-08.2008. [DOI] [PMC free article] [PubMed] [Google Scholar]
- Marinelli S, Pacioni S, Cannich A, Marsicano G, Bacci A. Self-modulation of neocortical pyramidal neurons by endocannabinoids. Nat Neurosci. 2009;12:1488–1490. doi: 10.1038/nn.2430. [DOI] [PubMed] [Google Scholar]
- Marion J, Wolfe LS. Origin of the arachidonic acid released post-mortem in rat forebrain. Biochim Biophys Acta. 1979;574:25–32. doi: 10.1016/0005-2760(79)90080-8. [DOI] [PubMed] [Google Scholar]
- Matias I, Vergoni AV, Petrosino S, Ottani A, Pocai A, Bertolini A, et al. Regulation of hypothalamic endocannabinoid levels by neuropeptides and hormones involved in food intake and metabolism: insulin and melanocortins. Neuropharmacology. 2008;54:206–212. doi: 10.1016/j.neuropharm.2007.06.011. [DOI] [PubMed] [Google Scholar]
- Maysinger D, Herrera-Marschitz M, Carlsson A, Garofalo L, Cuello AC, Ungerstedt U. Striatal and cortical acetylcholine release in vivo in rats with unilateral decortication: effects of treatment with monosialoganglioside GM1. Brain Res. 1988;461:355–360. doi: 10.1016/0006-8993(88)90267-3. [DOI] [PubMed] [Google Scholar]
- Mechoulam R, Shohami E. Endocannabinoids and traumatic brain injury. Mol Neurobiol. 2007;36:68–74. doi: 10.1007/s12035-007-8008-6. [DOI] [PubMed] [Google Scholar]
- Mechoulam R, Ben-Shabat S, Hanus L, Ligumsky M, Kaminski NE, Schatz AR, et al. Identification of an endogenous 2-monoglyceride, present in canine gut, that binds to cannabinoid receptors. Biochem Pharmacol. 1995;50:83–90. doi: 10.1016/0006-2952(95)00109-d. [DOI] [PubMed] [Google Scholar]
- Mechoulam R, Panikashvili D, Shohami E. Cannabinoids and brain injury: therapeutic implications. Trends Mol Med. 2002;8:58–61. doi: 10.1016/s1471-4914(02)02276-1. [DOI] [PubMed] [Google Scholar]
- Moreira FA, Kaiser N, Monory K, Lutz B. Reduced anxiety-like behaviour induced by genetic and pharmacological inhibition of the endocannabinoid-degrading enzyme fatty acid amide hydrolase (FAAH) is mediated by CB1 receptors. Neuropharmacology. 2008;54:141–150. doi: 10.1016/j.neuropharm.2007.07.005. [DOI] [PubMed] [Google Scholar]
- Muccioli GG, Stella N. An optimized GC-MS method detects nanomolar amounts of anandamide in mouse brain. Anal Biochem. 2008;373:220–228. doi: 10.1016/j.ab.2007.09.030. [DOI] [PMC free article] [PubMed] [Google Scholar]
- Naidu PS, Varvel SA, Ahn K, Cravatt BF, Martin BR, Lichtman AH. Evaluation of fatty acid amide hydrolase inhibition in murine models of emotionality. Psychopharmacology (Berl) 2007;192:61–70. doi: 10.1007/s00213-006-0689-4. [DOI] [PubMed] [Google Scholar]
- Natarajan V, Schmid PC, Schmid HH. N-acylethanolamine phospholipid metabolism in normal and ischemic rat brain. Biochim Biophys Acta. 1986;878:32–41. doi: 10.1016/0005-2760(86)90341-3. [DOI] [PubMed] [Google Scholar]
- Ohno-Shosaku T, Hashimotodani Y, Maejima T, Kano M. Calcium signaling and synaptic modulation: regulation of endocannabinoid-mediated synaptic modulation by calcium. Cell Calcium. 2005;38:369–374. doi: 10.1016/j.ceca.2005.06.014. [DOI] [PubMed] [Google Scholar]
- Ohvo H, Slotte JP. Cyclodextrin-mediated removal of sterols from monolayers: effects of sterol structure and phospholipids on desorption rate. Biochemistry. 1996;35:8018–8024. doi: 10.1021/bi9528816. [DOI] [PubMed] [Google Scholar]
- Oosterkamp AJ, Gelpi E, Abian J. Quantitative peptide bioanalysis using column-switching nano liquid chromatography/mass spectrometry. J Mass Spectrom. 1998;33:976–983. doi: 10.1002/(SICI)1096-9888(1998100)33:10<976::AID-JMS710>3.0.CO;2-7. [DOI] [PubMed] [Google Scholar]
- Opitz CA, Rimmerman N, Zhang Y, Mead LE, Yoder MC, Ingram DA, et al. Production of the endocannabinoids anandamide and 2-arachidonoylglycerol by endothelial progenitor cells. FEBS Lett. 2007;581:4927–4931. doi: 10.1016/j.febslet.2007.09.032. [DOI] [PMC free article] [PubMed] [Google Scholar]
- Orio L, Edwards S, George O, Parsons LH, Koob GF. A role for the endocannabinoid system in the increased motivation for cocaine in extended-access conditions. J Neurosci. 2009;29:4846–4857. doi: 10.1523/JNEUROSCI.0563-09.2009. [DOI] [PMC free article] [PubMed] [Google Scholar]
- Osborne PG, O'Connor WT, Drew KL, Ungerstedt U. An in vivo microdialysis characterization of extracellular dopamine and GABA in dorsolateral striatum of awake freely moving and halothane anaesthetised rats. J Neurosci Methods. 1990;34:99–105. doi: 10.1016/0165-0270(90)90047-j. [DOI] [PubMed] [Google Scholar]
- Osei-Hyiaman D, Depetrillo M, Harvey-White J, Bannon AW, Cravatt BF, Kuhar MJ, et al. Cocaine- and amphetamine-related transcript is involved in the orexigenic effect of endogenous anandamide. Neuroendocrinology. 2005;81:273–282. doi: 10.1159/000087925. [DOI] [PubMed] [Google Scholar]
- Palazzo E, de Novellis V, Petrosino S, Marabese I, Vita D, Giordano C, et al. Neuropathic pain and the endocannabinoid system in the dorsal raphe: pharmacological treatment and interactions with the serotonergic system. Eur J Neurosci. 2006;24:2011–2020. doi: 10.1111/j.1460-9568.2006.05086.x. [DOI] [PubMed] [Google Scholar]
- Palkovits M, Harvey-White J, Liu J, Kovacs ZS, Bobest M, Lovas G, et al. Regional distribution and effects of postmortal delay on endocannabinoid content of the human brain. Neuroscience. 2008;152:1032–1039. doi: 10.1016/j.neuroscience.2008.01.034. [DOI] [PMC free article] [PubMed] [Google Scholar]
- Pandey R, Mousawy K, Nagarkatti M, Nagarkatti P. Endocannabinoids and immune regulation. Pharmacol Res. 2009;60:85–92. doi: 10.1016/j.phrs.2009.03.019. [DOI] [PMC free article] [PubMed] [Google Scholar]
- Panikashvili D, Simeonidou C, Ben-Shabat S, Hanus L, Breuer A, Mechoulam R, et al. An endogenous cannabinoid (2-AG) is neuroprotective after brain injury. Nature. 2001;413:527–531. doi: 10.1038/35097089. [DOI] [PubMed] [Google Scholar]
- Parolaro D, Rubino T. The role of the endogenous cannabinoid system in drug addiction. Drug News Perspect. 2008;21:149–157. [PubMed] [Google Scholar]
- Patel S, Rademacher DJ, Hillard CJ. Differential regulation of the endocannabinoids anandamide and 2-arachidonylglycerol within the limbic forebrain by dopamine receptor activity. J Pharmacol Exp Ther. 2003;306:880–888. doi: 10.1124/jpet.103.054270. [DOI] [PubMed] [Google Scholar]
- Patel S, Roelke CT, Rademacher DJ, Cullinan WE, Hillard CJ. Endocannabinoid signaling negatively modulates stress-induced activation of the hypothalamic-pituitary-adrenal axis. Endocrinology. 2004;145:5431–5438. doi: 10.1210/en.2004-0638. [DOI] [PubMed] [Google Scholar]
- Patel S, Carrier EJ, Ho W-SV, Rademacher DJ, Cunningham S, Reddy DS, et al. The postmortal accumulation of brain N-arachidonylethanolamine (anandamide) is dependent upon fatty acid amide hyrdolase activity. J Lipid Res. 2005;46:342–349. doi: 10.1194/jlr.M400377-JLR200. [DOI] [PubMed] [Google Scholar]
- Pertwee R, Griffin G, Hanus L, Mechoulam R. Effects of two endogenous fatty acid ethanolamides on mouse vasa deferentia. Eur J Pharmacol. 1994;259:115–120. doi: 10.1016/0014-2999(94)90499-5. [DOI] [PubMed] [Google Scholar]
- Petrosino S, Palazzo E, de Novellis V, Bisogno T, Rossi F, Maione S, et al. Changes in spinal and supraspinal endocannabinoid levels in neuropathic rats. Neuropharmacology. 2007;52:415–422. doi: 10.1016/j.neuropharm.2006.08.011. [DOI] [PubMed] [Google Scholar]
- Porter AC, Sauer JM, Knierman MD, Becker GW, Berna MJ, Bao J, et al. Characterization of a novel endocannabinoid, virodhamine, with antagonist activity at the CB1 receptor. J Pharmacol Exp Ther. 2002;301:1020–1024. doi: 10.1124/jpet.301.3.1020. [DOI] [PubMed] [Google Scholar]
- Re G, Barbero R, Miolo A, Di Marzo V. Palmitoylethanolamide, endocannabinoids and related cannabimimetic compounds in protection against tissue inflammation and pain: potential use in companion animals. Vet J. 2007;173:21–30. doi: 10.1016/j.tvjl.2005.10.003. [DOI] [PubMed] [Google Scholar]
- Richardson D, Ortori CA, Chapman V, Kendall DA, Barrett DA. Quantitative profiling of endocannabinoids and related compounds in rat brain using liquid chromatography-tandem electrospray ionization mass spectrometry. Anal Biochem. 2007;360:216–226. doi: 10.1016/j.ab.2006.10.039. [DOI] [PubMed] [Google Scholar]
- Rimmerman N, Hughes HV, Bradshaw HB, Pazos MX, Mackie K, Prieto AL, et al. Compartmentalization of endocannabinoids into lipid rafts in a dorsal root ganglion cell line. Br J Pharmacol. 2008;153:380–389. doi: 10.1038/sj.bjp.0707561. [DOI] [PMC free article] [PubMed] [Google Scholar]
- Rodal SK, Skretting G, Garred O, Vilhardt F, van Deurs B, Sandvig K. Extraction of cholesterol with methyl-beta-cyclodextrin perturbs formation of clathrin-coated endocytic vesicles. Mol Biol Cell. 1999;10:961–974. doi: 10.1091/mbc.10.4.961. [DOI] [PMC free article] [PubMed] [Google Scholar]
- Rodriguez de Fonseca F, Navarro M, Gomez R, Escuredo L, Nava F, Fu J, et al. An anorexic lipid mediator regulated by feeding. Nature. 2001;414:209–212. doi: 10.1038/35102582. [DOI] [PubMed] [Google Scholar]
- Roy S, Rieutord A, Zhou JY, Baillet A, Prognon P, Chaminade P. The benefit of the retrofitting of a conventional LC system to micro LC: a practical evaluation in the field of bioanalysis with fluorimetric detection. Biomed Chromatogr. 2003;17:297–305. doi: 10.1002/bmc.239. [DOI] [PubMed] [Google Scholar]
- Rubio M, McHugh D, Fernandez-Ruiz J, Bradshaw H, Walker JM. Short-term exposure to alcohol in rats affects brain levels of anandamide, other N-acylethanolamines and 2-arachidonoyl-glycerol. Neurosci Lett. 2007;421:270–274. doi: 10.1016/j.neulet.2007.05.052. [DOI] [PMC free article] [PubMed] [Google Scholar]
- Schabitz WR, Giuffrida A, Berger C, Aschoff A, Schwaninger M, Schwab S, et al. Release of fatty acid amides in a patient with hemispheric stroke: a microdialysis study. Stroke. 2002;33:2112–2114. doi: 10.1161/01.str.0000023491.63693.18. [DOI] [PubMed] [Google Scholar]
- Schmid PC, Krebsbach RJ, Perry SR, Dettmer TM, Maasson JL, Schmid HH. Occurrence and postmortem generation of anandamide and other long-chain N-acylethanolamines in mammalian brain. FEBS Lett. 1995;375:117–120. doi: 10.1016/0014-5793(95)01194-j. [DOI] [PubMed] [Google Scholar]
- Schmid PC, Schwartz KD, Smith CN, Krebsbach RJ, Berdyshev EV, Schmid HH. A sensitive endocannabinoid assay. The simultaneous analysis of N-acylethanolamines and 2-monoacylglycerols. Chem Phys Lipids. 2000;104:185–191. doi: 10.1016/s0009-3084(99)00124-3. [DOI] [PubMed] [Google Scholar]
- Schneiderman E, Stalcup AM. Cyclodextrins: a versatile tool in separation science. J Chromatogr B Biomed Sci Appl. 2000;745:83–102. doi: 10.1016/s0378-4347(00)00057-8. [DOI] [PubMed] [Google Scholar]
- Schoffelmeer AN, Hogenboom F, Wardeh G, De Vries TJ. Interactions between CB1 cannabinoid and mu opioid receptors mediating inhibition of neurotransmitter release in rat nucleus accumbens core. Neuropharmacology. 2006;51:773–781. doi: 10.1016/j.neuropharm.2006.05.019. [DOI] [PubMed] [Google Scholar]
- Seillier A, Advani T, Cassano T, Hensler JG, Giuffrida A. Inhibition of fatty-acid amide hydrolase and CB1 receptor antagonism differentially affect behavioural responses in normal and PCP-treated rats. Int J Neuropsychopharmacol. 2009:1–14. doi: 10.1017/S146114570999023X. [DOI] [PubMed] [Google Scholar]
- Solinas M, Goldberg SR, Piomelli D. The endocannabinoid system in brain reward processes. Br J Pharmacol. 2008;154:369–383. doi: 10.1038/bjp.2008.130. [DOI] [PMC free article] [PubMed] [Google Scholar]
- Soria-Gomez E, Matias I, Rueda-Orozco PE, Cisneros M, Petrosino S, Navarro L, et al. Pharmacological enhancement of the endocannabinoid system in the nucleus accumbens shell stimulates food intake and increases c-Fos expression in the hypothalamus. Br J Pharmacol. 2007;151:1109–1116. doi: 10.1038/sj.bjp.0707313. [DOI] [PMC free article] [PubMed] [Google Scholar]
- Sperlagh B, Windisch K, Ando RD, Sylvester Vizi E. Neurochemical evidence that stimulation of CB1 cannabinoid receptors on GABAergic nerve terminals activates the dopaminergic reward system by increasing dopamine release in the rat nucleus accumbens. Neurochem Int. 2009;54:452–457. doi: 10.1016/j.neuint.2009.01.017. [DOI] [PubMed] [Google Scholar]
- Stella N. Endocannabinoid signaling in microglial cells. Neuropharmacology. 2009;56(Suppl. 1):244–253. doi: 10.1016/j.neuropharm.2008.07.037. [DOI] [PMC free article] [PubMed] [Google Scholar]
- Stella N, Piomelli D. Receptor-dependent formation of endogenous cannabinoids in cortical neurons. Eur J Pharmacol. 2001;425:189–196. doi: 10.1016/s0014-2999(01)01182-7. [DOI] [PubMed] [Google Scholar]
- Stella N, Schweitzer P, Piomelli D. A second endogenous cannabinoid that modulates long-term potentiation. Nature. 1997;388:773–778. doi: 10.1038/42015. [DOI] [PubMed] [Google Scholar]
- Stensas S, Stensas L. The reaction of the cerebral cortex to chronically implanted plastic needles. Acta Neuropathol. 1976;35:187–203. [PubMed] [Google Scholar]
- Sugiura T, Kondo S, Sukagawa A, Nakane S, Shinoda A, Itoh K, et al. 2-Arachidonoylglycerol: a possible endogenous cannabinoid receptor ligand in brain. Biochem Biophys Res Commun. 1995;215:89–97. doi: 10.1006/bbrc.1995.2437. [DOI] [PubMed] [Google Scholar]
- Sugiura T, Yoshinaga N, Waku K. Rapid generation of 2-arachidonoylglycerol, an endogenous cannabinoid receptor ligand, in rat brain after decapitation. Neurosci Lett. 2001;297:175–178. doi: 10.1016/s0304-3940(00)01691-8. [DOI] [PubMed] [Google Scholar]
- Tan B, Yu YW, Monn MF, Hughes HV, O'Dell DK, Walker JM. Targeted lipidomics approach for endogenous N-acyl amino acids in rat brain tissue. J Chromatogr B Analyt Technol Biomed Life Sci. 2009;877:2890–2894. doi: 10.1016/j.jchromb.2009.01.002. [DOI] [PubMed] [Google Scholar]
- Timmerman W, Westerink BH. Brain microdialysis of GABA and glutamate: what does it signify? Synapse. 1997;27:242–261. doi: 10.1002/(SICI)1098-2396(199711)27:3<242::AID-SYN9>3.0.CO;2-D. [DOI] [PubMed] [Google Scholar]
- Tossman U, Ungerstedt U. Microdialysis in the study of extracellular levels of amino acids in the rat brain. Acta Physiol Scand. 1986;128:9–14. doi: 10.1111/j.1748-1716.1986.tb07943.x. [DOI] [PubMed] [Google Scholar]
- Uekama K, Hirayama F, Irie T. Cyclodextrin Drug Carrier Systems. Chem Rev. 1998;98:2045–2076. doi: 10.1021/cr970025p. [DOI] [PubMed] [Google Scholar]
- Valenti M, Vigano D, Casico MG, Rubino T, Steardo L, Parolaro D, et al. Differential diurnal variations of anandamide and 2-arachidonoyl-glycerol levels in rat brain. Cell Mol Life Sci. 2004;61:945–950. doi: 10.1007/s00018-003-3453-5. [DOI] [PMC free article] [PubMed] [Google Scholar]
- Vigano D, Grazia Cascio M, Rubino T, Fezza F, Vaccani A, Di Marzo V, et al. Chronic morphine modulates the contents of the endocannabinoid, 2-arachidonoyl glycerol, in rat brain. Neuropsychopharmacology. 2003;28:1160–1167. doi: 10.1038/sj.npp.1300117. [DOI] [PubMed] [Google Scholar]
- Villanueva A, Yilmaz SM, Millington WR, Cutrera RA, Stouffer DG, Parsons LH, et al. Central cannabinoid 1 receptor antagonist administration prevents endotoxic hypotension affecting norepinephrine release in the preoptic anterior hypothalamic area. Shock. 2009;32:614–620. doi: 10.1097/SHK.0b013e3181a4fd8f. [DOI] [PMC free article] [PubMed] [Google Scholar]
- Viveros MP, de Fonseca FR, Bermudez-Silva FJ, McPartland JM. Critical role of the endocannabinoid system in the regulation of food intake and energy metabolism, with phylogenetic, developmental, and pathophysiological implications. Endocr Metab Immune Disord Drug Targets. 2008;8:220–230. doi: 10.2174/187153008785700082. [DOI] [PubMed] [Google Scholar]
- Wages SA, Church WH, Justice JB., Jr Sampling considerations for on-line microbore liquid chromatography of brain dialysate. Anal Chem. 1986;58:1649–1656. doi: 10.1021/ac00121a012. [DOI] [PubMed] [Google Scholar]
- Walker JM, Huang SM, Strangman NM, Tsou K, Sanudo-Pena MC. Pain modulation by release of the endogenous cannabinoid anandamide. Proc Natl Acad Sci USA. 1999;96:12198–12203. doi: 10.1073/pnas.96.21.12198. [DOI] [PMC free article] [PubMed] [Google Scholar]
- Walter L, Dinh T, Stella N. ATP induces a rapid and pronounced increase in 2-arachidonoylglycerol production by astrocytes, a response limited by monoacylglycerol lipase. J Neurosci. 2004;24:8068–8074. doi: 10.1523/JNEUROSCI.2419-04.2004. [DOI] [PMC free article] [PubMed] [Google Scholar]
- Wang Y, Liu Y, Sarker KP, Nakashima M, Serizawa T, Kishida A, et al. Polymyxin B binds to anandamide and inhibits its cytotoxic effect. FEBS Lett. 2000;470:151–155. doi: 10.1016/s0014-5793(00)01313-2. [DOI] [PubMed] [Google Scholar]
- Wang Y, Liu Y, Ito Y, Hashiguchi T, Kitajima I, Yamakuchi M, et al. Simultaneous measurement of anandamide and 2-arachidonoylglycerol by polymyxin B-selective adsorption and subsequent high-performance liquid chromatography analysis: increase in endogenous cannabinoids in the sera of patients with endotoxic shock. Anal Biochem. 2001;294:73–82. doi: 10.1006/abio.2001.5015. [DOI] [PubMed] [Google Scholar]
- Westerink BH, Hofsteede HM, Damsma G, de Vries JB. The significance of extracellular calcium for the release of dopamine, acetylcholine and amino acids in conscious rats, evaluated by brain microdialysis. Naunyn Schmiedebergs Arch Pharmacol. 1988;337:373–378. doi: 10.1007/BF00169526. [DOI] [PubMed] [Google Scholar]
- Williams J, Wood J, Pandarinathan L, Karanian DA, Bahr BA, Vouros P, et al. Quantitative method for the profiling of the endocannabinoid metabolome by LC-atmospheric pressure chemical ionization-MS. Anal Chem. 2007;79:5582–5593. doi: 10.1021/ac0624086. [DOI] [PubMed] [Google Scholar]
- Wilson RI, Nicoll RA. Endocannabinoid signaling in the brain. Science. 2002;296:678–682. doi: 10.1126/science.1063545. [DOI] [PubMed] [Google Scholar]
- Witting A, Walter L, Wacker J, Moller T, Stella N. P2X7 receptors control 2-arachidonoylglycerol production by microglial cells. Proc Natl Acad Sci USA. 2004;101:3214–3219. doi: 10.1073/pnas.0306707101. [DOI] [PMC free article] [PubMed] [Google Scholar]
- Woodroofe MN, Sarna GS, Wadhwa M, Hayes GM, Loughlin AJ, Tinker A, et al. Detection of interleukin-1 and interleukin-6 in adult rat brain, following mechanical injury, by in vivo microdialysis: evidence of a role for microglia in cytokine production. J Neuroimmunol. 1991;33:227–236. doi: 10.1016/0165-5728(91)90110-s. [DOI] [PubMed] [Google Scholar]
- Wubbolts R, Leckie RS, Veenhuizen PT, Schwarzmann G, Mobius W, Hoernschemeyer J, et al. Proteomic and biochemical analyses of human B cell-derived exosomes. Potential implications for their function and multivesicular body formation. J Biol Chem. 2003;278:10963–10972. doi: 10.1074/jbc.M207550200. [DOI] [PubMed] [Google Scholar]
- Yagen B, Burstein S. Novel and sensitive method for the detection of anandamide by the use of its dansyl derivative. J Chromatogr B Biomed Sci Appl. 2000;740:93–99. doi: 10.1016/s0378-4347(00)00029-3. [DOI] [PubMed] [Google Scholar]
- Yang HY, Karoum F, Felder C, Badger H, Wang TC, Markey SP. GC/MS analysis of anandamide and quantification of N-arachidonoylphosphatidylethanolamides in various brain regions, spinal cord, testis, and spleen of the rat. J Neurochem. 1999;72:1959–1968. doi: 10.1046/j.1471-4159.1999.0721959.x. [DOI] [PubMed] [Google Scholar]
- You ZB, Herrera-Marschitz M, Brodin E, Meana JJ, Morino P, Hokfelt T, et al. On the origin of striatal cholecystokinin release: studies with in vivo microdialysis. J Neurochem. 1994a;62:76–85. doi: 10.1046/j.1471-4159.1994.62010076.x. [DOI] [PubMed] [Google Scholar]
- You ZB, Nylander I, Herrera-Marschitz M, O'Connor WT, Goiny M, Terenius L. The striatonigral dynorphin pathway of the rat studied with in vivo microdialysis – I. Effects of K(+)-depolarization, lesions and peptidase inhibition. Neuroscience. 1994b;63:415–425. doi: 10.1016/0306-4522(94)90539-8. [DOI] [PubMed] [Google Scholar]