Abstract
Ion-to-magnetohydrodynamic scale physics of the transverse velocity shear layer and associated Kelvin–Helmholtz instability (KHI) in a homogeneous, collisionless plasma are investigated by means of full particle simulations. The shear layer is broadened to reach a kinetic equilibrium when its initial thickness is close to the gyrodiameter of ions crossing the layer, namely, of ion-kinetic scale. The broadened thickness is larger in B⋅Ω<0 case than in B⋅Ω>0 case, where Ω is the vorticity at the layer. This is because the convective electric field, which points out of (into) the layer for B⋅Ω<0 (B⋅Ω>0), extends (reduces) the gyrodiameters. Since the kinetic equilibrium is established before the KHI onset, the KHI growth rate depends on the broadened thickness. In the saturation phase of the KHI, the ion vortex flow is strengthened (weakened) for B⋅Ω<0 (B⋅Ω>0), due to ion centrifugal drift along the rotational plasma flow. In ion inertial scale vortices, this drift effect is crucial in altering the ion vortex size. These results indicate that the KHI at Mercury-like ion-scale magnetospheric boundaries could show clear dawn-dusk asymmetries in both its linear and nonlinear growth.
INTRODUCTION
The Kelvin–Helmholtz instability (KHI) is a well-known hydrodynamic instability that grows in a velocity shear layer. The KHI has been considered as one of the most important processes for causing transport of momentum and energy or transport and mixing of plasma in collisionless space plasma systems, such as across a planetary magnetospheric boundary,1 in solar wind,2 and in a galaxy cluster.3
Linear analyses under magnetohydrodynamic (MHD) approximation have shown that the KHI tends to grow easily when the magnetic field component perpendicular to the KHI k-vector dominates the parallel component (B‖⪡B⊥).4, 5 This is because magnetic field tension of the parallel field suppresses the growth of the KHI. Indeed, in situ spacecraft observations around the Earth’s low-latitude magnetospheric boundary have shown that KH waves tend to be observed when the northward magnetic field component dominates in both regions outside and inside the boundary.6, 7 Here, the northward direction is almost perpendicular to the direction of the KHI k-vector. These results imply the importance of understanding the role of the KHI induced in transverse shear layers where the magnetic field is perpendicular to the k-vector.
Since most of the KH waves observed around the Earth’s magnetospheric boundary were of MHD-scale, a number of numerical simulations have been performed of a MHD-scale KH vortex in the transverse case.8, 9, 10 Here, the MHD-scale vortex means that induced in a MHD-scale velocity shear layer in which D0>ρi, where D0 is the initial half thickness of the shear layer and ρi is thermal ion gyroradius. On the other hand, a KH wave could be induced also in a smaller-scale (including ion-kinetic scale) velocity shear layer as expected at Mercury’s magnetospheric boundary. Indeed, under northward interplanetary magnetic field (IMF) condition during its first flyby of Mercury, the Messenger spacecraft observed short wavelength (500–5000 km) magnetic field waves at Mercury’s magnetospheric boundary that may be associated with KH mode waves.11, 12 Thus, for better understanding of the KHI especially at the planetary magnetospheric boundary, it is necessary to investigate the physics of the KHI induced in the velocity shear layer not only of MHD-scale but also of ion-kinetic scale.
An important question concerning the ion-kinetic scale transverse velocity shear layer is how an equilibrium is established.13, 14, 15 Using an electrostatic Vlasov approach, Cai et al.14 have shown that the ion density profile in the transverse velocity shear layer in kinetic equilibrium becomes different from the one predicted by a MHD model, due to the convective electric field effect on the ion gyromotion. They have also shown that this convective electric field effect depends largely on the polarity of B⋅Ω, where Ω=∇×V is the vorticity at the velocity shear layer. These results regarding the kinetic equilibrium were confirmed in this paper using our electromagnetic full particle (proton and electron particle) simulations as well. Furthermore, in this paper we will demonstrate that the convective electric field effect also results in broadening of the ion-kinetic scale velocity shear layer. In Sec. 3, we show our particle simulation results regarding such a complex kinetic equilibrium of the shear layer (Secs. 3A, 3B) and discuss how the modified kinetic equilibrium affects the linear growth of the KHI (Sec. 3C).
Regarding nonlinear evolution of the KHI induced in the ion-kinetic scale transverse velocity shear layer, Huba16 has performed finite Larmor radius (FLR) MHD simulations, which include the first order finite gyroradius effects. He found that gyroradius effects on the development of the KH vortex become larger as D0 approaches ρi. Besides several particle simulations of ion-kinetic scale15, 17 and MHD-scale,9, 18 KH vortices in the transverse case have been performed. None of these studies, however, has systematically investigated spatial scale (simultaneously including ion-kinetic scale and MHD-scale) dependence of the evolution process of the KH vortex. Thus, this study presents the first full particle simulations systematically investigating the ion-kinetic scale and MHD-scale physics of the KH vortex induced in the transverse velocity shear layer (Sec. 4). The results newly show that the drift motion of protons, caused by the centrifugal force acting on the vortex flow, affects the vortex flow itself, and this drift effect becomes larger as the vortex size becomes smaller (Secs. 4B, 4C).
In Sec. 5A, we summarize our new results on the kinetic equilibrium of the transverse shear layer and the subsequent evolution of the KHI. Finally, in Secs. 5B, 5C we discuss applications of our results.
SIMULATION SETTING
We have performed two-dimensional and 1∕2-dimensional (two spatial dimensions, three vector components) relativistic electromagnetic particle simulations which retain the full dynamics of electrons and ions. The basic equations used are as follows:
| (1) |
| (2) |
| (3) |
| (4) |
where the subscript j represents each particle, c is the light speed, q is particle charge, m is particle mass, and γ is the Lorentz factor. In this study, we consider only protons (hereafter called “ions”) and electrons as the particles. The electric and magnetic fields are obtained by integrating the Maxwell equations, and the particle velocity is obtained by integrating the relativistic equation of motion. The particle-in-cell (PIC) method is used when the current density J and the charge density on each spatial grid are computed from the particle data, and also when the electric and magnetic field values at each particle position are obtained. More details of the PIC method are described in Ref. 19. Note that we use the relativistic equation of motion due to the computational limitation; the full particle PIC simulation requires that the size of the spatial grid is shorter than the electron Debye length λDe (=λe⋅Vthe∕c) in order to avoid numerical grid heating. For treating MHD-scale (⪢λi>λe) dynamics, therefore, the electron thermal speed Vthe needs to be set close to the light speed (in this paper, Vthe∼0.4c). In order to accurately solve the motion of such quasirelativistic electrons, it is necessary to consider the Lorentz factor. In this paper, however, essential results are not affected by such electrons as shown in Secs. 3, 4.
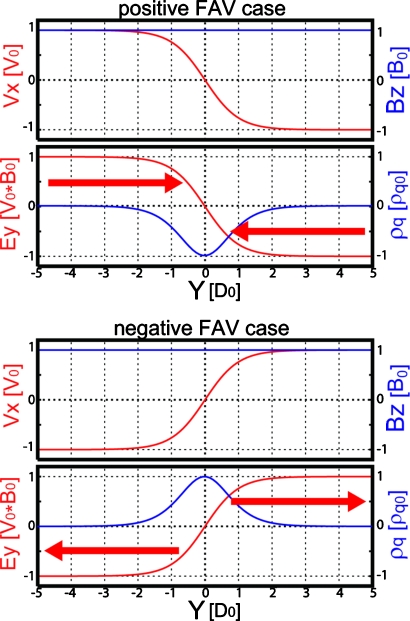
In this study, we focus on fundamental situations in which the initial density n0, temperature, and magnitude of the magnetic field B0 are uniform. The ion-to-electron temperature ratio Ti∕Te=1.0. The initial magnetic field is perpendicular to the flow direction (X-direction). To form the velocity shear layer, particles are initialized with shifted Maxwellian velocity distributions having a bulk velocity VX0=±V0∕2⋅tanh(Y∕D0), where D0 is the initial half thickness of the velocity shear layer and V0 is the initial velocity jump across the shear layer. The −V0 (+V0) case corresponds to the field-aligned vorticity (FAV) B⋅Ω at the shear layer being positive (negative) and is called the “positive (negative) FAV case.”
In order to sustain the shear flow, it is necessary to set up a convective electric field EY0=−VX0⋅B0. Here, it should be noted that the nonuniform convective electric field breaks the charge neutrality to satisfy the Gauss’s law as follows:
| (5) |
In our simulations, ions are loaded uniformly and electrons are loaded nonuniformly to satisfy Eq. 5.20 Figure 1 shows the initial profiles of the bulk flow velocity, transverse magnetic field component, convective electric field, and net charge density normalized by the maximum initial charge density ρq0=1∕4π[∇⋅E]max in the positive FAV (−V0) and negative FAV (+V0) cases. Note that the convective electric field in the positive (negative) FAV case points into (out of) the shear layer as illustrated by red arrows in Fig. 1.
Figure 1.
Initial profiles of the bulk flow velocity VX, transverse magnetic field component BZ, convective electric field EY, and net charge density ρq0=1∕4π[∇⋅E]max in the positive (upper) and negative (bottom) field-aligned vorticity (FAV) cases. The convective electric field directions are illustrated by arrows.
The ion-to-electron mass ratio M is set to be M=mi∕me=25 and the ratio between the electron plasma frequency and the gyrofrequency is set to be 1.0. The ion thermal speed and ion Alfven speed are set to be Vthi=0.19c and VAi=0.2c, respectively. The size of the spatial grid dx is set to be slightly shorter than λDe. The averaged particle number density is taken to be n0dx2=100. In this setting, the ion inertial length λi is 16dx and the gyroradius ρi for thermal ions is about 7.2dx. The system is periodic in the X-direction with its size equal to one wavelength of the KH mode LX=λKH (5λi to 80λi), and the conducting walls are located at the Y=±LX. The initial half thickness of the shear layer varies in the range between 0.25λi∼0.5ρi (ion-kinetic scale) and 2.0λi∼4ρi (MHD-scale). The initial velocity jump V0 is set to be 1.0VAi=0.2c unless otherwise noted. To initiate the KH mode, we add a small flow perturbation δViy=δVey=δV0⋅V0 exp[−Y∕D0]⋅sin(2πX∕LX), where δV0 is the amplitude of the initial perturbation. In this paper, δV0 is set to be 0.01 (we have confirmed that the essential results are not changed when δV0 varies in the range of 0.001≤δV0≤0.02).
Note that these numerical settings address only the so-called strong shear case ,14 and do not address the so-called weak shear case , in which in addition to the KHI, an ion wave around the ion-cyclotron frequency could be excited by the convective electric field.13, 21, 22 Here, . In the strong shear case, the strong convective electric field can produce a complex but kinetically rather stable equilibrium of the velocity shear layer as shown in Sec. 3.
EQUILIBRIUM OF VELOCITY SHEAR LAYERS
Kinetic equilibrium
First, we investigate kinetic equilibrium of the transverse velocity shear layer. The shifted Maxwellian distributions are used as initial particle settings. It means that the initial conditions are equivalent to the MHD equilibrium. The Maxwellian loading of the particles, however, provides only an approximate equilibrium, and previous kinetic studies have shown that the true equilibrium is established by the FLR effect.13, 14, 15 Cai et al.14 have shown that the orbit of ions crossing the velocity shear layer is altered by the convective electric field, and these ions produce a complex kinetic equilibrium as explained below.
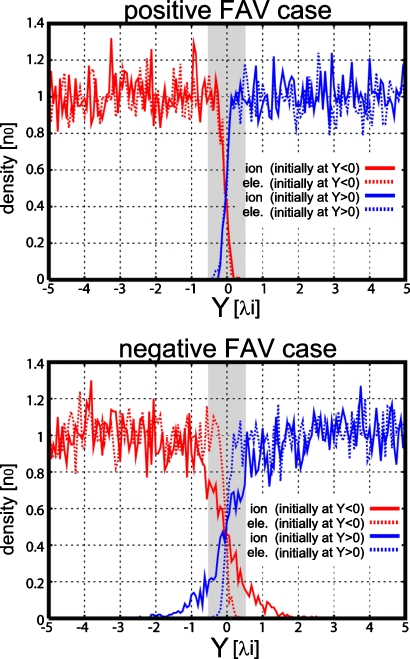
Figure 2 shows density profiles at T=10 Ωi−1 from the simulations for the ion-kinetic scale velocity shear layer case, in which D0=0.5λi∼ρi. Blue (red) lines show the density of particles which initially exist in the Y>0 (Y<0) region. Solid (dashed) lines show the ion (electron) density. In the negative FAV case, ions are mixed extensively over the initial thickness, while in the positive FAV case, ions are not mixed over the initial thickness. This is because in the negative FAV case, ions crossing the center of the shear layer are accelerated by the outward convective electric field, and thus the gyroradii of the ions are extended in the Y-direction. In the positive FAV case, in contrast, ions crossing the center of the shear layer are decelerated by the inward convective electric field, and thus the gyroradii of the ions shrink in the Y-direction. Here, the timescale for this ion mixing process ΔTmix is about one ion gyroperiod, that is, ΔTmix<10 Ωi−1.
Figure 2.
Density profiles at T=10 Ωi−1 from the simulations for the ion-kinetic scale shear layer case, in which D0=0.5λi∼ρi. Upper (bottom) panels show the results from the positive (negative) FAV case. Density of particles which initially exist in the Y>0 (Y<0) region are shown separately. Solid (dashed) lines show the ion (electron) density.
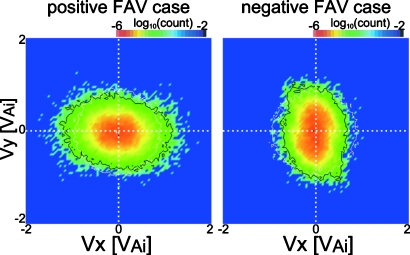
These convective electric field effects on the ion gyromotion also produce temperature anisotropy of ions in the shear layer. Figure 3 shows velocity distribution functions of ions existing in the middle of the shear layer (|Y|<2dx) after the above ion mixing process has occurred (at T=10 Ωi−1). There is a clear difference in the direction of the temperature anisotropy between the positive and negative FAV cases; in the positive (negative) FAV case, TiX>TiY (TiX<TiY). This difference results from the difference in the convective electric field direction: In the positive FAV case, since the ion gyromotion within the shear layer is restricted in the Y-direction by the inward electric field, that is, the trough structure of the potential [as shown in Fig. 7(a) in Caiet al.14], the ion temperature in the Y-direction is reduced. At the same time, since ions that fall into the trough of the potential reach, around the middle of the layer, a maximum or minimum y position on their gyro-orbits, the ion temperature there is enhanced in the X-direction. In the negative FAV case, in contrast, since the ion gyromotion within the shear layer is extended in the Y-direction by the outward electric field, that is, the peak structure of the potential [as shown in Fig. 7(b) in Cai et al.14], the ion temperature in the Y-direction is increased. At the same time, ions that move into the potential peak contribute to a reduction in the ion temperature in the X-direction. These results are consistent with past kinetic studies.13, 14, 15
Figure 3.
Ion velocity distribution functions in the middle of the shear layer (|Y|<2dx) at T=10 Ωi−1 in the positive (left) and negative (right) FAV cases. Black and white lines show contour lines of an equal count level at T=10 Ωi−1 and T=0 (initial), respectively.
True thickness of the velocity shear layer
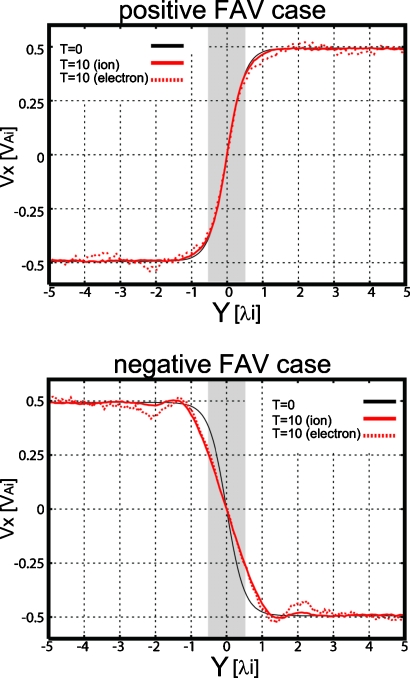
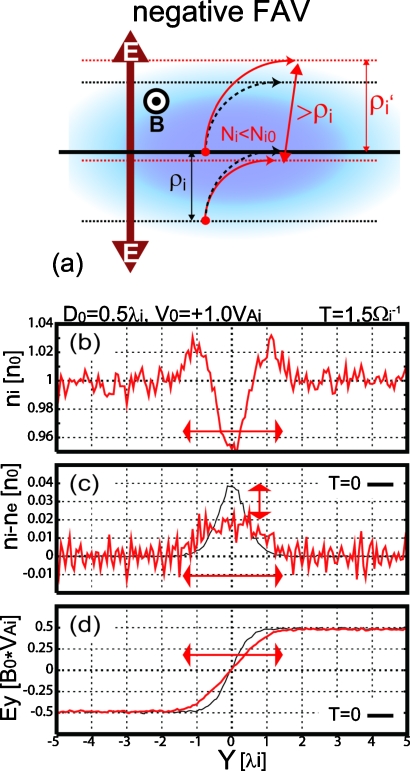
We discovered that the ion mixing by the modified ion gyromotion can lead to broadening of the velocity shear layer. Figure 4 shows the profiles at T=10 Ωi−1 of the VX component in the positive and negative FAV cases. Solid (dashed) lines are of ions (electrons). Only in the negative FAV case, both ion and electron velocity shear layers are clearly broadened. It should be noted that the broadened shear layer is collocated with the ion mixing region shown in Fig. 2. This broadening of the ion and electron shear layers can thus be explained as follows: (i) In the negative FAV case, since the gyroradii of ions crossing the center of the shear layer are extended and those of ions moving into the center of the layer shrink by the diverging convective electric field, the distance between ions at tends to be extended, where is the extended gyroradius for thermal ions [Fig. 5a]. Therefore, the density at decreases [Fig. 5b]. This result is qualitatively consistent with the past kinetic study [see Fig. 3h in Cai et al.14]. (ii) The ion density depletion flattens the peak structure of the charge density, leading its thickness to be the ion diameter [Fig. 5c]. (iii) The flattening of the charge density structure also corresponds to the broadening of the convective electric field structure [Fig. 5d]. (iv) Both ions and electrons are convected by the modified electric field, and consequently both ion and electron shear layers become broadened. Since the thickness of the ion mixing region corresponds to the extended ion gyroradius as shown in Sec. 3A, the shear layer is broadened to the thickness of the ion mixing region. From the potential structure point of view, the density depletion corresponds to the exclusion of ions from the potential peak, and the shear layer broadening corresponds to the flattening of the potential peak structure. In the positive FAV case, on the other hand, the ion density in the shear layer increases and this ion density increase can also lead to the broadening of the shear layer. However, since the ion mixing region is thinner than in the negative FAV case, the shear layer does not broaden as extensively as in the negative FAV case.
Figure 4.
Profiles at T=10 Ωi−1 of the VX component in the positive (upper) and negative (bottom) FAV cases. Solid (dashed) lines are of ions (electrons). Shaded regions show the initial velocity shear layer.
Figure 5.
(Upper) Illustration of representative orbits of ions, one crossing and the other moving toward the center of the shear layer, from the initial state until a quarter of ion gyroperiod in the negative FAV case (red solid arrows) and no shearing flow case (black dashed arrows). (Below) Profiles at T=1.5 Ωi−1 (∼a quarter of ion gyroperiod) of ion density (b), difference between ion and electron densities (c), and electric field EY component (d) in the D0=0.5 and negative FAV case. Narrow lines in Figs. 5c, 5d show initial profiles of (ni−ne) and EY, respectively.
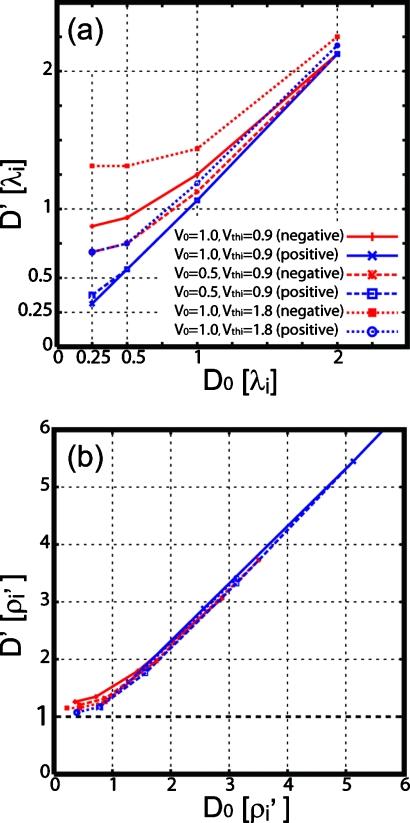
Figure 6a shows the thickness at T=10 Ωi−1 of the broadened shear layer D′ versus the initial thickness D0 for 24 cases in which changed are the initial shear layer thickness D0 (=0.25,0.5,1.0,2.0), shearing flow speed V0 (=0.5,1.0), and ion thermal speed Vthi (=0.9,1.8) (we have confirmed that for all cases, the time ΔTmix needed for the kinetic equilibrium to be accomplished is always about one ion gyroperiod, that is, ΔTmix<10 Ωi−1). Here, D′ is estimated by fitting ViY to the hyperbolic tangent function. Solid lines show the results from V0=VAi and Vthi=0.9VAi cases including the results discussed in Secs. 3A, 3B. Dashed lines show the V0=0.5VAi and Vthi=0.9VAi cases, and dotted lines show the V0=VAi and Vthi=1.8VAi cases. For all cases, as the initial thickness D0 approaches zero, the modified thickness relative to the initial thickness D′∕D0 becomes larger. In the negative FAV case, the larger the velocity jump V0 or the thermal velocity Vthi is, the larger the ratio D′∕D0 becomes. In the positive FAV case, on the other hand, as V0 becomes smaller or Vthi becomes larger, D′∕D0 becomes larger.
Figure 6.
Thickness at T=10 Ωi−1 of the broadened shear layer D′ vs the initial thickness D0 for 24 cases in which changed are the initial shear layer thickness D0 (=0.25,0.5,1.0,2.0), shearing flow speed V0 (=0.5,1.0), and ion thermal speed Vthi (=0.9,1.8) are changed. Solid lines show the results from V0=VAi and Vthi=0.9VAi cases including the results discussed in Secs. 3A, 3B. Dashed lines show the V0=0.5VAi and Vthi=0.9VAi cases, and dotted lines show the V0=VAi and Vthi=1.8VAi cases. Both D′ and D0 are in Fig. 6a (b) are normalized by the ion inertial length λi [the modified ion gyroradius ; see Eq. 7].
In order to explain the results in Fig. 6a, we focus on the simple D0=0 case. The accelerated (decelerated) speed of thermal ions which perpendicularly cross the shear boundary Y=0 in the negative (positive) FAV case is described as
| (6) |
The second term on the right hand side in Eq. 6 represents ion acceleration (deceleration) by the outward (inward) convective electric field in the negative (positive) FAV case. Using this , the increased (decreased) gyroradius of the accelerated (decelerated) ions is described as
| (7) |
Since Eq. 7 indicates that ion mixing by the ion gyromotion should occur at , would be roughly equal to the half thickness of the broadened shear layer D′ in the D0=0 case. Figure 6b shows D′ versus D0 normalized by for the same cases as Fig. 6a. We see that all points are on almost the same curve; D′ decreases with decreasing D0, and as D0 approaches zero, D′ converges toward . Namely, is the lower limit of the half thickness of the modified velocity shear layer. These results imply that the transverse velocity shear layer in a kinetic equilibrium can never remain thinner than the modified ion gyrodiameter , that is, the transverse velocity shear layer always becomes thicker than the ion-kinetic scale .
Here, the magnitude of the convective electric field effect on the shear layer is equivalent to the term . Cai et al.14 revealed that ion-kinetic effects can strongly modify the density structure in the velocity shear layer as the term becomes larger, as shown in Figs. 3a, 3b, 3c, 3d, 3e, 3f, 3g of Cai et al.14 Our electromagnetic study clearly confirms their results, and further shows that larger deformation of the density structure in the shear layer leads to larger broadening of the shear layer.
Note that this broadened state of the shear layer is not a perfect kinetic equilibrium. In the negative FAV case, for example, ions excluded from the potential peak tend to be concentrated around the edge of the broadened shear layer as seen in Fig. 5b. Since this ion concentration can disturb the charge neutrality, the convective electric field tends to be disturbed around the edge of the layer. Consequently, this disturbed convective field results in the velocity fluctuation around the edge of the velocity shear layer as partially seen in Fig. 4. Therefore, there may be no perfect equilibrium of the transverse velocity shear layer. The amplitude of the fluctuation at the edge of the layer approaches about 5% of the maximum shearing speed and does not increase further after one ion gyroperiod. Thus, in this study, we call this quasisteady state the kinetic equilibrium.
Linear growth rate of the KHI
A notable point of the above results is that the time required for the kinetic equilibrium formation is about one ion gyroperiod, which is quite shorter than the growth time of the KHI even in the ion–kinetic scale shear layer case. This result implies that the ion-kinetic effects play a role only in the kinetic equilibrium formation and not in the linear growth of the KHI, which is confirmed below.
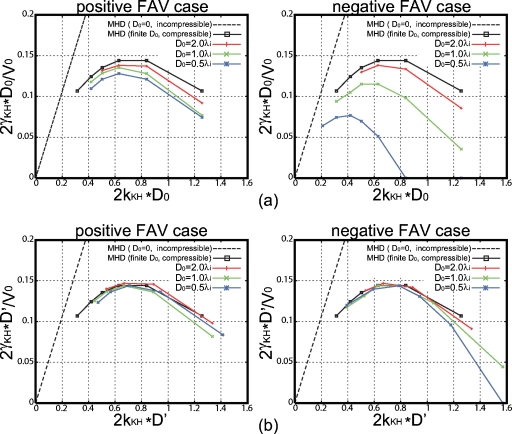
Figure 7a shows the growth rate of the KHI versus the wave number normalized by the initial half thickness D0 of the shear layer for D0=2.0, 1.0, and 0.5 cases. Here, the growth rate is obtained from time variation in the amplitude of the ion bulk velocity VY component at Y=0 for one wavelength mode (m=1). Black solid lines show the growth rates calculated from compressible MHD simulations using the same fluid parameters as the particle simulations, and dashed solid lines show those from the linear incompressible MHD theory for discontinuous velocity profile.4 As shown in the earlier studies, there is no difference between the positive and negative FAV cases in the KHI growth in the MHD regime.5 Figure 7a, however, show that there is a clear difference between the positive and negative FAV cases in the KHI growth rate. While for both positive and negative FAV cases the growth rate is lower than for the MHD simulations and decreases with decreasing D0, the growth rate decrease for the negative FAV cases is prominently larger. We find that the growth rate decrease seen in the kinetic cases results from the broadened velocity shear layer in the kinetic equilibrium. Figure 7b shows the growth rates versus the wave number of the KHI normalized by the half thickness of the modified shear layer in the kinetic equilibrium for the same cases as Fig. 7a. We see that there is little difference in the growth rate between the MHD and kinetic cases. This strongly indicates that there are almost no kinetic effects on the linear growth of the KHI because even when the initial shear layer thickness is of ion-kinetic scale, the kinetic effects broadens the shear layer to the nonkinetic thickness before the onset of the KHI.
Figure 7.
Growth rate of the KHI vs the wave number normalized by the initial half thickness of the shear layer D0 (a) and the broadened half thickness of the shear layer D′ (b) for D0=2.0, 1.0, and 0.5 cases. Left (right) panels show the results from the positive (negative) FAV cases. Square marks show the growth rates calculated from compressible MHD simulations using the same fluid parameters as the particle simulations, and dashed lines show the rate from the linear incompressible MHD theory for discontinuous velocity profile (Ref. 4).
Note that such a difference between the positive and negative FAV cases in the growth of the KHI in the ion-kinetic scale shear layer was also seen in earlier electromagnetic particle simulations.15 While Wilber and Winglee15 suggested that such difference may result from kinetic effects on the linear growth of the KHI, they did not discuss the broadening of the shear layer when reaching the kinetic equilibrium before the KHI onset. This was partially because they were not able to perform sufficiently high resolution simulations with sufficient amount of particles, which can reproduce the fine structure of the broadened shear layer in the kinetic equilibrium. Our high resolution simulations with the sufficient amount of particles clearly show that kinetic effects on the ion-kinetic scale velocity shear layer is essential not for the KHI linear growth itself but for the formation of the kinetic equilibrium of the shear layer, which is accomplished before the KHI onset.
Nagano23 and Huba16 have performed linear analyses using FLR MHD equations for the discontinuous velocity profile, that is, the velocity shear layer with zero thickness. They have shown that as the wavelength of the KHI approaches the ion gyroradius, the FLR effects increase or decrease the linear growth of the KHI more largely. Our particle simulations, however, reveal that the thickness of the velocity shear layer in the kinetic equilibrium is of ion-kinetic scale , and the finite thickness of the shear layer crucially controls the linear growth rate of the KHI as shown in Fig. 7. Thus, for true understanding of the ion-kinetic effects on the linear growth of the KHI, it is necessary to consider kinetic effects on the velocity profile before the KHI onset as demonstrated in this section.
EVOLUTION PROCESS OF KH VORTEX
Difference between positive and negative FAV cases
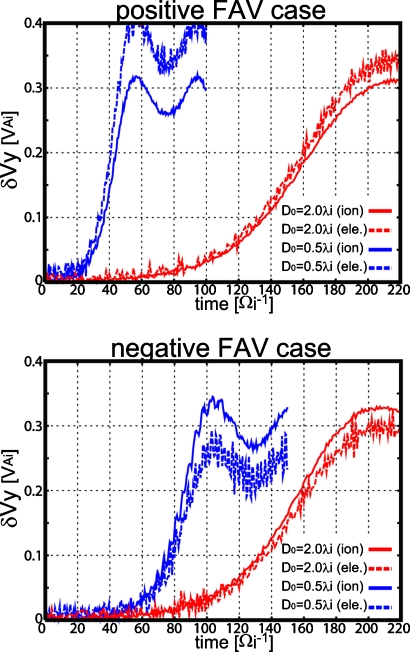
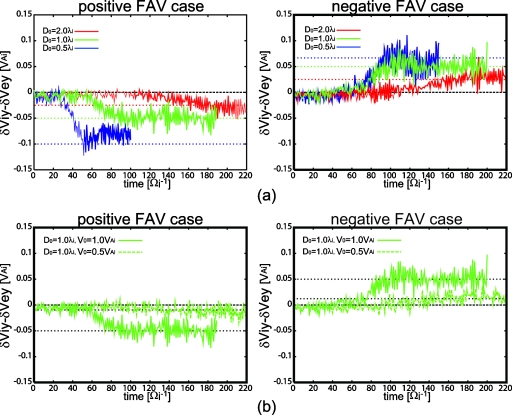
We further investigated the nonlinear evolution of the KHI, that is, the development process of the KH vortex. Figure 8 shows δVY as a function of time for the fastest growing KH mode (m=1) obtained from Fig. 7 in D0=2.0 and 0.5 cases. Solid (dashed) lines show the results for ions (electrons). In the positive FAV case, the wavelengths of the fastest KH mode λKH (=LX) in D0=2.0 and 0.5 cases are 20D0=40λi and 20D0=10λi, respectively. In the negative FAV case, λKH (=Lx) in D0=2.0 and 0.5 cases are 20D0=40λi and 30D0=15λi, respectively. In all cases, we see that there are clear differences in the saturation value of the KHI growth between ion and electron. The difference tends to become larger as the size of the KH vortex becomes smaller. Furthermore, there is a clear difference between the positive and negative FAV cases in the magnitude relation between δViY and δVeY; in the positive FAV case δViY<δVeY, while in the negative FAV case δViY>δVeY. Figure 9 shows the difference δViY−δVeY as a function of time. Figure 9a shows the vortex size dependence in which D0=2.0, 1.0, and 0.5 cases are compared for V0=1.0VAi. Figure 9b show the shearing flow speed dependence that compares V0=1.0 and 0.5 cases for D0=1.0. The difference δViY−δVeY decreases roughly proportional to the size of the vortex in both the positive and negative FAV cases [Fig. 9a], and increases roughly proportional to the square of the shearing flow speed [Fig. 9b].
Figure 8.
δVY for the fastest growing KH mode in Fig. 7 as a function of time for D0=2.0 and 0.5 cases. Upper (bottom) panel shows the results from the positive (negative) FAV cases. Solid (dashed) lines show the ion (electron) vortices.
Figure 9.
Difference δViY−δVeY as a function of time in the positive FAV (left) and negative FAV (right) cases. (a) The vortex size dependence in which D0=2.0, 1.0, and 0.5 cases are compared for V0=1.0VAi. (b) The shearing flow speed dependence in which V0=1.0 and 0.5 cases are compared for D0=1.0. Dotted lines show the theoretical values obtained from Eq. 10.
Note that large fluctuations of δVeY seen in Figs. 89 are numerical ones associated with the large electron thermal speed (about twice of VAi). We have confirmed that δVeY fluctuations become smaller as the number of particles per cell is increased, although the essential results seen in Figs. 89 are not changed by such increase in the number of particles.
Centrifugal drift effects
The above results regarding the difference δViY−δVeY can be explained by the centrifugal drift of ions which flow along the vortex edge. In the transverse case, since the magnetic field is oriented in the +Z-direction, the centrifugal force for the rotational flow in the vortex is directed outward from its center. The direction of ion centrifugal drift is then always clockwise, when seen from +Z position, along their rotational motion in both the positive and negative FAV cases. Thus, in the positive FAV case, the ion rotational speed decreases by the drift speed, while it increases in the negative FAV case. As shown later, electrons are too light for the centrifugal drift to affect the vortex rotation speed in our simulation setting.
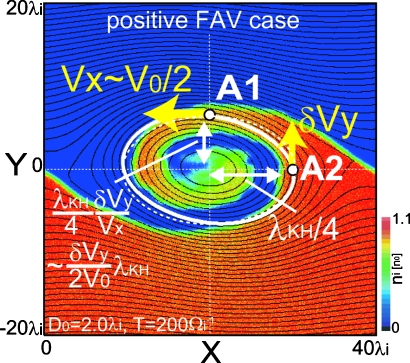
Figure 10 shows the density contour at T=200 Ωi−1 for ions which initially exist at Y<0 in the positive FAV and D0=2.0 case. Black lines show the ion streamlines. The white solid line shows a streamline passing through point A2 where δViY and δVeY have a maximum value. Since at around T=200 Ωi−1 the KHI reaches the saturated quasisteady state where the vortex keeps rolling quasisteadily, the white streamline roughly corresponds to the orbit of the guiding center of an ion which rotates along the edge of the vortex. At point A1 (X∼30λi), the ion rotates along the vortex edge at about the shearing flow speed ViX∼V0∕2, while at point A2 it rotates at a speed of about δViY. Assuming that the ion orbit is elliptical (as shown by the white dashed line in Fig. 10), the Y-coordinate at point A1 can be obtained by the conservation of angular momentum of the ion as
| (8) |
Then, the curvature radius at point A2 can be written as
| (9) |
Thus, the centrifugal drift speed for ions at point A2 can be described as
| (10) |
Since δViY is always saturated at about 0.3V0 in all cases, as seen in Fig. 8, the ion centrifugal drift speed in the developed KH vortex can be roughly described as
| (11) |
By the same formula, the ion centrifugal drift speed in the negative FAV case can also be described as Eq. 11. Dotted lines in Fig. 9 show the values obtained from Eq. 11. We see that the differences δViY−δVeY obtained from the simulation results agree well with the theoretical values obtained from Eq. 11. Thus, it can be concluded that the difference in the vortex rotational speed between ions and electrons results from the centrifugal drift of ions.
Figure 10.
Density contour at T=200 Ωi−1 for ions which initially exist at Y<0 in the positive FAV and D0=2.0 case. Black lines show the ion streamlines. The white solid line shows a streamline passing through point A2 where δViY and δVeY have a maximum value. At point A1, the white streamline crosses X=20λi. The white dashed line is an ellipse passing through both A1 and A2 points, an approximation of the white streamline.
In addition, from Eq. 11 the drift speed normalized by the vortex rotation speed can be described as
| (12) |
This equation means that the ion centrifugal drift becomes more effective in the evolution of the KH vortex when its size is small with respect to the ion inertial length λi or the rotation speed of the vortex is fast with respect to the ion Alfven speed VAi.
On the other hand, in the same regime as Eq. 12, the centrifugal drift speed for electrons can be described as
| (13) |
Since the drift speed of electrons is inversely proportional to the ion-to-electron mass ratio, the electron centrifugal drift effects on the growth of the KH vortex can be neglected unless the vortex rotation speed is extremely large or the size of the vortex is extremely small. In our simulation settings, since V0∼VAi and λKH>5λi, and mi∕me=25, the right hand of Eq. 12 is always below 0.01.
Interestingly, the centrifugal drift speed shown by Eq. 11 can be obtained also in the two-fluid (ion and electron fluids) regime. If it is assumed that streamlines in Fig. 9 are elliptically distributed around points A1 and A2, the conservation of mass flux for ions between points A1 and A2 can be written as ρA1VA1YA1=ρA2VA2YA2, where ρA1(ρA2) is the mass density at point A1 (A2). Since the density is almost equal at both points A1 and A2, the Y-coordinate at point A1 of Fig. 10 can be described as
| (14) |
Since this equation is the same as Eq. 8, the centrifugal drift speed can also be written as Eq. 11 by the same formula as the above kinetic picture. It means the centrifugal drift effect is not of kinetic nature but of two-fluid one. This is compatible with the fact that the magnitude of the centrifugal effect shown by Eq. 12 is controlled by the ion inertial (rather than kinetic) scale.
Structure of the KH vortex
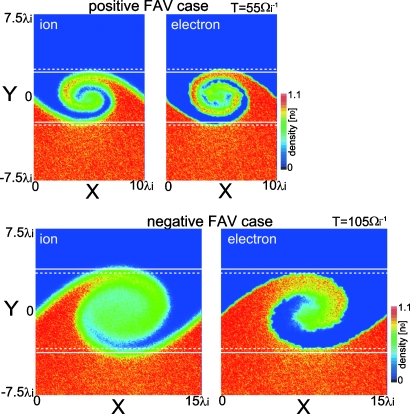
We further found that the difference in the evolution of the KH vortex between ions and electrons results in the difference in its structure. Figure 11 shows, for the fastest growing KH mode in D0=0.5 cases, density contours at the saturation time of the KHI for ions (left panels) and electrons (right panels) which initially exist at Y<0. Solid (dashed) white lines show the most bulging edges in the Y-direction of the ion (electron) vortex. Here, the bulging edge is defined by the line where the density is half the peak value near the vortex edge. Note that since the vortex edge structure is not clear due to numerical limitations associated with the lack of particles at the vortex edge, the position of the bulging edge contains uncertainty. In the positive FAV case, since electrons rotate faster than ions, electrons fall into the center of the vortex faster than ions, and also the size of the bulge is larger for electrons than for ions. The difference in the bulge size between ions and electrons, which corresponds to the difference in the Y-coordinate between the white solid and dashed lines in Fig. 11, is about 3% of the KHI wavelength. In the negative FAV case, on the other hand, since ions rotate faster than electrons, ions fall into the center of the vortex faster than electrons, and also the bulge size is larger for ions than for electrons. The difference in the bulge size between ions and electrons is about 2.5% of the wavelength.
Figure 11.
Density contours at the saturation time of the fastest growing KH mode for ions (left panels) and electrons (right panels) which initially exist at Y<0. The upper and lower panels show the positive and negative FAV cases, respectively, for D0=0.5. Solid (dashed) white lines show the most bulging edges in the Y-direction of the ion (electron) vortex. The edge is marked by the line where the density is half of the peak value near the vortex edge.
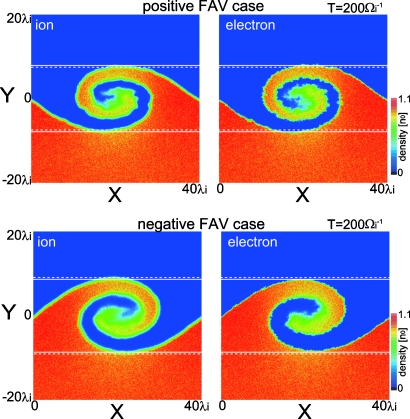
Figure 12 shows the same contours as Fig. 11 but in D0=2.0 cases. The difference in the vortex structure between ions and electrons is smaller than in D0=0.5 cases; the difference in the bulge size is only about 1% of the KHI wavelength in both the positive and negative FAV cases.
Figure 12.
The same contours as Fig. 11 but for D0=2.0.
If it is assumed that the size of the vortex bulge is expressed by the Y-coordinate at point A1 in Fig. 10, the difference in the bulge size between ions and electrons normalized by the KHI wavelength can be described as
| (15) |
This is roughly consistent with our simulation results (for example, in the D0=2.0 and positive FAV case shown in the upper panels in Fig. 12, δRKH∕λKH∼0.013), although the values obtained from the numerical simulations contain uncertainty. Equation 15 means that the difference in the vortex structure between ions and electrons depends directly on the magnitude of the ion centrifugal drift speed, that is, the difference becomes larger as the vortex rotation speed becomes larger relative to the ion Alfven speed VAi or the vortex size becomes smaller relative to the ion inertial length λi.
SUMMARY AND DISCUSSION
Summary
In this study, we have performed two-dimensional and 1∕2-dimensional full particle simulations to systematically investigate the ion-kinetic scale and MHD-scale physics of the KHI induced in the transverse velocity shear layer. First, we found that a kinetic equilibrium of the shear layer is established in about one ion gyroperiod, and that the shear layer in the equilibrium is broadened by the ion finite gyroradius effect. This broadening occurs more largely as the initial shear layer thickness D0 approaches zero. Here, it should be noted that the broadened half thickness of the shear layer can never remain thinner than the modified ion gyroradius in the presence of the convective electric field. The lower limit of its half thickness becomes larger (smaller) than the original nonmodified gyroradius in the negative FAV B⋅Ω<0 (positive FAV B⋅Ω>0) case as the term V0∕Vthi becomes larger as expressed by Eq. 7.
Next, we found that the KHI linear growth rate depends not on the initial shear layer thickness but on the broadened thickness, since the kinetic equilibrium and associated shear layer broadening are accomplished before the KHI onset.
Furthermore, we found that in the saturation phase of the KHI, the rotation speed of the vortex becomes faster (slower) for ions than for electrons in the negative (positive) FAV case, due to the ion drift motion associated with the centrifugal force exerted by the vortex flow. Moreover, the difference in the vortex evolution between ions and electrons can lead to the difference in the size of the vortex bulge between ions and electrons. These ion centrifugal drift effects become larger as the term V0[VAi]∕λKH[λi] becomes larger, as shown in Eqs. 12, 14.
By using Eqs. 7, 12, 15, the results of our fundamental study can be applied to various shearing flow speed (V0), spatial scale (D0), and ion temperature (Vthi) situations in space, such as planetary magnetospheric boundaries, as discussed in Sec. 5B. However, this fundamental study includes various issues that should be addressed in the future for more detailed comparisons with actual situations, as discussed in Sec. 5C.
Application to the planetary magnetospheric boundary
KH wavelike quasiperiodic fluctuations have been frequently observed around the Earth’s magnetospheric boundary layer.24, 25, 26 The KH waves tend to be observed around the low-latitude boundary layer when the IMF direction is northward.6 In addition, a recent in situ observation of Mercury’s magnetosphere during the Messenger’s first flyby has reported quasiperiodic fluctuations of the magnetic field around the duskside magnetospheric boundary.11, 12 Since these magnetic field waves were observed when the IMF direction was probably northward, Slavin et al.11 suggested that these waves might be of KH-type, although the formation mechanism of these waves could not be confirmed by the magnetic field data from one flyby only. These observational results imply the necessity of understanding the role of the KH vortex-induced in the transverse velocity shear layer not only in the Earth-like MHD-scale situation but also in the Mercury-like smaller-scale (including ion-kinetic scale) situation. Here, note that the positive (negative) FAV case in this study corresponds to the duskside (dawnside) boundary of the Earth’s and Mercury’s magnetospheres under northward IMF conditions.
Regarding the wavelength of observed KH waves
In the Earth’s situations, since in situ observations have confirmed that the thickness of the low-latitude magnetospheric boundary layer is always more than a few times the ion gyroradius,27 the dawn-dusk asymmetry (that is, the difference between positive and negative FAV cases) in the wavelength of the fastest growing KH mode is not expected. Indeed, past in situ observations have found no clear dawn-dusk asymmetry in the KHI wavelength.6, 7 On the other hand, the recent in situ observation of Mercury’s magnetospheric boundary has shown that the wavelength of the magnetic field waves, which were observed only on the duskside, was about 500–5000 km. If it is assumed that the wavelength corresponds to that of the fastest growing KH mode, the estimated half thickness of the velocity shear layer is about 30–300 km. Since it is considered that the gyroradius of thermal ions is of the order of 100 km and the observed shearing flow speed (100–200 km∕s) is comparable to the ion thermal speed, the lower limit of the shear layer thickness calculated by Eq. 7 can become about half the thermal ion gyroradius, which is roughly equal to the estimated value of the smallest half thickness of the velocity shear layer. This indicates that the observed waves could be of the fastest growing KH mode induced at the velocity shear layer in the kinetic equilibrium. Furthermore, if the same situation is achieved at the dawnside magnetospheric boundary layer, since the lower limit of the shear layer thickness is expected to be about twice the thermal ion gyroradius, the wavelength of the KH waves at the dawnside boundary layer could be about four times larger than that at the duskside boundary layer. In the near future, such a clear dawn-dusk asymmetry of the KHI wavelength may be confirmed by the Messenger spacecraft or in situ observations of the next generation.
Regarding the evolution of KH vortex
In the Earth’s situations, since the observed wavelength of the KH waves is of order 104 km (about 100 times λi) and the shearing speed is of order 102 km∕s (same order as VAi), the magnitude of the term for the centrifugal drift effect V0[VAi]∕λKH[λi] is of order 10−2. Thus, in Earth-like large-scale situations, the ion centrifugal drift effects are not expected to affect the evolution of the KH vortex. Indeed, there is no apparent dawn-dusk asymmetry in the structure of the vortices observed around the Earth’s magnetospheric boundary.7 On the other hand, in Mercury’s situation, since the observed wavelength of the magnetic field waves was of order 102 to 103 km (one to ten times λi) and the shearing speed is of order 102 km∕s (same order as VAi), V0[VAi]∕λKH[λi] is of order 0.1 to 1. It means that in Mercury-like small-scale situations, more than 10% difference in the vortex size between ions and electrons is likely to occur.
Thus, we expect clear dawn-dusk asymmetries not only in the wavelength of the KHI but also in the structure of the KH vortex in Mercury-like small-scale situations. Since the KH vortex is believed to be one of the most important candidates for entry of solar-wind plasmas through the magnetospheric boundary, our results imply a large dawn-dusk asymmetry in the entry process of solar-wind plasmas in Mercury-like situations.
Some remarks on the future works
In this study, we focus only on fundamental situations in which the initial density is uniform. In actual situations including planetary magnetospheric boundaries, however, the density jump across the velocity shear layer should not be neglected. If the density jump is taken into account, the structure of the shear layer in the kinetic equilibrium may be largely changed since the charge separation in the ion mixing region by the ion gyromotion, as seen in Fig. 5c, is expected to become larger and more complicated. Besides, the density jump may also cause charge separation at the edge of the rolled-up KH vortex, since the ion centrifugal drift leads to the difference between the ion and electron edges of the vortex as shown in Figs. 1112. An additional electric field perpendicular to the vortex edge produced by this charge separation may promote plasma mixing or transport through the vortex edge. Basically, this charge separation process associated with the nonuniform density is expected to be effective only in Mercury-like small-scale situations. Past numerical studies, however, have revealed that the density jump across the shear layer produces a thinner secondary velocity shear layer at the edge of the rolled-up vortex, and the secondary shear layer produces smaller-scale secondary KH vortices.10 Since the spatial scale of the secondary vortices is about four times smaller than that of the parent vortex, the charge separation processes may become effective even in Earth-like large-scale situations via the secondary smaller vortices.
While the initial uniform magnetic field is assumed in this fundamental study, actual velocity boundaries such as planetary magnetospheric boundaries often consist of moderate magnetic field gradient across the shear layer, which may affect both the kinetic equilibrium of the shear layer and the evolution of the KHI. Regarding the kinetic equilibrium of the shear layer, since the gyroradius of particles depends on the magnetic field strength, the perpendicular magnetic field gradient across the shear layer may lead to an asymmetric structure of the broadened shear layer. Such a more complicated shear layer structure in the kinetic equilibrium could also affect the linear growth of the KHI. Furthermore, in the nonlinear stage of the KHI, the gradient of the perpendicular magnetic field strength can be strengthened along the rolled-up vortex edge. Since this large perpendicular field gradient could cause the drift of particles in the direction parallel or antiparallel to the direction of the centrifugal drift, this gradient B drift could also lead to different vortex structure between ions and electrons. Thus, the nonuniform magnetic field should be considered as the next step of this fundamental study.
Only protons and electrons were considered in this study. In order to exactly understand the physics of Mercury’s magnetospheric boundary, however, the effects of heavy ions such as Na+ should also be included. The plasma data from the Messenger spacecraft have shown that a moderate amount of Na+ exists in Mercury’s magnetosphere and magnetosheath regions.11 From our results regarding the kinetic equilibrium of the transverse shear layer, it can be predicted that if a sufficient amount of Na+ ions exists, a double broadened shear layer (the broadened layer by protons and more largely broadened layer by the larger gyroradius of Na+ ions) might appear. Besides, since the thickness of the double broadened layer at the dawn-side boundary could be larger than that at the dusk-side boundary due to the convective electric field effects, the double broadened structure could be observed more easily at the dawn-side magnetospheric boundary. On the other hand, since the gyroperiod of Na+ ions can become comparable to the timescale of the KHI growth, the nonequilibrium state of the Na+ ion shear layer could affect the KHI growth itself. Thus, the existence of the heavy ions could make the magnetospheric boundary physics more complicated and interesting.
Recent fluid-approximation numerical studies have been shown that if the parallel magnetic field component (not considered in this fundamental study) exists, the parallel field lines are highly deformed by the vortex flow and then can be reconnected.28, 29, 30, 31 This so-called vortex-induced-reconnection process can lead to direct plasma mixing and transport across the shear layer.30 Indeed, direct evidence of the vortex-induced-reconnection process has been recently reported.26 Hasegawa et al.26 have also reported that around the vortex-induced-reconnection region, electrons were strongly accelerated along the magnetic field line. While these results clearly imply the importance of kinetic roles in the plasma mixing and particle acceleration, no kinetic simulation of the vortex-induced-reconnection process has been performed to date. Thus, kinetic simulation study considering the parallel magnetic field component is also a necessary next step of this study.
Recent MHD simulations have shown the importance of three-dimensional effects in both the linear32 and nonlinear33 evolution of the KHI. The three-dimensional effects are also believed to be important from the kinetic aspect; Nishikawa et al.21 have shown that the component of the KH k-vector in the Z-direction (parallel to the magnetic field) tends to largely reduce the growth rate of the KHI, and hence the ion-cyclotron modes can dominate the KHI. Thus, three-dimensional effects should not be neglected in considering the kinetic properties of the KHI and associated vortex structure. While three-dimensional full kinetic simulations of the KH vortex cannot be performed on the present computational resources, the next generation supercomputer will allow us to perform such large-scale simulations.
This study treats only the moderately strong shear case in which . Although most of observed KH-like waves at the Earth’s and Mercury’s magnetospheric boundaries are believed to be driven under moderately strong shear conditions , for more complete understanding of the KHI it is necessary to investigate weaker and stronger shear cases. In the weaker shear case , an ion-cyclotron mode could be excited in addition to the KHI,13 and this short wavelength mode could affect the kinetic equilibrium of the shear layer. In the stronger shear case , on the other hand, the stronger convective electric field could significantly affect not only the ion gyromotion but also the electron gyromotion. Namely, in this case, not only ion but also electron kinetic equilibrium should be considered. In addition, in the stronger shear case, the fast Mach number Mf=V0∕(VAi2+Cs2)1∕2 may be more than unity unless the temperature is extremely high. Here, Cs is the sonic speed. When Mf>2, the strong compressibility prevents the linear growth of the KHI.5, 34 Recent hydrodynamical simulations, however, have suggested that even in the supersonic shearing flow, the KHI can grow in the subsonic downstream region of the shock wave.35 Thus, the stronger shear case could be greatly complicated with direct coupling between the ion and electron kinetic equilibrium-associated processes, the shock wave, and the KHI.
Finally, the ion-to-electron mass ratio M is set to be 25 for all runs shown in this paper. While this value is far smaller than the real one (M=1836), we have confirmed that the essential results are not changed even when the mass ratio is larger (up to M=100). This indicates that the electron mass effects in M=25 cases are small enough to be neglected. This is because both the electron gyroradius effect on the kinetic equilibrium as shown in Eq. 7 and the magnitude of the electron centrifugal drift effect shown in Eq. 12 are directly proportional to the mass ratio. The electron mass effects, however, can become crucial in electron-scale velocity shear layer case, that is, extremely strong shear case not treated in this paper.
ACKNOWLEDGMENTS
This work was supported by Grant-in-Aid for JSPS Fellows (KAKENHI Grant No. 1911844). Numerical simulations in this paper were performed by NEC SX-6 and SX-9 at JAXA.
References
- Hasegawa H., Fujimoto M., Phan T. -D., Rème H., Balogh A., Dunlop M. W., Hashimoto C., and TanDokoro R., Nature 430, 755 (2004). 10.1038/nature02799 [DOI] [PubMed] [Google Scholar]
- Parhi S. S., Suess T., and Sulkanen M., J. Geophys. Res. 104, 14781, doi:10.1029/1999JA900041 (1999). 10.1029/1999JA900041 [DOI] [Google Scholar]
- Fujita Y., Sarazin C. L., Kempner J. C., Rudnick L., Slee O. B., Roy A. L., Anderrnach H., and Ehle M., Astrophys. J. 575, 764 (2002). 10.1086/341352 [DOI] [Google Scholar]
- Chandrasekhar S., Hydrodynamic and Hydromagnetic Stability (Dover, New York, 1961), p. 481. [Google Scholar]
- Miura A. and Pritchett P. L., J. Geophys. Res. 87, 7431, doi:10.1029/JA087iA09p07431 (1982). 10.1029/JA087iA09p07431 [DOI] [Google Scholar]
- Kivelson M. G. and S.-Chen, Physics of the Magnetopause: Geophysical Monograph Series Vol. 90 (American Geophysical Union, Washington, DC, 1995) pp. 257–268. [Google Scholar]
- Hasegawa H., Fujimoto M., Takagi K., Saito Y., Mukai T., and Rème H., J. Geophys. Res. 111, A09203, doi:10.1029/2006JA011728 (2006). 10.1029/2006JA011728 [DOI] [Google Scholar]
- Miura A., J. Geophys. Res. 89, 801, doi:10.1029/JA089iA02p00801 (1984). 10.1029/JA089iA02p00801 [DOI] [Google Scholar]
- Fujimoto M. and Terasawa T., J. Geophys. Res. 99, 8601, doi:10.1029/93JA02722 (1994). 10.1029/93JA02722 [DOI] [Google Scholar]
- Nakamura T. K. M., Hayashi D., Fujimoto M., and Shinohara I., Phys. Rev. Lett. 92, 145001 (2004). 10.1103/PhysRevLett.92.145001 [DOI] [PubMed] [Google Scholar]
- Slavin J. A., Acuña M. H., Anderson B. J., Baker D. N., Benna M., Gloeckler G., Gold R. E., Ho G. C., Killen R. M., Korth H., Krimigis S. M., R. L.McNutt, Jr., Nittler L. R., Raines J. M., Schriver D., Solomon S. C., Starr R. D., Trávníček P., and Zurbuchen T. H., Science 321, 85 (2008). 10.1126/science.1159040 [DOI] [PubMed] [Google Scholar]
- Slavin J. A., Anderson B. J., Zurbuchen T. H., Baker D. N., Krimigis S. M., Acuña M. H., Benna M., Boardsen S. A., Gloeckler G., Gold R. E., Ho G. C., Korth H., R. L.McNutt, Jr., Raines J. M., Sarantos M., Schriver D., Solomon S. C., and Trávníček P., Geophys. Res. Lett. 36, L02101, doi:10.1029/2008GL036158 (2009). 10.1029/2008GL036158 [DOI] [Google Scholar]
- Ganguli G., Lee Y. C., and Palmadesso P., Phys. Fluids 31, 823 (1988). 10.1063/1.866818 [DOI] [Google Scholar]
- Cai D., Storey R. O., and Neubert T., Phys. Fluids B 2, 75 (1990). 10.1063/1.859541 [DOI] [Google Scholar]
- Wilber M. and Winglee R. M., J. Geophys. Res. 100, 1883, doi:10.1029/94JA02488 (1995). 10.1029/94JA02488 [DOI] [Google Scholar]
- Huba J. D., Geophys. Res. Lett. 23, 2907, doi:10.1029/96GL02767 (1996). 10.1029/96GL02767 [DOI] [Google Scholar]
- Thomas V. A. and Winske D., Geophys. Res. Lett. 18, 1943, doi:10.1029/91GL02552 (1991). 10.1029/91GL02552 [DOI] [Google Scholar]
- Matsumoto Y. and Hoshino M., J. Geophys. Res. 111, A05213, doi:10.1029/2004JA010988 (2006). 10.1029/2004JA010988 [DOI] [Google Scholar]
- Hoshino M., J. Geophys. Res. 92, 7368, doi:10.1029/JA092iA07p07368 (1987). 10.1029/JA092iA07p07368 [DOI] [Google Scholar]
- Pritchett P. L. and Coroniti F. V., J. Geophys. Res. 89, 168, doi:10.1029/JA089iA01p00168 (1984). 10.1029/JA089iA01p00168 [DOI] [Google Scholar]
- Nishikawa K. -I., Ganguli G., Lee Y. C., and Palmadesso P. J., Phys. Fluids 31, 1568 (1988). 10.1063/1.866696 [DOI] [Google Scholar]
- Opp E. N. and Hassam A. B., Phys. Fluids B 3, 885 (1991). 10.1063/1.859845 [DOI] [Google Scholar]
- Nagano H., Planet. Space Sci. 27, 881 (1979). 10.1016/0032-0633(79)90013-8 [DOI] [Google Scholar]
- Sckopke N., Paschmann G., Haerendel G., Sonnerup B. U. O., Bame S. J., Forbes T. G., E. W.Hones, Jr., and Russell C. T., J. Geophys. Res. 86, 2099, doi:10.1029/JA086iA04p02099 (1981). 10.1029/JA086iA04p02099 [DOI] [Google Scholar]
- Fairfield D. H., Otto A., Mukai T., Kokubun S., Lepping R. P., Steinberg J. T., Lazarus A. J., and Yamamoto T., J. Geophys. Res. 105, 21159, doi:10.1029/1999JA000316 (2000). 10.1029/1999JA000316 [DOI] [Google Scholar]
- Hasegawa H., Retinò A., Vaivads A., Khotyaintsev Y., Andre M., Nakamura T. K. M., Teh W. -L., Sonnerup B. U. O., Schwartz S. J., Seki Y., Fujimoto M., Saito Y., Rème H., and Canu P., J. Geophys. Res. 114, A12207, doi:10.1029/2009JA014042 (2009). 10.1029/2009JA014042 [DOI] [Google Scholar]
- Berchem J. and Russell C. T., J. Geophys. Res. 87, 2108, doi:10.1029/JA087iA04p02108 (1982). 10.1029/JA087iA04p02108 [DOI] [Google Scholar]
- Pu Z. Y., Yan M., and Liu Z. X., J. Geophys. Res. 95, 10559, doi:10.1029/JA095iA07p10559 (1990). 10.1029/JA095iA07p10559 [DOI] [Google Scholar]
- Otto A. and Fairfield D. H., J. Geophys. Res. 105, 21175, doi:10.1029/1999JA000312 (2000). 10.1029/1999JA000312 [DOI] [Google Scholar]
- Nakamura T. K. M., Fujimoto M., and Otto A., J. Geophys. Res. 113, A09204, doi:10.1029/2007JA012803 (2008). 10.1029/2007JA012803 [DOI] [Google Scholar]
- Nakamura T. K. M. and Fujimoto M., Phys. Rev. Lett. 101, 165002 (2008). 10.1103/PhysRevLett.101.165002 [DOI] [PubMed] [Google Scholar]
- Takagi K., Hashimoto C., Hasegawa H., Fujimoto M., and TanDokoro R., J. Geophys. Res. 111, A08202, doi:10.1029/2006JA011631 (2006). 10.1029/2006JA011631 [DOI] [Google Scholar]
- Matsumoto Y. and Seki K., J. Geophys. Res. 112, A06223, doi:10.1029/2006JA012114 (2007). 10.1029/2006JA012114 [DOI] [Google Scholar]
- Miura A., J. Geophys. Res. 97, 10655, doi:10.1029/92JA00791 (1992). 10.1029/92JA00791 [DOI] [Google Scholar]
- Kobayashi Y., Kato M., Nakamura K. T. A., Nakamura T. K. M., and Fujimoto M., Adv. Space Res. 41, 1325 (2008). 10.1016/j.asr.2007.04.016 [DOI] [Google Scholar]


