

Abstract
Background:
Three months is the standard timepoint for assessing final functional status after acute ischemic stroke in phase 3 clinical trials. Earlier reliable timepoints for outcome ascertainment would facilitate care quality improvement programs that employ administrative datasets and reduce the loss to follow-up observed in many stroke clinical trials. We assessed whether day 30 global disability status reliably predicts final 3-month disability outcome among acute stroke patients.
Methods:
Data of 5,997 subjects in acute stroke trials conducted between 1998 and 2006 from the Virtual International Stroke Trials Archive dataset were partitioned into a derivation cohort (n = 4,051) and a validation cohort (n = 1,946). Global disability was assessed with modified Rankin Scale (mRS). To evaluate the association of day 30 vs day 90 mRS, weighted kappa agreement was computed and then adjusted using multivariable ordinal logistic modeling.
Results:
Overall, mean age was 67.6 ± 12.4 years; 2,541 (45.2%) were women. Day 30 mRS score correlated strongly with day 90 (r = 0.87, p < 0.001); weighted kappa agreement was 0.86 (95% confidence interval 0.85–0.87, p < 0.001). In multivariable logistic regression analysis, day 30 mRS was the dominant variable associated with day 90 mRS, accounting for 65.6% of the variance. Nine other baseline variables were associated with outcome, but collectively explained only an additional 1.8% of the variance.
Conclusions:
After an index ischemic stroke, global disability status at 1 month reliably estimates final 3-month disability outcomes. One-month disability status alone may be dependable and efficient as an outcome measure in stroke quality improvement programs and select clinical trials.
GLOSSARY
- CI
= confidence interval;
- mRS
= modified Rankin Scale;
- NIHSS
= NIH Stroke Scale;
- VISTA
= Virtual International Stroke Trials Archive.
Stroke causes substantial morbidity and mortality.1 Although stroke mortality has slightly declined over the last several decades, morbidity has remained constant or possibly increased.1 Stroke morbidity manifests as residual physical, psychological, and social impairment,2 with almost 45% of all stroke survivors aged ≥65 years harboring persistent moderate or severe disability.3 Stroke-related disability is expected to become more prevalent as the world's population shifts to elderly persons,4,5 and addressing it will increasingly become a major issue facing researchers, care providers, and policy makers in the years to come.
The most common timing of final assessment in phase 3 clinical trials is 3 months after stroke occurrence,6,7 but the relatively longer follow-up of this approach is limited by missing information due to loss of subjects or new events unrelated to the index stroke, both of which can complicate outcome ascertainment. Moreover, this timepoint poses difficulties for use in comparative effectiveness, quality improvement, and epidemiologic studies which employ data available from administrative datasets since governments routinely collect and report data on readmissions and complications after a given hospitalization to 30 days, not 90 days.
Many of these challenges could be addressed if day 30 functional outcomes after acute stroke were valid as acceptable proxies for day 90 outcomes. We sought to assess how well day 30 global disability status alone predicts 3-month global disability outcome after stroke, and, if this correlation was weak, to develop multivariate formulas that predict 3-month outcome using a patient's known day 30 disability status plus other outcome prognostic variables.
METHODS
Data were obtained for patients with acute ischemic stroke from the Virtual International Stroke Trials Archive (VISTA) database. Details of the VISTA collaboration have been previously published; the database includes data from trials that had documented entry criteria and monitoring processes for validation of data.8 In brief, VISTA is an international academic collaborative venture that collects standardized data from numerous clinical stroke trials into a single academic database and holds data from several trials and one stroke registry, involving more than 28,000 patients, aged between 18 and 103 years, who experienced an index acute stroke due to either ischemia or intracerebral hemorrhage.8 Data have been collected prospectively and include demographic and medical history characteristics, baseline neurologic assessment, and various clinical outcome scales.8 For reasons of confidentiality, anonymity agreements for use of VISTA preclude identification of the trial sources.
For the purpose of this study, we identified in the VISTA database patients meeting the following eligibility criteria: 1) age ≥18 years, 2) experienced an ischemic stroke, 3) modified Rankin Scale (mRS) global disability assessment performed on both day 30 and day 90 poststroke, 4) baseline stroke severity assessed by the NIH Stroke Scale (NIHSS), 5) previous medical history variables available, 6) onset to inclusion time was within 24 hours, and 7) alive at day 30. The current analysis is based on data from 7,185 subjects from acute stroke trials entered into the archive.
Outcome.
The mRS was the outcome measure utilized in this analysis. The mRS is a simple, time-efficient clinician-reported measure of global disability frequently used in large-scale multicenter trials.9–11 The mRS defines 7 clinically discrete patient disability categories including 6 levels of disability and 1 for death.9–11 Several types of evidence attest to the validity and reliability of the mRS.12–14 The intermediate endpoint assessed was mRS at day 30 whereas mRS at day 90 was the final endpoint.
Covariates.
Baseline demographic and clinical covariates to be examined were preselected based on prior studies of factors that influence outcomes after acute ischemic stroke.15,16 Candidate predictive factors handled as continuous variables were age, baseline temperature, baseline NIHSS, baseline systolic and diastolic blood pressure, and baseline glucose. Candidate categorical variables were sex, race (white, black, Asian, other), history of atrial fibrillation, history of congestive heart failure, history of diabetes, history of hypertension, history of myocardial infarction, stroke subtype (cardioembolic vs noncardioembolic), history of TIA, antiplatelet therapies, reperfusion treatment, and statins.
Statistical analyses.
Association measures.
To assess the association between day 30 vs day 90 mRS scores, the observed agreement, the weighted kappa statistic, and the distribution of differences is reported. The observed agreement is the proportion of patients who have exactly the same day 30 and day 90 mRS scores. The weighted kappa statistic adjusts for agreement by chance and gives partial weight for a near miss (for example, a difference of 1 point instead of exact agreement, which is a difference of 0). The weighted kappa is also similar to a correlation coefficient. The distribution of the differences between the day 90 mRS score and the prediction (day 30 mRS or multivariable model prediction) is reported.
Multivariable.
To account and adjust for day 30 mRS and the up to 18 other baseline demographic and clinical factors that might also affect the day 90 mRS score, both a partial proportional odds logistic model and a classification tree model were fit to the data as it was not clear which model might be more accurate. The observed agreement, corresponding kappa statistic, and distribution of differences are reported for the model-predicted day 90 mRS score vs the observed day 90 mRS score. Results are given for the logistic model and for the tree model. The multivariable models were developed using a randomly chosen two-thirds of the data and validated on the remaining third.
Incomplete data.
In order to carry out the multivariate analyses using the full dataset, nearest neighbor imputation was used to fill in data for stroke subtype (27% missing), history of chronic heart failure (19% missing), and history of TIA (8.8% missing). The nearest neighbor method fills in a value taken from other patients who are similar on all of the other variables.
More detailed information on the methods including descriptions of logistic regression modeling as well as classification and regression tree modeling can be found in appendix e-1 on the Neurology® Web site at www.neurology.org.
Standard protocol approvals, registrations, and patient consents.
Each trial that contributed data to the VISTA registry received human research approval to enroll cases by their respective institutional or regional review boards, and obtained written informed consent from all participating subjects.
RESULTS
The final analytic sample was based on 5,997 patients (83.5% of overall cohort) after excluding the 748 patients (10.4%) who died at day 30 and 440 (6.1%) patients with a missing value for day 30 mRS or day 90 mRS. Baseline characteristics and main outcomes of the 4,051 subjects used to develop the models (derivation cohort) and 1,946 subjects used to test the models (validation cohort) are shown in table 1. The derivation and validation cohorts were generally similar with respect to age, sex distribution, medical history, acute vital signs and glucose level, stroke severity, stroke mechanisms, and functional outcomes.
Table 1 Demographic and clinical characteristics
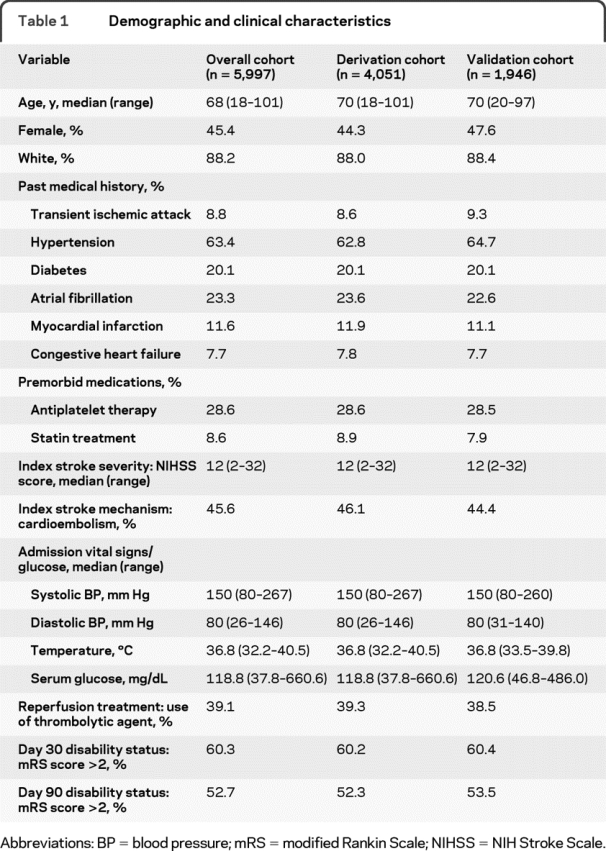
Table 2 shows the cross-tabulation of day 30 mRS vs day 90 mRS. As shown, there was a strong correlation between these 2 measures: the higher the day 30 mRS, the higher the day 90 mRS, Spearman r = 0.873 (p < 0.0001). The corresponding weighted kappa agreement was 0.858 (95% confidence interval [CI] 0.849–0.867), a strong agreement after adjusting for chance agreement. The results were similar after adjustment for covariates using logistic regression (kappa agreement = 0.863, 95% CI 0.848–0.878) and CART (kappa agreement = 0.862, 95% CI 0.847–0.877).
Table 2 Relationship between actual vs predicted day 90 mRS using day 30 mRS as the predicted value, i.e. a cross-tabulation of day 30 and day 90 scores (n = 5,997)
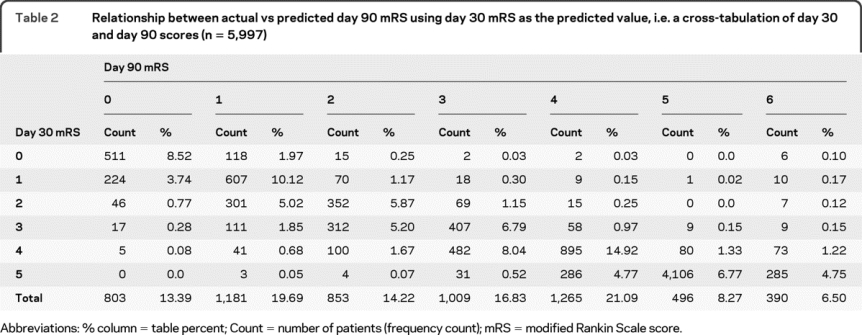
Table 3 lists the main summary statistics for each model, including observed agreement, weighted kappa, mean difference in the observed vs predicted day 90 mRS, and the percentage of observations for which the observed and the predicted values were within 1-point difference. As can be seen, while the observed agreement was fairly low (51%–54%), the observed and the predicted values were within 1-point difference for 91.1%–93.5% of the observations, an overwhelming majority. The mean difference did not exceed two-tenths of a unit in any model. The weighted kappa agreement was similar in all 3 models. Figure 1 displays the probability distributions of the differences (observed − predicted day 90 mRS) (histograms) of the various models depicting the accuracy of the predictions for each model.
Table 3 Summary table of differences in observed vs predicted day 90 modified Rankin Scale scores
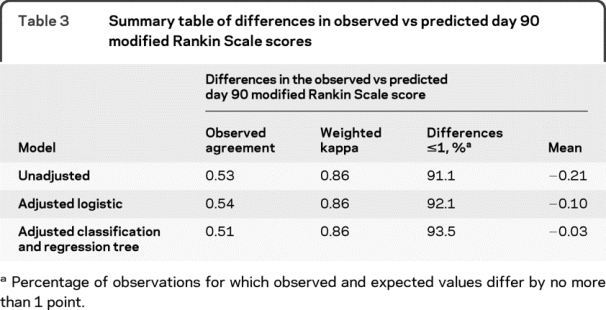
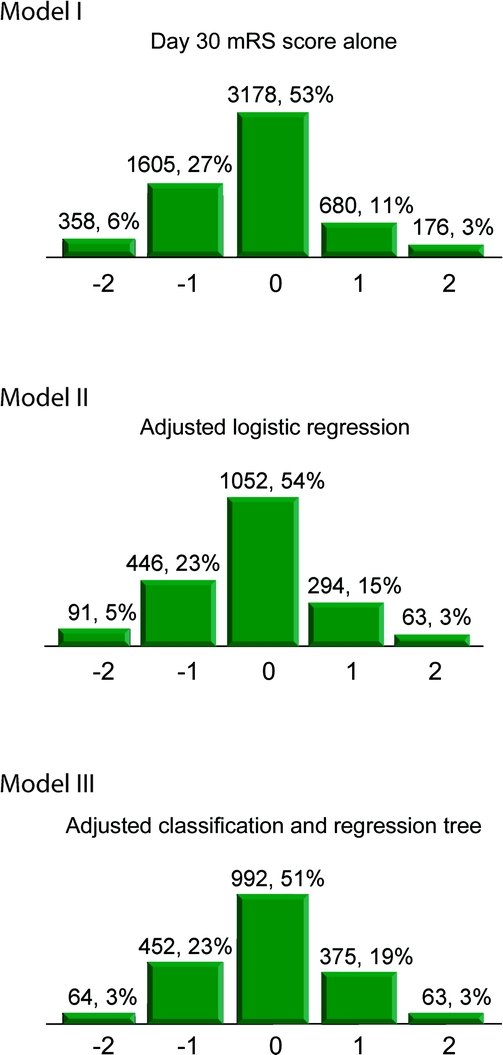
Figure 1 Frequency distributions for differences between observed vs predicted day 90 modified Rankin Scale score (mRS)
Model I (day 30 mRS score alone), Model II (adjusted logistic regression), Model III (adjusted classification and regression tree). Values above each box are count, percentage. Values on the X axis are differences: observed − predicted day 90 mRS. Categories −2 and 2 include observations for which observed and predicted value differ by 2 units or more.
Information on the results of the partial proportional odds logistic regression model as well as the classification and regression tree modeling can be found in appendix e-2; tables e-1, e-2, e-3, and e-4; and figure e-1.
DISCUSSION
This analysis of more than 6,500 subjects enrolled in various international acute ischemic stroke clinical trials demonstrates that final disability outcome, assessed at the 3-month postictus timepoint, is highly correlated to disability level at 1 month. Multivariable models incorporating additional prognostic variables increased predictive power, but only slightly. One-month disability level alone makes such a strong contribution to the variability in final functional status after ischemic stroke that the contributions of other well-established baseline ischemic stroke prognosticators are very minimal. These findings indicate that day 30 mRS by itself may serve as a good proxy for day 90 mRS, when the latter timepoint cannot practically be obtained or early outcome information is needed to drive adaptive clinical trial design algorithms.
The observation that the addition of several well-established demographic and clinical prognostic factors to the models did not substantially improve the prediction of day 90 mRS implies that the effects of these known baseline predictor variables are already nearly fully reflected in day 30 mRS. It is likely that disability evolution between 1 month and 3 months is modified by nonbaseline factors we were unable to examine, such as degree of family and social support, poststroke depression, insurance status, and access to rehabilitation care. This information was not available in enough patients in the VISTA database to permit analysis. However, collectively these variables must have substantially less importance than achieved disability state by day 30, given the variability this factor explains alone.
Our findings have important implications for clinical trial conduct and design. For pivotal clinical trials that use day 90 assessment as the primary study endpoint, an infrequent but not rare occurrence is patients being lost to follow-up between the day 30 and the day 90 visit, as their long-term residence arrangements are formulated. The close correlation of day 30 and day 90 mRS values may potentially support the strategy of using multiple imputation since it appears that with high probability (91%) in a typical imputation, the 3-month score will be the 1-month score plus or minus 1 on the mRS. The results of this study also suggest that more complex methods are unlikely to dramatically improve data imputation, as multivariable models incorporating additional variables increased explain variance only minimally. In addition, these data imply that day 30 mRS outcome could be a valid endpoint measure in trials exploring candidate dose regimens using adaptive designs that require early feedback of treatment results into the selection of next tested dose tiers. Finally, our results may also provide information useful for quality improvement and comparative effectiveness studies that draw upon day 30 outcome data collected by government authorities. Data collected at 30 days on disability outcomes reliably approximate final functional outcome, so using the former as a proxy for the latter could be incorporated into evaluating quality of care.
This study has limitations. It was a post hoc analysis of completed randomized trials, and so, analysis of predictive factors was limited to baseline variables routinely collected in clinical trials. It must also be mentioned that the mRS can be nonsensitive to subtle (yet important) changes in functional status that occur between day 30 and 90, changes that can be better picked up by other scales such as the Barthel Index and Functional Independence Measurement. Furthermore, given the multinational sites of performance of the trials in which the data were collected, findings may have been affected by interobserver variability in mRS assessment across regions.17 However, the validity of our results is strengthened by the inclusion of subjects enrolled in clinical trials from around the world (generalizability), large sample size (>6,500 subjects), analysis of mRS in an ordinal manner (inclusion of broad outcome information, greater statistical study power),18 use of a split-sample approach (goodness of fit), and confirmation of the multivariable logistic regression findings using a CART analysis.
ACKNOWLEDGMENT
The authors thank Daniela Markovic, MS, and Jeffrey Gornbein, DrPh, for statistical consultation, as well as Myzoon Ali, PhD, for data processing.
DISCLOSURE
Dr. Ovbiagele serves as an Assistant Editor of Stroke, an Associate Editor of BMC Public Health, and on the editorial boards of the Journal of Stroke and Cerebrovascular Diseases and Stroke Research and Treatment. Dr. Saver has served/serves on scientific advisory boards for CoAxia, Inc., Concentric Medical, Talecris Biotherapeutics, Grupo Ferrer Internacional SA, AGA Medical Corporation, BrainsGate, PhotoThera, ev3 Inc., and SYGNIS; serves on the editorial boards of Stroke, Reviews in Neurologic Disease, the Journal of Neuroimaging, and the Journal of Stroke and Cerebrovascular Diseases; has received speaker honoraria from Grupo Ferrer Internacional SA; and receives research support from NIH/NINDS (P50 NS044378 [PI] and U01 NS 44364 [PI]) and the American Heart Association. Dr. Lyden serves on a scientific advisory board for CoAxia, Inc.; has received funding for travel from Mitsubishi Tanabe Pharma Corporation and PhotoThera; serves on the editorial boards of Stroke, the International Journal of Stroke, and the Journal of Stroke and Cerebrovascular Disorders; receives royalties from the publication of Thrombolytic Therapy for Acute Ischemic Stroke, Second Edition (Humana Press, 2006); and serves as a consultant for Mitsubishi Tanabe Pharma Corporation, PhotoThera, CoAxia, Inc., and Pfizer Inc.
Supplementary Material
Address correspondence and reprint requests to Dr. Bruce Ovbiagele, Stroke Center and Department of Neurology, University of California at Los Angeles, 710 Westwood Plaza, Los Angeles, CA 90095 Ovibes@mednet.ucla.edu
Supplemental data at www.neurology.org
Study funding: Supported by NIH/NINDS U01 NS 44364 (J.S.).
Disclosure: Author disclosures are provided at the end of the article.
Received November 10, 2009. Accepted in final form May 12, 2010.
REFERENCES
- 1.Lloyd-Jones D, Adams R, Carnethon M, et al. Heart disease and stroke statistics: 2009 update: a report from the American Heart Association Statistics Committee and Stroke Statistics Subcommittee. Circulation 2009;119:480–486. [DOI] [PubMed] [Google Scholar]
- 2.Kim P, Warren S, Madill H, Hadley M. Quality of life of stroke survivors. Qual Life Res 1999;8:293–301. [DOI] [PubMed] [Google Scholar]
- 3.Wolf PA, Kelly-Hayes M, Kase CS, Gresham GE, Beiser A. Prevalence of stroke-related disability: US estimates for the Framingham Study. Neurology 1998;4(suppl 4):A55–A66. [Google Scholar]
- 4.Brown RD, Whisnant JP, Sicks JD, O'Fallon WM, Wiebers DO. Stroke incidence, prevalence, and survival: secular trends in Rochester, Minnesota, through 1989. Stroke 1996;27:373–380. [PubMed] [Google Scholar]
- 5.Marini C, Baldassarre M, Russo T, et al. Burden of first-ever ischemic stroke in the oldest old: Evidence from a population-based study. Neurology 2004;62:77–81. [DOI] [PubMed] [Google Scholar]
- 6.Duncan PW, Jorgensen HS, Wade DT. Outcome measures in acute stroke trials: a systematic review and some recommendations to improve practice. Stroke 2000;31:1429–1438. [DOI] [PubMed] [Google Scholar]
- 7.Savitz SI, Benatar M, Saver JL, Fisher M. Outcome analysis in clinical trial design for acute stroke: physicians' attitudes and choices. Cerebrovasc Dis 2008;26:156–162. [DOI] [PubMed] [Google Scholar]
- 8.Ali M, Bath PM, Curram J, et al. The Virtual International Stroke Trials Archive. Stroke 2007;38:1905–1910. [DOI] [PubMed] [Google Scholar]
- 9.Rankin J. Cerebral vascular accidents in patients over the age of 60: II: prognosis. Scott Med J 1957;2:200–215. [DOI] [PubMed] [Google Scholar]
- 10.Bonita R, Beaglehole R. Recovery of motor function after stroke. Stroke 1988;19:1497–1500. [DOI] [PubMed] [Google Scholar]
- 11.Kasner SE. Clinical interpretation and use of stroke scales. Lancet Neurol 2006;5:603–612. [DOI] [PubMed] [Google Scholar]
- 12.Weimar C, Kurth T, Kraywinkel K, et al. Assessment of functioning and disability after ischemic stroke. Stroke 2002;33:2053–2059. [DOI] [PubMed] [Google Scholar]
- 13.Lai SM, Duncan PW. Stroke recovery profile and the Modified Rankin assessment. Neuroepidemiology 2001;20:26–30. [DOI] [PubMed] [Google Scholar]
- 14.Banks JL, Marotta CA. Outcomes validity and reliability of the modified Rankin scale: implications for stroke clinical trials: a literature review and synthesis. Stroke 2007;38:1091–1096. [DOI] [PubMed] [Google Scholar]
- 15.Brown D, Johnston KC, Wagner DP, Haley EC. Predicting major neurological improvement with intravenous recombinant tissue plasminogen activator treatment of stroke. Stroke 2004;35:147–150. [DOI] [PubMed] [Google Scholar]
- 16.Kent D, Price LL, Ringleb P, Hill MD, Selker HP. Sex-based differences in response to recombinant tissue plasminogen activator in acute ischemic stroke: a pooled analysis of randomized clinical trials. Stroke 2005;36: 62–65. [DOI] [PubMed] [Google Scholar]
- 17.Quinn TJ, Dawson J, Walters MR, Lees KR. Variability in modified Rankin scoring across a large cohort of international observers. Stroke 2008;39:2975–2979. [DOI] [PubMed] [Google Scholar]
- 18.Saver JL. Novel end point analytic techniques and interpreting shifts across the entire range of outcome scales in acute stroke trials. Stroke 2007;38:3055–3062. [DOI] [PubMed] [Google Scholar]
Associated Data
This section collects any data citations, data availability statements, or supplementary materials included in this article.