

Abstract
How early (EADs) and delayed afterdepolarizations (DADs) overcome electrotonic source-sink mismatches in tissue to trigger premature ventricular complexes remains incompletely understood. To study this question, we used a rabbit ventricular action potential model to simulate tissues in which a central area of contiguous myocytes susceptible to EADs or DADs was surrounded by unsusceptible tissue. In 1D tissue with normal longitudinal conduction velocity (0.55 m/s), the numbers of contiguous susceptible myocytes required for an EAD and a barely suprathreshold DAD to trigger a propagating action potential were 70 and 80, respectively. In 2D tissue, these numbers increased to 6940 and 7854, and in 3D tissue to 696,910 and 817,280. These numbers were significantly decreased by reduced gap junction conductance, simulated fibrosis, reduced repolarization reserve and heart failure electrical remodeling. In conclusion, the source-sink mismatch in well-coupled cardiac tissue powerfully protects the heart from arrhythmias due to sporadic afterdepolarizations. Structural and electrophysiological remodeling decrease these numbers significantly but still require synchronization mechanisms for EADs and DADs to overcome the robust protective effects of source-sink mismatch.
Introduction
When an action potential (AP) propagates in cardiac tissue, the wavefront acts as a source of depolarizing current for the adjacent repolarized tissue (the sink). The source current density must be sufficient to bring the sink to its activation threshold, and propagation will fail if the source-sink mismatch is too large. This topic has been extensively studied in both normal and diseased heart for propagating wavefronts (1–5). However, how early (EADs) or delayed afterdepolarizations (DADs) overcome the source-sink mismatch to trigger premature ventricular complexes (PVCs) in tissue remains less clear. If an individual myocyte in well-coupled cardiac tissue is susceptible to an EAD or DAD, then as soon as its membrane potential deviates from that of its normal, unsusceptible neighbors, electrotonic current will flow from the neighbors to minimize the voltage difference. Since the average ventricular myocyte is directly coupled to an average of 11 other myocytes (6,7), the source-sink mismatch will cause an afterdepolarization to be suppressed unless a sufficient number of its neighbors also synchronously develop an afterdepolarization on the same beat. The potential for source-sink mismatches is greatest in three-dimensional (3D) tissue, and decreases with tissue dimension. This is likely to be an important factor promoting EAD- and DAD-induced PVCs in Purkinje fibers, which form a network of interconnected quasi-one-dimensional (1D) cables. Prior theoretical studies have investigated how source-sink relationships affect the ability of analogously small pacemaker currents to generate ectopic pacemakers (1,8–11), and a recent experimental study (12) found that a minimum of 700,000 human mesenchymal stem cells engineered to generate a pacemaker current (with 40% expressing the current) were required to establish a functional ectopy pacemaker in canine ventricle. However, a quantitative analysis of the source-sink requirements for afterdepolarizations to trigger PVCs has not, to our knowledge, been performed. Here, we used computer simulations to address how many contiguous myocytes in 1D, two-dimensional (2D), or 3D tissue must synchronously develop an EAD or DAD to overcome the local source-sink mismatch to generate a PVC that successfully propagates into the surrounding normal tissue. We also explored how factors relevant to structural and electrical heart failure remodeling affect the results.
Methods
Cell AP models
For the normal cardiac AP, we used our previously described rabbit ventricular AP model (13).
EAD model
To generate rate-dependent EADs, we modified the model parameters as described previously (14). We reduced repolarization reserve (RRR) by adding a late Na current (late INa) equivalent to 3% of the maximal Na conductance, as in LQT3. To simulate high β-adrenergic tone, which often promotes EADs, the basal Markovian L-type Ca current was replaced with an equivalent isoproterenol-enhanced Markovian L-type Ca current described previously (14), sarcoplasmic reticulum (SR) Ca uptake rate was doubled, and the Na-K pump current INaK was increased threefold. The model included the standard nonspecific Ca-activated current (Ins(Ca)) formulation from the model of Luo and Rudy (15), with the membrane permeability Pns(Ca) of 0.000000105 cm/s and the half-saturation concentration Kmns(Ca) 0.45 μM. To optimize the ability of a single EAD to trigger a full AP, we adjusted the maximum conductance of Ito,s to 15% of its control value and changed the maximum conductance of Ito,f to 0.4 mS/μF. Although the latter changes were empirical, they are generally consistent with the large transmural variations in Ito density. As shown in Fig. 1 A, when this cell model was paced at a pacing cycle length (PCL) of 600 ms, the paced AP exhibited an EAD of sufficient amplitude to cause a triggered AP.
Figure 1.

(A) Superimposed AP traces corresponding to the normal rabbit ventricular cell AP model (black line), the cell AP model with reduced repolarization reserve (RRR, blue line), and the cell model with an EAD triggering a spontaneous AP (red line). All traces were obtained from a single uncoupled cell paced at a PCL of 600 ms. (B) Superimposed AP traces corresponding to normal (black line) and heart failure (red line) parameters in rabbit ventricular cell AP models, in which the paced AP (PCL 500 ms) is followed by a DAD, which triggers a second AP. (Inset) Corresponding DAD amplitudes when the Na and Ca currents are blocked after the first paced AP. (C) Schematic of 1D tissue, with central region of EAD/DAD susceptible cells demarcated in red, and unsusceptible cells in blue. (D) Schematic of 2D tissue, with central elliptical region of EAD-/DAD-susceptible cells demarcated in red. (E) Schematic of bricklike 2D tissue with fibroblasts (F) randomly interspersed at the ends (I) or sides (II) of the myocytes (M).
DAD model
To generate DADs, we modified the normal rabbit ventricular AP model (13) to allow us to command spontaneous activation of the SR Ca release current at a defined interval after repolarization, similar to the previously described experimental approach for caffeine-induced SR Ca release eliciting DADs (16). A spontaneous Ca release flux was formulated as , where Gspon is the maximum conductance with the value of 0.0674 ms−1, β is the the submembrane space/SR volume ratio, cj and cs are the Ca concentration in the junctional SR and submembrane space, respectively. g1 and g2 are sigmoid functions formulated as and , where t0 = 425 ms and = 10 ms and = 30 ms. This current released stored SR Ca in the cytoplasm, activating the transient inward current (Iti) due to electrogenic Na-Ca exchange (INCX) and Ca-activated nonselective cation current (Ins(Ca)), which generated the DAD (Fig. 1 B). DAD amplitude was controlled by adjusting the maximum release conductance Gspon of the SR Ca release current.
RRR model
We simulated RRR, as might occur with a nonselective delayed rectifier K current blocker such as quinidine, by reducing the maximum conductance of IKr and IKs to 25% of control in the rabbit ventricular AP model (13). Compared to the control conditions, this prolonged AP duration (APD) significantly as a result of RRR (Fig. 1 A) but did not cause EADs per se.
Heart failure electrical remodeling
To simulate the features of electrical remodeling in heart failure, we implemented the alterations described by Shannon et al. (17) in their model of failing rabbit ventricular myocytes by decreasing the maximum conductance of the inward rectifier K current (gK1) and the slow delayed rectifier K current (gKs) by 50%, decreasing SERCA pump uptake strength by 50%, decreasing maximum conductances of both the fast and slow transient outward K currents (gtof and gtos, respectively) by 40%, doubling the electrogenic Na-Ca exchange current, tripling the Ca release strength, and increasing the Ca leak from the SR by a factor of 2.5.
Tissue simulations
1D tissue
We simulated a 6-cm cable (400 cells with cell length 0.15 mm), with the center of the cable (Fig. 1 C, red region) containing a variable number of contiguous cells tuned to exhibit EADs or DADs of sufficient amplitude to trigger an AP when uncoupled (Fig. 1, A and B). The outer tissue contained cells whose APs did not exhibit EADs or DADs.
2D tissue
We simulated a 6 × 1.2-cm sheet (400 × 400 cells with individual cell size of 0.15 × 0.03 mm), with only the cells in the central region exhibiting EADs or DADs, as in the 1D case. We chose an elliptical shape for the central area (Fig. 1 D) such that the cell numbers along both the short and long axes were the same.
3D tissue
We simulated a 6 × 1.2 × 1.2-cm cube (400 × 400 × 400 cells with individual cell size of 0.15 × 0.03 × 0.03 mm), with only the cells in the central region exhibiting EADs or DADs. The central region was set to an ellipsoid with all three axes corresponding to the same number of cells.
Gap junction conductance and anisotropy ratio
To investigate the effects of cell-to-cell diffusive coupling strength (via gap junctions), we tested strong coupling with a large gap junction conductance of 780 nS, producing a normal longitudinal conduction velocity (CV) of 0.55 m/s and a transverse CV of 0.11 m/s; and weak coupling, with a reduced gap junction conductance of 125 nS, producing a slower longitudinal CV of 0.22 m/s and a transverse CV of 0.044 m/s. Note that the gap junction conductance between two cells in the longitudinal direction was set to be the same as that in the transverse direction (18). Since we assumed no intracellular resistance, the anisotropic ratio is simply the aspect ratio of the cell, i.e., 5:1. In some simulations, we also varied the longitudinal and transverse gap junction conductance independently to change the anisotropy ratio.
Fibrosis
In 2D tissue, we simulated fibrosis by randomly interposing fibroblasts at either the ends (Fig. 1 E, left) or the sides (Fig. 1 E, right) of myocytes, using our previously described methods (19,20). The surface of each myocyte (0.15 × 0.03 mm) was divided into five segments containing gap junctions with overlapping segments from adjacent myocyte segments. Interspersed fibroblasts (0.03 × 0.03 mm) were equivalent to one-fifth the size of a myocyte, with no gap junctions. For the case in which fibroblasts were interposed at the ends of myocytes, the fibroblast/myocyte ratio was adjusted to produce a longitudinal CV of 0.22 m/s for a planar wave through the tissue when the normal gap junction conductance of 780 nS was used. For the case in which fibroblasts were interposed at the sides of myocytes, a wide range of fibroblast/myocyte ratios were simulated.
Computational methods
The membrane voltage (V) of a myocyte is governed by
| (1) |
where Cm is the membrane capacitance of a myocyte, Iion is the corresponding membrane current, n is the number of coupled neighbors, and is the gap junction conductance between a cell and its kth neighbor. is constant in the uniform tissue models but varies from coupling to coupling in the model with interposed fibroblasts (19). We used an operator splitting method with an adaptive time step that varied from 0.01 ms to 0.1 ms.
Results
Requirements for afterdepolarizations to trigger PVCs in well-coupled 1D, 2D, and 3D tissue
Using our rabbit ventricular AP cell model (13), we simulated 1D, 2D, and 3D tissues in which the central region contained cells with parameters modified to make them susceptible to EADs or DADs triggering spontaneous APs when uncoupled from other cells (Fig. 1, C–E, red region). The outer surrounding regions contained unsusceptible cells with normal parameters that did not generate EADs or DADs. The number of susceptible myocytes in the central region was then progressively increased until EADs or DADs triggered APs that propagated successfully into the surrounding normal tissue. As shown in Fig. 2 A, for a normal gap junction conductance (Ggap = 780 nS) producing a CV of 0.55 m/s, the length of the central region required for EADs to generate an AP that propagated throughout a 1D cable was 10.5 mm, corresponding to 70 myocytes. With 69 myocytes or less, the EAD decayed without initiation of a propagating new wavefront.
Figure 2.
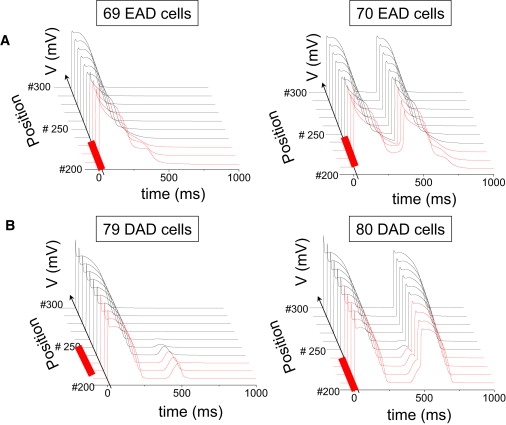
(A) Selected AP traces along a 1D cable, with the red traces indicating the EAD-susceptible cells in the central region, and the normal unsusceptible cells in black. The EAD failed to propagate with 69 susceptible cells in the central region (left), but propagated successfully with 70 susceptible cells (right). (B) Same as for A, but with the central region exhibiting DAD-susceptible cells. The DAD failed to trigger an AP with 79 susceptible (B) cells in the central region (left), but did so successfully with 80 susceptible cells (right). Gap junction conductance was 780 nS.
For the DAD case, the threshold depolarization required to trigger an AP was 24.4 mV (from −87.3 to −62.9 mV), and the DAD amplitude of 24.6 mV was above this threshold by only 0.2 mV. For a central region of myocytes generating DADs, the length required to trigger a propagating AP was 12 mm, corresponding to 80 myocytes (Fig. 2 B). However, if the total SR Ca released was increased to augment the DAD amplitude further above the AP threshold, the required number of cells decreased significantly (Fig. 3 B), eventually approaching the minimum number of cells required for a 2-ms stimulus to elicit a propagated AP (10–20 myocytes, depending on the stimulus amplitude). The corresponding DAD amplitude at this point was ∼50 mV. Fig. 3 A also shows that the rate of SR Ca release is a critical determinant of rate of rise and peak amplitude of the DAD, such that a much greater amount of total SR Ca release is required to reach the AP threshold if the release time constant is lengthened from 10 to 50 ms.
Figure 3.
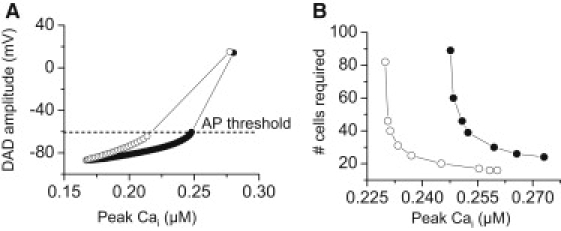
(A) DAD amplitude as a function of the total amount of SR Ca release in a single myocyte. A larger total amount of SR Ca release is required for the DAD to reach threshold when the SR Ca release time constant was increased from τ1 = 10 ms (open circles) to 50 ms (solid circles). (B) Number of contiguous DAD-susceptible myocytes in the central region of a 6-cm 1D cable required for the DAD to trigger a PVC versus the total amount of SR Ca released for a normal (open circles, τ1 = 10 ms) versus a slowed (solid circles, τ1 = 50 ms) SR Ca release time constant.
For the same gap junction conductance, Ggap = 780 nS in 2D or 3D tissue, the required area/volume and corresponding numbers of myocytes to generate a triggered AP increased exponentially (Table 1, second column). For EADs, the numbers increased from 70 myocytes in 1D to 6940 myocytes in 2D and 696,910 myocytes in 3D tissue. For DADs, the corresponding numbers were 80 myocytes, 7854 myocytes, and 817,280 myocytes. For a half-ellipse in 2D tissue, or a half-ellipsoid in 3D tissue, half the number of myocytes was required, since the total sink was reduced by 50%.
Table 1.
Number of contiguous myocytes with an EAD or DAD required to trigger a PVC in 1D, 2D, or 3D tissue
| EADs | ||||||||
|---|---|---|---|---|---|---|---|---|
| EAD/Normal Ggap = 780 nS | EAD/Normal GGap = 125 nS | EAD/Normal + Fibrosis GGap = 780 nS | EAD/Normal + Fibrosis Ggap = 125 nS | EAD/RRR Ggap = 780 nS | EAD/RRR Ggap = 125 nS | EAD/RRR + Fibrosis Ggap = 780 nS | EAD/RRR + Fibrosis Ggap = 125 nS | |
| 1D (cable) | 70 (10.5 mm) | 30 (4.5 mm) | — | — | 46 (6.9 mm) | 20 (3.0 mm) | - | - |
| 2D (ellipse) | 6940 (d = 14.1) | 1135 (d = 5.7) | 1,668 (d = 7.8) | 268 (d = 3.0) | 3217 (d = 9.6) | 531 (d = 3.9) | 504 (d = 4.2) | 112 (d = 1.8) |
| 3D (ellipsoid) | 696,910 (d = 16.5) | 50,965 (d = 6.9) | — | — | 229,850 (d = 11.4) | 17,157 (d = 4.8) | - | - |
| DADs | ||||||||
| DAD/Normal Ggap = 780 nS | DAD/Normal Ggap = 125 nS | DAD/Normal + Fibrosis Ggap = 780 nS | DAD/Normal + Fibrosis Ggap = 125 nS | DAD/HF Ggap = 780 nS | DAD/HF Ggap = 125 nS | DAD/HF +Fibrosis Ggap = 780 nS | DAD/HF + Fibrosis Ggap = 125 nS | |
| 1D (cable) | 80 (d = 12) | 32 (d = 4.8) | — | — | 22 (d = 3.3) | 10 (d = 1.5) | - | - |
| 2D (ellipse) | 7854 (d = 15) | 1256 (d = 6.3) | 1668 (d = 7.8) | 316 (d = 3.3) | 1018 (d = 5.4) | 202 (d = 2.4) | 136 (d = 1.5) | 40 (d = 0.9) |
| 3D (ellipsoid) | 817,280 (d = 17.4) | 57,906 (d = 7.2) | — | — | 50,965 (d = 6.9) | 4,189 (d = 3.0) | - | - |
EAD/Normal refers to a central region of cells that exhibit EADs surrounded by normal cells without EADs. The case is similar for the other labels, where the surrounding tissue was either normal or exhibited reduced repolarization reserve, heart failure changes (HF), or fibrosis. Gap junction conductance (Ggap) is also indicated for each case. Numbers in parentheses refer to the size (d) of the central region (in millimeters along the major axis) with cells that exhibit EADs or DADs.
Effects of reduced gap junction conductance, anisotropy, and fibrosis
We performed analogous simulations using a gap junction conductance 6.25-fold smaller (Ggap = 125 nS), which reduced CV to 0.22 m/s. The size of the central region required for EADs or DADs to trigger a propagating AP was significantly reduced (Table 1, third column), proportionately more in 3D than 2D than 1D (by 93%, 84%, and 57% for EADs, and by 93%, 84%, and 60% for DADs), as previously described for ectopic pacemaking (10). This finding indicates that reduced cellular coupling, as might result from gap junction remodeling in heart disease, significantly decreases the threshold for EADs or DADs to induce PVCs.
In a recent study of pacemaking cells, Tveito et al. (10) showed that the number of cells required to form a propagated AP scaled with the square root of the gap junction conductance in a 1D cable, and scaled with Ggap in 2D tissue. We observed an approximately similar relationship in our simulations for EAD and DAD propagation. As indicated by the numbers in Table 1, where Ggap = 780 nS is compared to Ggap = 125 nS, a 6.25-fold change in Ggap reduced the number of myocytes required in 1D tissue by ∼2.5-fold (for EADs, 70/30 = 2.33; for DADs, 80/32 = 2.5). In 2D tissue, the cell numbers had an ∼6.25-fold change (for EADs, 6940/1135 = 6.11; for DADs, 7854/1256 = 6.25).
To study the effects of anisotropy on the number of mycoytes required for EAD and DAD propagation, we reduced Ggap by 6.25-fold in the longitudinal direction only, which reduced the anisotropic ratio to 2:1, compared to 5:1 with uniform gap junction conductance (since in the latter case the anisotropy ratio is equivalent to the aspect ratio of the myocytes, 150 × 30 μm). Based on the 2D scaling relationship above, i.e., that number of myocytes required should scale with , we predict that if anisotropy had no additional independent effect, then a 6.25-fold decrease in Ggapx should reduce the number of myocytes required by 2.5-fold. In the actual 2D tissue simulation, this number decreased 2.48-fold for EADs (from 6940 to 2802) and 2.5-fold for DADs (from 7854 to 3142). This good agreement indicates that anisotropy per se has little effect on number of myocytes required for EADs or DADs to trigger PVCs in our model. On the other hand, when the gap junction conductance is reduced to very low levels that promote discontinuous conduction, anisotropy may become independently important, as shown in the study by Wilders et al. (8).
Since fibrosis is also a feature of structural remodeling in heart disease, we examined the effects of randomly inserting fibroblasts into 2D tissue. When fibroblasts were inserted at the ends of myocytes (Fig. 1 E, I), a myocyte/fibroblast ratio of 1:1.5 reduced CV to 0.22 m/s, the equivalent CV for Ggap = 125 nS in uniform tissue. As shown in Table 1 (fourth column), the effects were similar to the case for Ggap = 125 nS. When this fibroblast configuration was combined with reduction of the Ggap to 125 nS, CV decreased further to 0.06 m/s, synergistically decreasing the number of cells needed to trigger an AP from 6940 to 268 for EADs and from 7854 to 316 for DADs (Table 1, fifth column).
Fibrosis was also simulated by interposing fibroblasts laterally along the sides of myocytes (Fig. 1 E, II). In this configuration, the conduction pathway remained intact in the longitudinal direction (end to end), similar to a 1D cable. However, transverse conduction was progressively impaired and failed at a critical fibroblast/myocyte ratio, leaving only 1D longitudinal conduction intact. Fig. 4 shows that this configuration of fibrosis was the most potent at reducing the number of myocytes required to trigger an AP, from 6940 to 280 for EADs and from 7854 to 160 for DADs.
Figure 4.
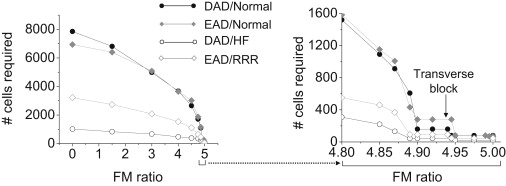
Number of contiguous susceptible myocytes required to trigger an EAD- or DAD-mediated PVC in simulated 2D tissue with lateral fibrosis. Fibroblasts were randomly interspersed exclusively along the sides of myocytes throughout the entire tissue (Fig. 1E, II), with EAD- or DAD-susceptible myocytes only in the central region. As the fibroblast/myocyte (FM) ratio increased, the required size of the central region (and hence the number of susceptible cells in the central region) progressively decreased, approaching the 1D case at the maximum FM ratio of ∼5, above which transverse propagation failed. The expanded region of FM ratio 4.8–5.0 is shown at right. EAD/Normal refers to EAD-susceptible cells in the central region surrounded by nonsusceptible normal cells. The other labels can be interpreted similarly, where the surrounding tissue was either normal or exhibited RRR or HF changes. Gap junction conductance (Ggap) is 780 nS in all cases.
Effects of altered tissue sensitivity to EADs and DADs
In the simulations above, we assumed that the EAD- and DAD-generating central regions (the source) were interposed between otherwise normal tissue (the sink). Under these conditions, the sink is relatively strong compared to the source. In heart failure remodeling, genetic channelopathies, or drug-induced proarrhythmias, however, none of the tissue is completely normal. To explore how a weaker sink for the equivalent source affects the size of the central region required for EADs or DADs to trigger an AP, we studied the effects of modifying the electrophysiological properties of the outer regions in 1D, 2D, and 3D tissue with the same EAD- and DAD-generating parameter settings in the central (red) region.
For the EAD case, we replaced the AP cell model in the outer regions with an AP cell model with RRR, achieved by decreasing GKr and GKs to 25% in the normal AP cell model (e.g., as might occur with a nonselective delayed rectifier K channel blocker such as quinidine), which prolonged APD from 190 to 335 ms (Fig. 1 A). For the identical EAD source current, the size of the central region required for EADs or DADs to trigger an AP that propagated through the outer regions with RRR was significantly decreased, by 34% in 1D, 54% in 2D, and 67% in 3D tissue (Table 1).
Reducing the gap junction conductance to 125 nS or simulating fibrosis had effects proportionately similar to the case where normal myocytes surrounded the central EAD- or DAD-generating myocytes (Table 1 and Fig. 4).
For DADs, we simulated heart failure (HF) changes described in failing rabbit ventricular myocytes (17). For the equivalent spontaneous elevation in diastolic cytoplasmic Ca, this had the effect of more than doubling the amplitude of the DAD from 24.6 to 54.2 mV (Fig. 1 B), so that the DAD now exceeded the threshold required to trigger an AP by 24.4 mV. This significantly reduced the size of the central region required for DADs to trigger an AP, by 72.5% for 1D, 87% for 2D, and 94% for 3D tissue (Table 1). The reduction was proportionately similar when the gap junction conductance was reduced to 125 nS or fibrosis decreased CV to 0.22 m/s or both occurred in combination.
When fibrosis and reduction of gap junction conductance were combined together in the RRR and HF cases, the number of cells needed for an EAD or DAD to trigger an AP decreased from 3217 to 112 for EADs and from 707 to 40 for DADs when fibroblasts were positioned between the ends of myocytes (Table 1, ninth column). When fibroblasts were positioned between the sides of myocytes, the corresponding numbers of myocytes were 92 for EADs and 44 for DADs at the maximum fibroblast/myocyte ratio at which transverse propagation was successful (Fig. 4).
Discussion
The role of source-sink relationships in determining conduction velocity and onset of conduction block has been well studied for APs propagating through tissue (1–4). By analogy, the critical importance of this factor in allowing afterdepolarizations to initiate propagating APs in tissue is widely acknowledged but has not been previously studied quantitatively in any detail. In this study, we used simulations to address the question of how many contiguous myocytes with a synchronous EAD or DAD are required to trigger a PVC that propagates into adjacent tissue. In normal tissue, the numbers are quite large (Table 1), especially in 3D tissue, which requires hundreds of thousands of contiguous myocytes. Although direct experimental validation is difficult to obtain, our estimates for 3D tissue can be compared to experimental evidence from Plotnikov et al. (12) who studied the requirements for biological pacemaker formation. Using human mesenchymal stem cells engineered to generate a pacemaker current, they required a minimum of 700,000 cells (40% of which expressed the pacemaker current) injected into ventricular myocardium to establish a reliable pacemaker. This agrees reasonably well with our estimate of ∼800,000 cells for DADs (Table 1), given the different cell type, diastolic depolarization rather than DAD, and the probability that subendocardially injected cells form a hemiellipsoid, rather than a full ellipsoid, shape (reducing the total sink and number of required cells by 50%).
Our findings strongly support the common perception that afterdepolarizations are most likely to arise from lower-dimensional tissue structures, such as Purkinje fibers, which resemble a network of quasi-1D cables, or surviving quasi-2D border-zone tissue overlying infarctions. This predilection is purely due to source-sink factors, irrespective of whether uncoupled Purkinje cells or remodeled border-zone cells are also intrinsically more susceptible to afterdepolarizations. Even in a 1D cable with normal CV, however, the number of contiguous myocytes required for an EAD to trigger an AP was 70, and the corresponding number for a barely suprathreshold DAD was 80. Thus, the source-sink mismatch in well-coupled cardiac tissue is a powerful mechanism that protects the heart from arrhythmias due to sporadic afterdepolarizations, even in quasi-1D Purkinje fibers.
On the other hand, when the effective diffusive coupling in tissue is reduced as a result of structural remodeling (either reduced gap-junction coupling or fibrosis), the required numbers of contiguous myocytes exhibiting EADs or DADs decrease markedly (Table 1). Even so, the numbers are still substantial, emphasizing that synchronization mechanisms must exist for EADs and DADs to overcome the source-sink mismatch. For example, in Table 1, the lowest number of myocytes required for an afterdepolarization to propagate successfully as a PVC was 10 (for the DAD/HF case in 1D). If the probability of a DAD occurring in a myocyte on any given beat were 0.5, then the probability of 10 contiguous myocytes all having a DAD on the same beat would be (0.5)10 = 0.001, a very small number. For the DAD to propagate >50% of the time, the required probability, p, of a DAD occurring in each of the 10 myocytes on the same beat would need to be p10 > 0.5, or p > 0.93. If 80 myocytes were required, p would have to exceed 0.99. Similar numbers apply to EADs.
We recently described a synchronization mechanism for EADs based on the evidence that the irregularity of EADs is a form of dynamical chaos (14,21). Similar behaviors have also been observed experimentally in cardiac tissue subjected to EAD-generating conditions (14,22,23). Potential mechanisms by which DADs synchronize in tissue are less clear. In a recent confocal imaging study in intact ventricular muscle (24), individual myocytes paced at slow heart rates exhibited sporadic Cai waves that were never associated with DADs, whereas rapid pacing induced synchronous SR Ca release waves in many adjacent myocytes, thereby overcoming the source-sink mismatch and allowing DADs to occur. From the calculations above, as the probability of spontaneous SR Ca release approaches unity, the source-sink relationship becomes more and more favorable for DAD formation. Thus, in tissue, the strong dependence of DAD amplitude on heart rate (25) may be as much related to the increased number of myocytes developing spontaneous SR Ca release waves as to the amplitude of the Ca waves in individual myocytes. A recent study (26) also found that DADs and triggered activity induced by rapid pacing in Langendorff rabbit ventricles arose preferentially from the endocardial His-Purkinje system. Both the quasi-1D structure and increased “diastolic Ca-voltage coupling gain” in Purkinje fibers (26), may contribute to this finding. Our simulations also show that, consistent with experimental observations (27), the rate of rise of SR Ca release is a critical determinant of DAD amplitude (Fig. 3 A), which strongly influences the number of myocytes required to trigger an AP (Fig. 3 B).
Another feature that influences source-sink relationships in 2D and 3D tissue is curvature of the interface between the normal myocytes and those primed to develop afterdepolarzations. These effects of curvature explain why the number of contiguous myocytes required to trigger an AP in 2D is greater than the square of the number required in 1D (by factors of ∼1.4 for EADs and ∼1.2 for DADs (see Table 1)). This is because in 2D, the ellipse of susceptible myocytes has positive curvature, which imposes an additional load for the same source. In 3D tissue, the number of contiguous myocytes required to trigger an AP is likewise greater than the cube of the number required in 1D (by factors of ∼2.0 for EADs and ∼1.6 for DADs (see Table 1)). The multiplier factors are larger than for 2D, since the curvature is bidirectional for the ellipsoid of susceptible myocytes in 3D.
Our findings show that both structural and electrical remodeling can significantly reduce the number of contiguous myocytes required for an EAD or DAD to trigger a propagating PVC. In the case of EADs, reducing repolarization reserve of the surrounding tissue facilitated the ability of EADs to propagate. We attribute this effect to the surrounding tissue creating less of a sink, so that less current from the EAD-generating central tissue is required to bring the surrounding tissue to the threshold for triggering an AP. On the other hand, the longer APD in the surrounding tissue also suppresses Na and Ca current recovery from inactivation for a longer time, which might be expected to make it more difficult to excite the surrounding tissue. However, the latter factor does not have a major impact, since, as shown by Tveito et al. (10), the ability of a local PVC to form is determined mainly by stability and not by propagation per se. This can be seen in Fig. 2. Below the critical cell number, EADs that occur in isolated myocytes are completely suppressed in the 1D cable due to electrotonic sink from the surrounding myocytes. Only above the critical number does an EAD form and generate a triggered AP. Although Na and Ca channel recovery may have an effect on triggering the AP, the electrotonic sink from the surrounding cells plays the major role. Under the RRR condition, longer APD of the surrounding myocytes reduces the sink effect to the adjacent EAD-susceptible myocytes, so that it becomes easier for triggered APs to occur.
In the case of DADs, electrical remodeling causes both downregulation of IK1 and upregulation of INCX, which increase diastolic Ca-voltage coupling gain (26). Thus, the same spontaneous SR Ca release generates a much larger DAD (Fig. 1 B, inset), thereby decreasing the number of myocytes required for the DAD to trigger a propagating AP.
The combined effects of electrical and structural remodeling were synergistic for both EADs and DADs, consistent with previous experimental and simulation studies, where decoupling favored propagation of ectopic beats (8,9). We studied two configurations of fibrosis (although the possible configurations are endless). Fibroblasts interposed exclusively between the ends of myocytes had effects quantitatively similar to those of reduced gap junction conductance for the equivalent degree of CV slowing (Table 1). Thus, whether the effective diffusion coefficient is reduced uniformly (by reduced gap junction conductance) or by small obstacles (fibroblasts), the effects are similar. In contrast, fibroblasts interposed exclusively between the sides of myocytes are more potent at reducing the number of myocytes required to trigger an EAD- or DAD-mediated PVC. This is because as the fibroblast/myocyte ratio increases, the 2D tissue becomes more like a stack of longitudinal 1D fibers, with only occasional transverse myocyte-myocyte connections available to support transverse propagation (like a percolation lattice). Thus, the number of myocytes required to trigger an EAD- or DAD-mediated PVC approached that in the 1D case (Fig. 4), decreasing from 6940 to 280 for EADs and from 7854 to 160 for DADs.
Several limitations of this study should be mentioned. The number of cells was determined from the tissue dimensions by assuming a typical myocyte size, and so are approximate. We simulated fibrosis in 2D tissue only, due to computational intractability for 3D simulations. We represented fibroblasts as nonconducting obstacles without gap junction coupling to myocytes, although recent coculture evidence indicates that myofibroblasts can form functional gap junctions with myocytes (28). In 2D and 3D tissue, we studied elliptical central regions with the same number of cells along the major and minor axes. However, our preliminary investigations indicate that the elliptical shape (equivalent to a circle in isotropic tissue) is the most efficient for minimizing the overall source-sink mismatch. The number of cells required for an EAD or DAD to trigger a PVC depends on the take-off potential and amplitude of the afterdepolarization, as well as the excitability of the surrounding unprimed tissue, and we only explored a limited range of conditions.
Conclusions
Even in the His-Purkinje system, which is quasi-1D, afterdepolarizations have to occur synchronously in a substantial number of myocytes to trigger an AP. Decreased cell coupling (e.g., reduced gap junction density and fibrosis) markedly lowers the required numbers of cells for both DADs and EADs, as do electrical remodeling in heart failure (RRR for EADs, and decreased inward rectifier K conductance and increased Na-Ca exchange for DADs). However, especially for 3D tissue, the numbers remain significant. These findings imply that synchronization mechanisms must also exist to overcome the robust protective effects of source-sink mismatch.
Acknowledgments
This study was supported by the National Institutes of Health/National Heart, Lung, and Blood Institute grants P01 HL078931, R01 HL103662, Postdoctoral fellowship awards from the American Heart Association, Western States Affiliate, and the Laubisch and Kawata Endowments.
References
- 1.Joyner R.W., Sugiura H., Tan R.C. Unidirectional block between isolated rabbit ventricular cells coupled by a variable resistance. Biophys. J. 1991;60:1038–1045. doi: 10.1016/S0006-3495(91)82141-5. [DOI] [PMC free article] [PubMed] [Google Scholar]
- 2.Shaw R.M., Rudy Y. Ionic mechanisms of propagation in cardiac tissue. Roles of the sodium and L-type calcium currents during reduced excitability and decreased gap junction coupling. Circ. Res. 1997;81:727–741. doi: 10.1161/01.res.81.5.727. [DOI] [PubMed] [Google Scholar]
- 3.Spach M.S., Boineau J.P. Microfibrosis produces electrical load variations due to loss of side-to-side cell connections: a major mechanism of structural heart disease arrhythmias. Pacing Clin. Electrophysiol. 1997;20:397–413. doi: 10.1111/j.1540-8159.1997.tb06199.x. [DOI] [PubMed] [Google Scholar]
- 4.Rohr S., Kucera J.P., Kléber A.G. Paradoxical improvement of impulse conduction in cardiac tissue by partial cellular uncoupling. Science. 1997;275:841–844. doi: 10.1126/science.275.5301.841. [DOI] [PubMed] [Google Scholar]
- 5.Wang Y.G., Kumar R., Joyner R.W. Electrical interactions between a real ventricular cell and an anisotropic two-dimensional sheet of model cells. Am. J. Physiol. Heart Circ. Physiol. 2000;278:H452–H460. doi: 10.1152/ajpheart.2000.278.2.H452. [DOI] [PubMed] [Google Scholar]
- 6.Hoyt R.H., Cohen M.L., Saffitz J.E. Distribution and three-dimensional structure of intercellular junctions in canine myocardium. Circ. Res. 1989;64:563–574. doi: 10.1161/01.res.64.3.563. [DOI] [PubMed] [Google Scholar]
- 7.Peters N.S., Wit A.L. Myocardial architecture and ventricular arrhythmogenesis. Circulation. 1998;97:1746–1754. doi: 10.1161/01.cir.97.17.1746. [DOI] [PubMed] [Google Scholar]
- 8.Wilders R., Wagner M.B., Jongsma H.J. Effects of anisotropy on the development of cardiac arrhythmias associated with focal activity. Pflugers Arch. 2000;441:301–312. doi: 10.1007/s004240000413. [DOI] [PubMed] [Google Scholar]
- 9.Pumir A., Arutunyan A., Sarvazyan N. Genesis of ectopic waves: role of coupling, automaticity, and heterogeneity. Biophys. J. 2005;89:2332–2349. doi: 10.1529/biophysj.105.061820. [DOI] [PMC free article] [PubMed] [Google Scholar]
- 10.Tveito A., Lines G.T. A condition for setting off ectopic waves in computational models of excitable cells. Math. Biosci. 2008;213:141–150. doi: 10.1016/j.mbs.2008.04.001. [DOI] [PubMed] [Google Scholar]
- 11.Joyner R.W., Wang Y.G., Goolsby W.N. A spontaneously active focus drives a model atrial sheet more easily than a model ventricular sheet. Am. J. Physiol. Heart Circ. Physiol. 2000;279:H752–H763. doi: 10.1152/ajpheart.2000.279.2.H752. [DOI] [PubMed] [Google Scholar]
- 12.Plotnikov A.N., Shlapakova I., Rosen M.R. Xenografted adult human mesenchymal stem cells provide a platform for sustained biological pacemaker function in canine heart. Circulation. 2007;116:706–713. doi: 10.1161/CIRCULATIONAHA.107.703231. [DOI] [PubMed] [Google Scholar]
- 13.Mahajan A., Shiferaw Y., Weiss J.N. A rabbit ventricular action potential model replicating cardiac dynamics at rapid heart rates. Biophys. J. 2008;94:392–410. doi: 10.1529/biophysj.106.98160. [DOI] [PMC free article] [PubMed] [Google Scholar]
- 14.Sato D., Xie L.H., Qu Z. Synchronization of chaotic early afterdepolarizations in the genesis of cardiac arrhythmias. Proc. Natl. Acad. Sci. USA. 2009;106:2983–2988. doi: 10.1073/pnas.0809148106. [DOI] [PMC free article] [PubMed] [Google Scholar]
- 15.Luo C.H., Rudy Y. A dynamic model of the cardiac ventricular action potential. I. Simulations of ionic currents and concentration changes. Circ. Res. 1994;74:1071–1096. doi: 10.1161/01.res.74.6.1071. [DOI] [PubMed] [Google Scholar]
- 16.Schlotthauer K., Bers D.M. Sarcoplasmic reticulum Ca2+ release causes myocyte depolarization. Underlying mechanism and threshold for triggered action potentials. Circ. Res. 2000;87:774–780. doi: 10.1161/01.res.87.9.774. [DOI] [PubMed] [Google Scholar]
- 17.Shannon T.R., Wang F., Bers D.M. Regulation of cardiac sarcoplasmic reticulum Ca release by luminal [Ca] and altered gating assessed with a mathematical model. Biophys. J. 2005;89:4096–4110. doi: 10.1529/biophysj.105.068734. [DOI] [PMC free article] [PubMed] [Google Scholar]
- 18.Yao J.A., Gutstein D.E., Wit A.L. Cell coupling between ventricular myocyte pairs from connexin43-deficient murine hearts. Circ. Res. 2003;93:736–743. doi: 10.1161/01.RES.0000095977.66660.86. [DOI] [PubMed] [Google Scholar]
- 19.Xie Y., Garfinkel A., Qu Z. Cardiac alternans induced by fibroblast-myocyte coupling: mechanistic insights from computational models. Am. J. Physiol. Heart Circ. Physiol. 2009;297:H775–H784. doi: 10.1152/ajpheart.00341.2009. [DOI] [PMC free article] [PubMed] [Google Scholar]
- 20.Xie Y., Garfinkel A., Qu Z. Effects of fibroblast-myocyte coupling on cardiac conduction and vulnerability to reentry: a computational study. Heart Rhythm. 2009;6:1641–1649. doi: 10.1016/j.hrthm.2009.08.003. [DOI] [PMC free article] [PubMed] [Google Scholar]
- 21.Tran D.X., Sato D., Qu Z. Bifurcation and chaos in a model of cardiac early afterdepolarizations. Phys. Rev. Lett. 2009;102:258103–258104. doi: 10.1103/PhysRevLett.102.258103. [DOI] [PMC free article] [PubMed] [Google Scholar]
- 22.Choi B.R., Burton F., Salama G. Cytosolic Ca2+ triggers early afterdepolarizations and Torsade de Pointes in rabbit hearts with type 2 long QT syndrome. J. Physiol. 2002;543:615–631. doi: 10.1113/jphysiol.2002.024570. [DOI] [PMC free article] [PubMed] [Google Scholar]
- 23.Asano Y., Davidenko J.M., Jalife J. Optical mapping of drug-induced polymorphic arrhythmias and torsade de pointes in the isolated rabbit heart. J. Am. Coll. Cardiol. 1997;29:831–842. doi: 10.1016/s0735-1097(96)00588-8. [DOI] [PubMed] [Google Scholar]
- 24.Fujiwara K., Tanaka H., Takamatsu T. Burst emergence of intracellular Ca2+ waves evokes arrhythmogenic oscillatory depolarization via the Na+-Ca2+ exchanger: simultaneous confocal recording of membrane potential and intracellular Ca2+ in the heart. Circ. Res. 2008;103:509–518. doi: 10.1161/CIRCRESAHA.108.176677. [DOI] [PubMed] [Google Scholar]
- 25.Rosen M.R., Danilo P., Jr. Effects of tetrodotoxin, lidocaine, verapamil, and AHR-2666 on Ouabain-induced delayed afterdepolarizations in canine Purkinje fibers. Circ. Res. 1980;46:117–124. doi: 10.1161/01.res.46.1.117. [DOI] [PubMed] [Google Scholar]
- 26.Maruyama M., Joung B., Chen P.S. Diastolic intracellular calcium-membrane voltage coupling gain and postshock arrhythmias: role of purkinje fibers and triggered activity. Circ. Res. 2010;106:399–408. doi: 10.1161/CIRCRESAHA.109.211292. [DOI] [PMC free article] [PubMed] [Google Scholar]
- 27.Hoeker G.S., Katra R.P., Laurita K.R. Spontaneous calcium release in tissue from the failing canine heart. Am. J. Physiol. Heart Circ. Physiol. 2009;297:H1235–H1242. doi: 10.1152/ajpheart.01320.2008. [DOI] [PMC free article] [PubMed] [Google Scholar]
- 28.Miragoli M., Salvarani N., Rohr S. Myofibroblasts induce ectopic activity in cardiac tissue. Circ. Res. 2007;101:755–758. doi: 10.1161/CIRCRESAHA.107.160549. [DOI] [PubMed] [Google Scholar]