

Abstract
Single-point fluorescence correlation spectroscopy (FCS) of membrane-bound molecules suffers from a number of limitations leading to inaccurate estimation of diffusion parameters. To overcome such problems and with the overall goal of addressing membrane heterogeneities, we performed z-scan FCS (zFCS) of the serotonin1A receptor. We analyzed the results according to FCS diffusion laws that provide information on the organization of the diffusing species. Analysis of our results shows that the diffusion coefficients of the receptor and a fluorescently labeled phospholipid are similar when probed at length scales ∼210 nm. We discuss the significance of the spatiotemporal evolution of dynamics of membrane-bound molecules in the overall context of membrane domains and heterogeneity. Importantly, our results show that the serotonin1A receptor exhibits confinement in cell membranes, possibly due to interaction with the actin cytoskeleton. Surprisingly, depletion of membrane cholesterol appears to reduce receptor confinement in a manner similar to that observed in the case of cytoskeletal destabilization, implying possible changes in the actin cytoskeleton induced upon cholesterol depletion. These results constitute the first report on G-protein-coupled receptor dynamics utilizing a combination of zFCS and the FCS diffusion laws, and present a convenient approach to explore cell membrane heterogeneity at the submicron level.
Introduction
Biological membranes are complex two-dimensional, noncovalent anisotropic assemblies of a diverse variety of lipids and proteins. They impart an identity to the cell and its organelles and represent an ideal milieu for the proper function of a diverse set of membrane proteins. Current understanding of the organization of biological membranes involves the concept of lateral heterogeneities in the membrane, collectively termed membrane domains. Many of these domains (sometimes termed as lipid rafts) are thought to be important for the maintenance of membrane structure and function, although characterizing the spatiotemporal resolution of these domains has proven to be challenging (1–4). These specialized regions are believed to be enriched in specific lipids and proteins, and facilitate processes such as trafficking, sorting, and signal transduction over a range of spatiotemporal scale (2,4,5). Since ∼50% of all genetically encoded proteins in the eukaryotic genome are membrane-associated, it is likely that about one-half of all cellular reactions take place on membranes (6). The plasma membrane therefore not only acts as a selective barrier for the cell, but more importantly, serves as a platform for the initiation and regulation of signaling pathways. It is therefore important to understand the dynamic organization of membrane-bound molecules in order to arrive at a comprehensive view of cellular signaling (4,7).
An interesting source of heterogeneity in cell membranes is the confinement of diffusion of membrane components. Cellular signaling mediated by proteins could be viewed as a consequence of differential mobility of the various interacting partners (8). The confinement to molecular diffusion is offered by the intricate network of the cortical actin cytoskeleton that lies immediately below the plasma membrane (9). The boundaries of confinement are defined by transmembrane proteins anchored to the cytoskeleton, thereby acting as pickets. This model of the plasma membrane is called the membrane picket-fence model (10). The relation between membrane heterogeneity and differential mobility of membrane components, and their role in regulating cellular signaling represent a challenging problem in contemporary membrane biology. In this context, the study of molecular mobility in membranes can be utilized to probe the heterogeneity in membrane organization. A comprehensive understanding of cellular signaling would therefore require the mapping of membrane heterogeneity at both spatial and temporal scales. Temporally sensitive microscopy-based techniques are generally suitable for such measurements.
Fluorescence correlation spectroscopy (FCS) is a powerful and sensitive technique for measuring molecular diffusion in cellular systems (11,12), in which the minute spontaneous fluctuations of fluorescence intensity in an open volume (defined by a focused laser beam and confocal optics) are measured. These fluctuations arise due to diffusion of fluorophores into and out of the open sampling volume. The resultant autocorrelation function provides information on molecular diffusion and number of particles in the sampling volume. FCS offers a convenient approach to monitor dynamics of membrane-bound molecules (13,14). However, the commonly employed single-point FCS of membrane proteins or lipids could lead to inaccurate estimation of diffusion parameters. This is due to the fact that the relative thickness of the membrane bilayer (∼5 nm) is approximately three-orders-of-magnitude smaller than that of the diffraction-limited spot size along the optic axis (∼1 μm), i.e., the typical axial length of the FCS observation volume (15). In single-point FCS measurements on membranes, the observation volume is positioned based on the position of maximum fluorescence, where maximum fluorescence is assumed to originate from the membrane harboring the fluorescently tagged molecule of interest. However, the plasma membrane position, when judged this way, has often proved to be inaccurate and can lead to erroneous estimation of diffusion parameters (16).
To avoid the problems associated with single-point FCS measurements on cell membranes, we chose to combine two recently developed approaches to monitor dynamics of membrane-bound molecules. In one of these approaches (termed as z-scanning FCS or zFCS), the uncertainty in the positioning of the focused beam can be overcome by a z-scan in which the diffusion times (τD) are determined in steps as the z axis is scanned in small increments (16,17). A plot of diffusion time versus transverse area of the confocal volume generates the FCS diffusion laws that provide information on the submicron level organization (such as confinement and/or partitioning) of the diffusing species (18,19). In this work, we have made use of this combined approach to address the membrane dynamics of a fluorescent (4,4-difluoro-4-bora-3a,4a-diaza-s-indacene (BODIPY)-labeled) analog of phosphatidylcholine (2-(4,4-difluoro-5,7-dimethyl-4-bora-3a,4a-diaza-s-indacene-3-pentanoyl)-1-hexadecanoyl-sn-glycero-3-phosphocholine (BODIPY-FL PC)), and the serotonin1A receptor tagged to enhanced yellow fluorescent protein (EYFP) in Chinese hamster ovary (CHO) cells. BODIPY is a popular fluorescent probe and is characterized by high extinction coefficient, quantum yield, and photostability (20). The G-protein coupled receptor (GPCR) superfamily is the largest and most diverse protein family in mammals that is involved in signal transduction across membranes (21). GPCRs represent 30–50% of current drug targets and have emerged as major targets for the development of novel drug candidates in all clinical areas (22). The serotonin1A (5-HT1A) receptor is the most extensively studied of the serotonin receptors for a number of reasons. The serotonin receptor family represents one of the largest, evolutionarily ancient, and highly conserved families of seven transmembrane GPCRs (23). Cellular signaling by the receptor plays a key role in the generation and modulation of various cognitive, behavioral, and developmental functions (24).
In this article, we have monitored membrane diffusion of these molecules utilizing zFCS and analyzed the results according to the FCS diffusion laws. We discuss the significance of the observed diffusion coefficients and comment on the spatiotemporal evolution of their dynamics, as monitored by zFCS. In addition, we report novel results of the effect of actin cytoskeleton destabilization and membrane cholesterol depletion on diffusion characteristics of the serotonin1A receptor. Our results indicate that depletion of plasma membrane cholesterol could lead to destabilization of the cortical actin cytoskeleton, as apparent from the confinement of serotonin1A receptor dynamics in the plasma membrane under these conditions. To the best of our knowledge, these results constitute the first report on GPCR dynamics utilizing a combination of zFCS and the FCS diffusion laws.
Materials and Methods
See the Supporting Material.
Results
zFCS: theoretical framework and application
The autocorrelation curve in a FCS measurement is generated due to fluctuations in fluorescence intensity as fluorescent molecules traverse the illuminated confocal volume. Mathematically, the fluctuations can be quantified by temporal autocorrelation of fluorescence intensity. The normalized autocorrelation function G(τ) can be presented as (12)
where
is the average fluorescence intensity, F(t) is the fluorescence intensity at any given time t, and δF(t) = F(t) − 〈F(t)〉. Ideally, G(τ) for free (unconfined) diffusion in three dimensions for a single population of monodisperse fluorophores can be defined as (25,26)
| (1) |
where N = 〈Veff〉C is equal to the average number of particles in the focal volume 〈Veff〉, which is defined by the illumination profile of the diffraction-limited spot and C is the bulk concentration of the fluorescent species. Equation 1 assumes that the illuminated volume is a three-dimensional Gaussian intensity profile (26):
The decay of intensity by 1/e2 in the radial plane is given by r0, and in the axial direction, by z0. The characteristic diffusion time (τD) is the average time a molecule spends in the focal volume and is related to the diffusion coefficient D as (11)
| (2) |
For a system with multiple, noninteracting components, the correlation function can be expressed as a sum of the contribution of the each component weighted by their emission characteristics,
| (3) |
where fi is the fractional contribution of the ith species to total emission, and G(τ)i is the correlation function corresponding to the ith species.
For diffusion in two dimensions (such as in membranes, i.e., z0 → ∞, (r0/z0) → 0), Eq. 1 is simplified to
| (4) |
Many fluorophores exhibit a transition to the first excited triplet state upon excitation. This is termed blinking of the fluorophore and is often observed as an additional shoulder in the decay curve. Since this photophysical phenomenon could occur while the fluorescent molecule is in the focused volume, it introduces an additional feature in FCS data analysis. This is usually accounted for by introducing a factor (an additional exponential decay) characterizing the triplet state kinetics in the theoretical fit of correlation data. The triplet state factor is described as
| (5) |
where T is the fraction of the population of fluorophores that undergoes triplet state transition and τtriplet is the characteristic triplet time, the average time spent by the excited molecules in the triplet state. The autocorrelation decay could be fitted well with a single decay component in the case of BODIPY-FL PC, with triplet state kinetics as
| (6) |
For diffusion measurements of the serotonin1A receptor tagged to EYFP (termed 5-HT1AR-EYFP) in CHO-K1 cells, data was best fitted by considering two components for the receptor population. It has been previously reported that a fast decay component is observed for chimeric (GFP-tagged) membrane proteins in cells. The faster component has been attributed to the diffusion of the tagged protein in the intracellular pool (19). We therefore analyzed the diffusion of 5-HT1AR-EYFP using Eq. 4 without taking into consideration the faster decay component (∼200–400 μs).
For a Gaussian illumination profile and a planar distribution of fluorophores parallel with the focal plane of the microscope, the characteristic diffusion time and the average number of particles have a parabolic dependence on the position of the focus (16,17) and can be described as
| (7) |
and
| (8) |
where r0 is the radius of the beam in the focal plane, D is the lateral diffusion coefficient, C is the average concentration of the fluorescent species in the illuminated area, n is the refractive index of the medium, λ0 is the wavelength of the excitation light, and Δz is the distance between the sample position (z) and the position of focus (z′) where the beam diameter is minimum, i.e., corresponding to r0. The vertex of the parabola is representative of the characteristic diffusion time of the fluorescent molecule on the membrane (see Fig. 1 A). Because the cellular milieu is heterogeneous and exhibits inherent variation, we pooled data from all measurements for a given condition and fitted the data to a parabolic equation as
| (9) |
where
and τ0 represents the intercept. The stage position (z) corresponds to an arbitrary stage position of measurement and (z′) is the stage position corresponding to the minimal diffusion time. The minimal diffusion time corresponds to the position of the stage when the plasma membrane is in focus. Equation 9 can also be written as
or
| (10) |
In this case, A can be utilized to determine the diffusion coefficient corresponding to r0 (i.e., Δz = 0). This diffusion coefficient, operationally defined as Dshort, corresponds to diffusion in the area probed by the waist of the confocal spot when the membrane lies parallel on the focal plane. Dshort therefore refers to the diffusion coefficient that would be derived from a single-point FCS measurement, provided the membrane is in focus (see Eq. 2). On the other hand, Dlong (derived from the parameter AB), corresponds to an average diffusion coefficient over the range of length scales probed by the zFCS experiment. The long-range diffusion behavior can therefore be estimated upon comparing the slope associated with the linear fit to the plot of τD versus Δz2. While, in a homogeneous environment, Dshort is likely to be similar to Dlong, this is not necessarily true in a microheterogeneous media such as the cellular plasma membrane. Taken together, Dshort and Dlong can provide estimates of the evolution of diffusion behavior of the molecule over progressively increasing length scales. In the context of the measurements reported by us, while Dshort could be reliably estimated, attempts to deduce Dlong gave unreasonably large diffusion coefficients for diffusion of molecules in the plasma membrane. Importantly, this type of discrepancy has been reported earlier (16), and could possibly be attributed to the semiquantitative nature of Eqs. 9 and 10 (27). To provide an overall estimate of long-range diffusion behavior, the normalized diffusion coefficients (Dm) shown in Table 1 were derived from the slope associated with the fit of the data for each condition, relative to the slope obtained in the case of BODIPY-FL PC.
Figure 1.
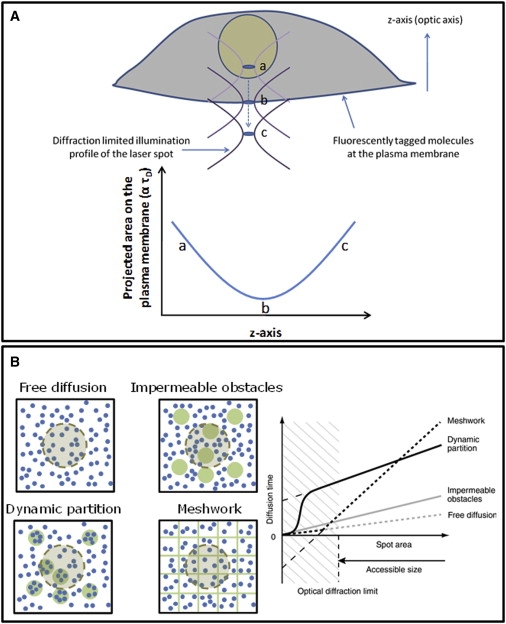
Area of observation (the diffraction-limited spot). (A) A schematic representation of zFCS. The z axis shown here is the optic axis (perpendicular to the image plane). The diffraction-limited illumination profile of the laser spot is gradually moved along the z axis. Incremental steps in focusing along the z axis results in a parabolic scaling of the projected area illuminated by the diffraction-limited spot. This allows our probing the membrane at increasing length scales, when fluorescence originates predominantly from the plasma membrane. Because the time taken to diffuse through a circular area should scale with the square of the radius, the characteristic diffusion time (τD) for zFCS measurements is related to the projected area illuminated by the diffraction-limited spot on the plane of the plasma membrane (marked by arbitrary z positions). Typical positions of the diffraction-limited spot are highlighted (a, b, and c) at different z positions. (B) Simulated FCS diffusion laws for various membrane models (adapted with permission from (19)). The models for which simulations were performed are: free diffusion; impermeable obstacles (green circles); dynamic partition into domains (green circles); or diffusion confined by the actin cytoskeletal meshwork (regular lattice). (Side panel) Dependence of the diffusion time on the area of observation. The extrapolated intercept to the limit of zero spot size provides a measure of the nature of diffusion experienced by the fluorophore.
Table 1.
Estimated intercept and diffusion coefficients: comparison of lipid and protein diffusion
| InterceptτD (ms)∗ | Diffusion coefficient (μm2 s−1) |
||
|---|---|---|---|
| Dshort† | Dm (m ± SE)‡ | ||
| BODIPY-FL PC | 0 | 6.5 (± 0.4) | 1.00 (0.68 ± 0.17) |
| 5-HT1AR-EYFP | −21.0 ± 1.0 | 4.0 (± 0.5) | 0.07 (9.63 ± 0.32) |
In the case of BODIPY-FL PC, the intercept value on the ordinate was assigned to zero while fitting. The origin of the plot estimated this way was utilized to determine the intercept for 5-HT1AR-EYFP.
Dshort was derived from measured diffusion times corresponding to the focus positioned on the plasma membrane (i.e., Δz = 0). Values for Dshort are shown as means ± relative errors.
Dm was determined by normalizing the derived slope (m) with respect to the slope obtained in the case of BODIPY-FL PC, from the plot of τD versus Δz2. This allows a comparison of the average diffusion coefficient over the range of length scales probed by zFCS measurement. Values for the slope (m) are provided as means ± SE, as derived from the fit. See text and Supporting Material for further details.
As mentioned earlier, we monitored membrane dynamics (diffusion) of BODIPY-FL PC and 5-HT1AR-EYFP in CHO-K1 cells. We have previously pharmacologically characterized 5-HT1AR-EYFP in these cells and have shown that the EYFP-tagged receptors are essentially similar to the native receptor (28). Diffusion parameters obtained by the zFCS approach were further analyzed utilizing the FCS diffusion laws. Fig. 1 B shows the interpretation of FCS diffusion laws under various conditions (18,19). The linear fit of data in FCS diffusion laws, when extrapolated to zero spot-width, provides insight into the nature of confinement experienced by the diffusing species. In the case of free diffusion, the intercept is close to zero. In contrast, in cases where the diffusing molecule experiences confinement (as observed in the case of membrane-bound molecules by the cytoskeletal network (9)), a negative intercept is obtained. On the other hand, partitioning into preexisting domains results in a positive intercept. It should be mentioned here that the intercept value (τ0) is merely a derived parameter to estimate molecular confinement, and as such has no direct physical relevance (e.g., a negative value of τ0 has no physical meaning; see (18) for further discussion). We generated FCS diffusion laws by plotting diffusion time τD as a function of Δz2.
Calibrating zFCS for the application of FCS diffusion laws: zFCS of BODIPY-FL PC
The FCS diffusion laws were derived by inserting a diaphragm into the back aperture of the objective and manually tuning the spot-width of the diffraction spot (18,19). This approach has been further substantiated using nanometric apertures (29). The exact knowledge of the width of the spot size in these measurements allows one to extrapolate to a condition of zero spot-width, from which the intercept value of diffusion time is derived. The knowledge of the diaphragm aperture dimensions and the ability to alter it allows one to accurately define the spot area (18). Such manipulations cannot be easily performed in a commercially available FCS setup since insertion of an adjustable diaphragm is not feasible. We therefore chose to utilize the z-scan approach proposed by Humpolícková et al. (17) for our measurements.
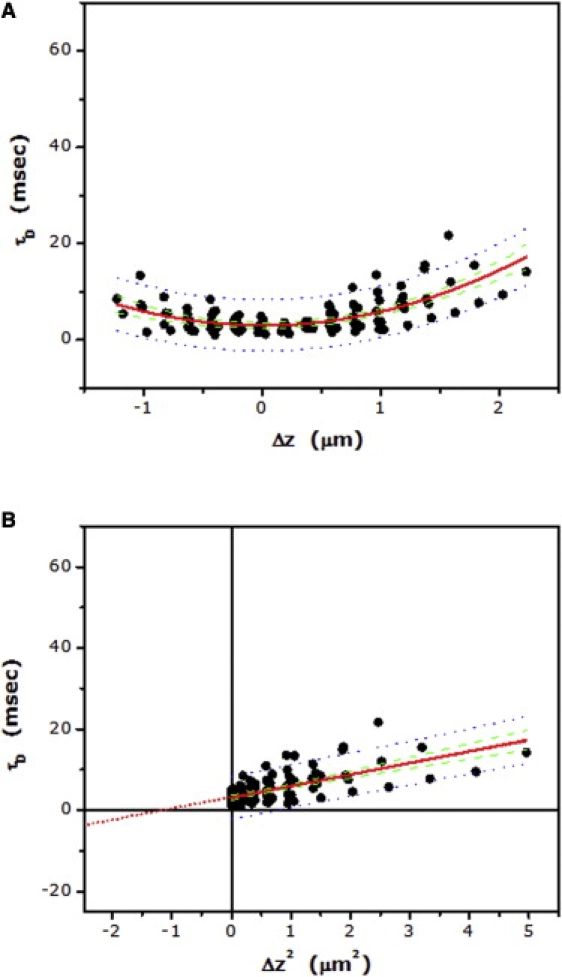
We utilized the diffusion properties of BODIPY-FL PC in CHO-K1 cells to determine the zero spot-width corresponding to our setup. BODIPY-FL PC has been reported to undergo free, Brownian diffusion in the plasma membrane (19). The linear fit of τD versus Δz2, when extrapolated, should therefore pass through the origin in the case of BODIPY-FL PC (see Fig. 1 B). Fig. 2 A shows diffusion time (τD) versus Δz for BODIPY-FL PC. The weak dependence of diffusion time with Δz (Fig. 2 A) suggests a primarily free diffusion in accordance with earlier reports (19). The estimated diffusion coefficient (Dshort), corresponding to the focus positioned on the plasma membrane (i.e., Δz = 0), was found to be 6.5 μm2 s−1 (see Table 1), in agreement with previous literature value (17). The corresponding plot of diffusion time versus Δz2 (FCS diffusion laws) is shown in Fig. 2 B. Fig. 2 B shows the fit of the pooled data to a linear equation from which the origin (corresponding to zero spot-width) was derived (compare Figs. 1 B and 2 B). The estimated value of Δz2 (∼−2.5, corresponding to zero spot-width; see Fig. 2 B) from this plot was utilized to determine the intercept value for diffusion of 5-HT1AR-EYFP (see below).
Figure 2.
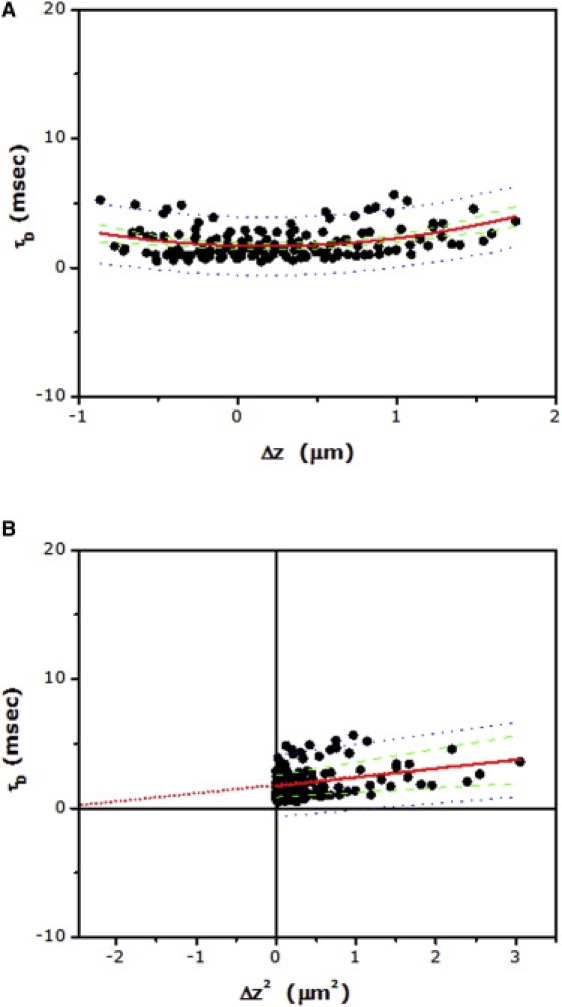
(A) Dependence of lateral diffusion time on the z position of the focus in the case of BODIPY-FL PC in CHO-K1 plasma membranes. Experimental data points (>140) from multiple cells (N > 20) were pooled together and fitted to Eq. 9 (fitted line shown as red solid line). (B) The corresponding plot of lateral diffusion time versus Δz2 (FCS diffusion laws) for data shown in panel A. Data points were fitted to a straight line (shown as red solid line) and extrapolated to determine the origin (i.e., zero spot area) position along the Δz2 axis (see text and Table 1). Also shown: 95% confidence interval (green dashed line) and 95% prediction band (blue dotted line) for the fitted data.
zFCS of 5-HT1AR-EYFP
The results of the zFCS measurements for the G-protein coupled 5-HT1AR-EYFP are shown in Fig. 3. The optical parameters were similar to those used for zFCS measurements of BODIPY-FL PC. This is important because it allows for monitoring the receptor and the lipid analog under the same optical settings. Diffusion time versus Δz for 5-HT1AR-EYFP is shown in Fig. 3 A. The strong dependence of diffusion time with Δz suggests relatively constrained diffusion in the case of 5-HT1AR-EYFP. The estimated diffusion coefficient (Dshort) for the receptor, corresponding to the focus positioned on the plasma membrane, was found to be 4.0 μm2 s−1 (see Tables 1 and 2). The corresponding plot of diffusion time versus Δz2 (FCS diffusion laws) is shown in Fig. 3 B. The figure shows the fit of the pooled data to a linear equation, utilizing the origin derived for BODIPY-FL PC. The constraint in 5-HT1AR-EYFP diffusion is apparent from the intercept value of ∼−21 ms (see Fig. 1 B and Table 1). Interestingly, the intercept value of ∼−21 ms is similar to the intercept value reported for membrane-bound proteins confined by the actin cytoskeleton (19; see later). The possible confinement of the receptor mobility by the actin cytoskeleton is consistent with our earlier observation using fluorescence recovery after photobleaching (FRAP), where we showed that the extent of mobility of 5-HT1AR-EYFP (in terms of its mobile fraction) is modulated by the actin cytoskeleton (30,31). Interestingly, the diffusion coefficient (Dshort) of 5-HT1AR-EYFP derived in this work from zFCS measurements (∼4.0 μm2 s−1) appears to be higher by an order of magnitude than the diffusion coefficient of the receptor in the same cell type derived by FRAP (∼0.14 μm2 s−1) (30). We believe that this apparently high diffusion coefficient (Dshort) obtained from zFCS measurements is due to the higher spatiotemporal resolution associated with FCS (e.g., see Dm values in Tables 1 and 2). Suzuki et al. (32) has previously reported (based on single particle tracking measurements of the G-protein coupled μ-opioid receptor) that, when probed at high spatiotemporal resolution, the diffusion coefficient of GPCRs in the plasma membrane could be in the range of 4.5–6 μm2 s−1.
Figure 3.
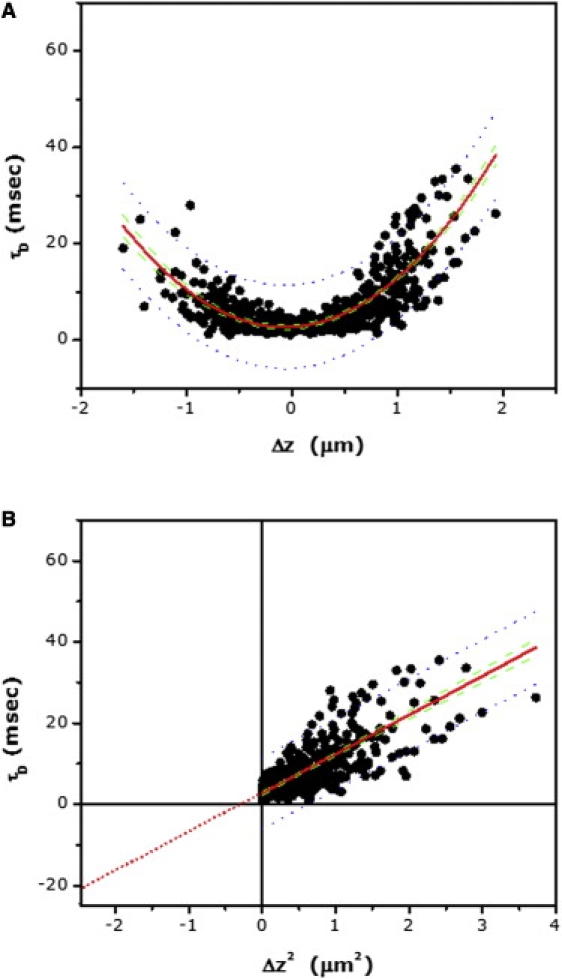
(A) Dependence of lateral diffusion time on the z position of the focus for 5-HT1AR-EYFP in cells. Experimental data points (>500) from multiple cells (N > 50) were pooled together and fitted to Eq. 9 (fitted line shown as red solid line). (B) The corresponding plot of lateral diffusion time versus Δz2 for data shown in panel A. Data points were fitted to a straight line (shown as red solid line) and extrapolated to determine the intercept (see text and Table 1). Also shown: 95% confidence interval (green dashed line) and 95% prediction band (blue dotted line) for the fitted data.
Table 2.
Estimated intercepts and diffusion coefficients: comparison of 5-HT1AR-EYFP diffusion
| Condition | InterceptτD (ms)∗ | Diffusion coefficient (μm2 s−1) |
|
|---|---|---|---|
| Dshort† | Dm (m ± SE)‡ | ||
| Control | −21.0 ± 1.0 | 4.0 (± 0.5) | 0.07 (9.63 ± 0.32) |
| 2 μM CD | −18.0 ± 2.6 | 2.5 (± 0.8) | 0.08 (9.07 ± 0.92) |
| 5 μM CD | −5.9 ± 1.0 | 3.7 (± 0.4) | 0.18 (3.60 ± 0.31) |
| 10 μM CD | −1.2 ± 1.0 | 2.4 (± 0.3) | 0.29 (2.33 ± 0.28) |
| 5 mM MβCD | −4.0 ± 0.9 | 3.6 (± 0.4) | 0.24 (2.86 ± 0.27) |
| 10 μM 5-HT | −21.1 ± 1.8 | 3.8 (± 0.8) | 0.07 (9.72 ± 0.61) |
In the case of BODIPY-FL PC, the intercept value on the ordinate was assigned to zero while fitting. The origin of the plot estimated this way was utilized to determine the intercept for 5-HT1AR-EYFP.
Dshort was derived from measured diffusion times corresponding to the focus positioned on the plasma membrane (i.e., Δz = 0). Values for Dshort are shown as means ± relative errors.
Dm was determined by normalizing the derived slope (m) with respect to the slope obtained in the case of BODIPY-FL PC, from the plot of τD versus Δz2. This allows a comparison of the average diffusion coefficient over the range of length scales probed by zFCS measurement. Values for the slope (m) are provided as means ± SE, as derived from the fit. See text and Supporting Material for further details.
5-HT1AR-EYFP dynamics upon activation by serotonin
A major paradigm in GPCR signaling is that stimulation by ligands leads to the recruitment and activation of heterotrimeric GTP-binding proteins (G-proteins) (33,34). Ligand-mediated stimulation of the serotonin1A receptor results in the activation of Gαi/o class of G-proteins, followed by subsequent intracellular signaling (23). To explore changes in receptor organization and dynamics mediated by ligand stimulation, we measured the lateral dynamics of 5-HT1AR-EYFP in presence of serotonin, its natural ligand. Upon activation of the receptor by serotonin, the intercept of the plot of diffusion time versus Δz2 was found to be ∼−21 ms, similar to the intercept obtained for control cells (Fig. 4 and Table 2). In addition, the diffusion coefficient of the receptor (both Dshort and Dm) remained unaltered under this condition (Table 2).
Figure 4.
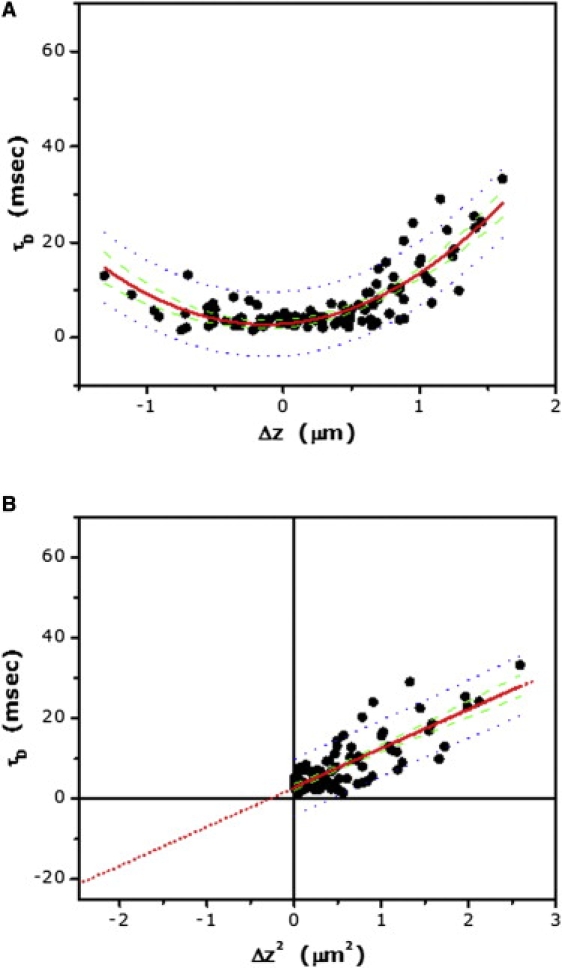
(A) Dependence of lateral diffusion time on the z position of the focus for 5-HT1AR-EYFP in cells treated with 10 μM serotonin. Experimental data points (∼70) from multiple cells (N > 10) were pooled together, and fitted to Eq. 9 (fitted line shown as red solid line). (B) The corresponding plot of lateral diffusion time versus Δz2 for data shown in panel A. Data points were fitted to a straight line (shown as red solid line) and extrapolated to determine the intercept (see text and Table 2). Also shown: 95% confidence interval (green dashed line) and 95% prediction band (blue dotted line) for the fitted data.
Actin cytoskeleton destabilization results in release of 5-HT1AR-EYFP confinement
As mentioned above, the confinement experienced by 5-HT1AR-EYFP could arise from interaction of the transmembrane receptor with the actin cytoskeleton network (see Fig. 1 B). To explore this possibility, we monitored receptor dynamics by zFCS upon destabilizing the actin cytoskeleton utilizing cytochalasin D (CD). Cytochalasins are potent inhibitors of actin polymerization in cells, and are known to depolymerize actin filaments by predominantly binding to the barbed (fast growing) end, thereby shifting the equilibrium toward depolymerization in vitro (35). Interestingly, we observe a dose-dependent increase in the intercept of the plot of diffusion time versus Δz2 for 5-HT1AR-EYFP upon treatment of cells with increasing concentrations of CD (see Fig. 5 and Table 2). The intercept increases to ∼−18 ms (from ∼−21 ms for control cells) when the treatment was carried out with 2 μM CD. Further destabilization of the actin cytoskeleton using 5 μM CD yielded an increased intercept of ∼−6 ms, indicating release of receptor confinement. This is reinforced by an intercept close to zero (∼−1 ms) when 10 μM CD was used. The progressive release of receptor confinement upon increasing actin destabilization is reminiscent of our previous results using FRAP where the mobile fraction of the receptor exhibited a similar increase upon actin cytoskeleton destabilization (30). We must mention here that direct comparison of FRAP and FCS measurements is difficult since FRAP reports both on average long-range diffusion and the fraction of mobile molecules, while FCS reports only the diffusion coefficient over relatively short length scales (and also long length scales in the case of zFCS). Therefore, it is not possible to get an estimate of the fractional mobility of molecules from FCS measurements. We have compared FRAP and FCS results only in the context of the insight that is provided by these measurements on membrane diffusion of the serotonin1A receptor. Results from both measurements appear to suggest a gradual release in confinement of the receptor as the actin cytoskeleton is progressively destabilized. Significantly, while these changes in receptor confinement are not accompanied by any appreciable change in Dshort, the long-range diffusion coefficient Dm increased progressively, implying that the long-range diffusion of the receptor is gradually altered upon actin cytoskeleton destabilization.
Figure 5.
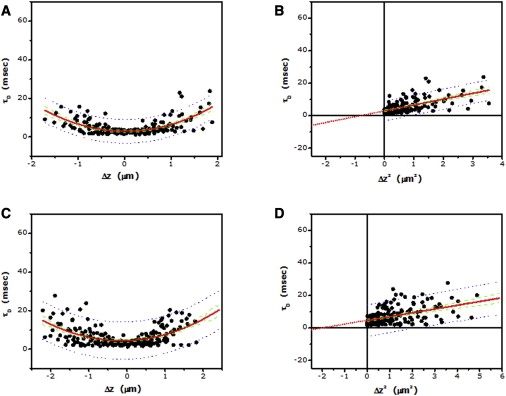
Dependence of lateral diffusion time on the z position of the focus for 5-HT1AR-EYFP in cells treated with 5 (A) and 10 (C) μM cytochalasin D (CD). Experimental data points (∼200; for each concentration of CD) from multiple cells (N > 20) were pooled together, and fitted to Eq. 9 (fitted line shown as red solid line). (B and D) Corresponding plots of lateral diffusion time versus Δz2 for data shown in panels A and C. Data points were fitted to a straight line (shown as red solid line) and extrapolated to determine the intercept (see text and Table 2). Also shown: 95% confidence interval (green dashed line) and 95% prediction band (blue dotted line) for the fitted data.
Altered dynamics of 5-HT1AR-EYFP upon membrane cholesterol depletion
The confinement experienced by 5-HT1AR-EYFP could also arise from dynamic partitioning of the receptor into cholesterol-enriched membrane domains (see Fig. 1 B). Cholesterol-rich membrane domains have been proposed to exist in eukaryotic plasma membranes, and have been implicated in cellular signaling and trafficking (2,4). According to the FCS diffusion laws, molecules exclusively exhibiting partitioning into membrane domains would display a positive intercept. The intercept is expected to decrease upon dissolution of such domains (19). Cyclodextrins such as methyl-β-cyclodextrin (MβCD) are widely used for acute depletion of membrane cholesterol in cells (36). We have previously shown that membrane cholesterol is necessary for the function of the serotonin1A receptor (37,38). We also showed that membrane cholesterol depletion by MβCD induces dynamic confinement of the receptor in the plasma membrane, as monitored by FRAP measurements using various bleach spot sizes (39). We therefore investigated the possibility of partitioning of the receptor into specialized domains in the plasma membrane utilizing zFCS. To monitor the effect of cholesterol depletion on the dynamics of 5-HT1AR-EYFP, we utilized MβCD to deplete membrane cholesterol. Surprisingly, cells treated with 5 mM MβCD exhibit an increase in the intercept of the plot of diffusion time versus Δz2 of the receptor (see Table 2 and Fig. 6). The intercept increases to ∼−4 ms upon cholesterol depletion from ∼−21 ms for control cells. We should have observed a decrease in the intercept upon cholesterol depletion, if 5-HT1AR-EYFP partitioned into cholesterol-rich domains in the plasma membrane (19). In contrast, our results show an increase in the intercept upon cholesterol depletion, similar to the increase in intercept observed for actin cytoskeleton destabilization. This possibly indicates that membrane cholesterol depletion could reduce receptor confinement, due to possible alteration of the actin cytoskeleton network (see later). In addition, while Dshort of the receptor did not exhibit any appreciable change upon cholesterol depletion, Dm displayed an increase similar to that observed upon actin cytoskeleton destabilization. These results imply that partitioning of 5-HT1AR-EYFP in cholesterol-rich membrane domains is probably ruled out, as monitored by zFCS.
Figure 6.
(A) Dependence of lateral diffusion time on the z position of the focus for 5-HT1AR-EYFP in cells treated with MβCD. The concentration of MβCD used was 5 mM. Experimental data points (∼120) from multiple cells (N > 15) were pooled together, and fitted to Eq. 9 (fitted line shown as red solid line). (B) The corresponding plot of lateral diffusion time versus Δz2 for data shown in panel A. Data points were fitted to a straight line (shown as red solid line) and extrapolated to determine the intercept (see text and Table 2). Also shown: 95% confidence interval (green dashed line) and 95% prediction band (blue dotted line) for the fitted data.
Discussion
An interesting aspect of our results is the apparent similarity of the diffusion coefficients of BODIPY-FL PC (a phospholipid) and 5-HT1AR-EYFP (a representative member of the GPCR superfamily), when probed over a relatively small spatial scale of ∼210 nm (Table 1). Figs. 2 A and 3 A show that differential evolution of dynamics for the lipid and protein emerges upon monitoring progressively increasing length scales centered around the same initial point. This is further supported upon comparison of the normalized diffusion coefficients (Dm) of the lipid and the protein. As shown in Table 1, while Dshort of the lipid and the receptor are similar, the corresponding Dm diverges, implying a slowing-down of the receptor by approximately an order-of-magnitude relative to the lipid over larger length scales. This apparent difference in the estimated values of the diffusion coefficients suggests the existence of at least two diffusion regimes of the receptor within the spatiotemporal window of our measurement. A possible explanation for the divergence in the lateral dynamics of these two molecules could be due to the relatively large number of interactions experienced by the receptor (due to its bumpy topology and size). It has been previously shown that the nature of dynamics of membrane-bound molecules is sensitive to the timescale of measurement (32,40). For mobile membrane-bound molecules, it has been suggested that while diffusion would be normal (Brownian) for low area fraction of obstacles, an increase in the area fraction of the obstacles would result in normal diffusion only for longer timescales with diminishing diffusion coefficient (32,41). In the case of cellular plasma membranes, the actin cytoskeleton (and associated proteins) could represent a relatively higher area fraction of obstacles for the transmembrane receptor than for the lipid molecule due to the difference in their shape and size. In agreement with this, a careful analysis of the distribution of experimentally measured lateral diffusion coefficients of membrane-bound molecules reveals that diffusion coefficients obtained for lipids and proteins are similar in model membranes, i.e., in the absence of confinement and/or crowding. In contrast, diffusion coefficients of lipids and proteins in cellular membranes differ up to approximately three orders of magnitude due to near-neighbor involvement (actin cytoskeleton and/or interacting lipids and proteins) (42,43). When viewed from this perspective, our present results of diffusion coefficients (Dshort) from zFCS measurements could correspond to restriction-free (i.e., model membrane-like) diffusion due to the relatively small length scale associated with our measurements. This could account for similar values of Dshort for BODIPY-FL PC and 5-HT1AR-EYFP.
Our results show that the serotonin1A receptor exhibits characteristics of confinement in membrane mobility, as evidenced by the negative intercept of the plot of τD versus Δz2 for control cells (Fig. 3, Tables 1 and 2). We did not observe any change in the intercept or the diffusion coefficient of the receptor upon activation with serotonin. Interestingly, the receptor confinement was progressively reduced upon treatment with increasing concentrations of CD, thereby implying a role of the actin cytoskeleton meshwork in the confinement of the receptor. A somewhat surprising aspect of our results is the reduction in confinement of receptor mobility observed upon depletion of membrane cholesterol. The extent of reduction of the intercept upon cholesterol depletion is comparable to the extent of reduction observed upon cytoskeletal destabilization. It is therefore likely that depletion of plasma membrane cholesterol could lead to the destabilization of the cortical actin cytoskeleton, as reported previously (44,45). For example, it has been reported that depletion of plasma membrane cholesterol could induce changes in the underlying actin cytoskeleton by sequestering phosphatidylinositol 4,5-bisphosphate [PI(4,5)P2] molecules in the membrane (44). Our present results provide novel information on the possible relation between membrane cholesterol and the cytoskeleton from the perspective of GPCR organization and dynamics. The relative invariance of Dshort and the changes associated with Dm suggest that reorganization of the actin cytoskeleton has a pronounced effect on the long-range diffusion of the receptor. This implies a lower limit of the spatial range in which diffusion of the receptor is affected by the actin cytoskeleton. It should be noted here that although cholesterol depletion utilizing MβCD is a popular tool to alter membrane cholesterol levels (36), MβCD has been shown to exert pleiotropic effects in some cases (46–48). We therefore cannot rule out the possibility that the change in receptor confinement upon MβCD treatment could be due to such effects of MβCD, in addition to reduction of membrane cholesterol.
The role of membrane cholesterol in the regulation of molecular mobility on the plasma membrane is an active area of research in membrane biology. Dynamics of membrane-bound molecules could represent an important determinant in cellular signaling in pathogenic conditions where membrane cholesterol is limited due to defective biosynthesis (e.g., in the Smith-Lemli-Opitz syndrome) (49). While the role of membrane cholesterol in the regulation of molecular mobility on the plasma membrane remains an active area of research, a consensus on the dependence of the mobility of membrane-bound molecules on cholesterol levels of the plasma membrane is still lacking. Although cholesterol depletion has been shown to suppress mobility in cellular membranes in some cases (50–52), it was found to be dependent on the length scales probed (39). On the other hand, it has been observed that cholesterol depletion could lead to an increase in molecular mobility (52–54). In this overall context, our results of 5-HT1AR-EYFP diffusion, obtained upon cholesterol depletion, assume significance. While the diffusion coefficient (Dshort) of the receptor did not exhibit any appreciable change upon cholesterol depletion at length scales corresponding to ∼210 nm, the long-range dynamics of the receptor (Dm) displayed considerable change (Table 2). Taken together, our results suggest that observations on membrane cholesterol depletion as a means to destabilize specialized membrane domains (i.e., lipid rafts) must be carefully interpreted, keeping in mind the changes associated with the actin cytoskeleton.
In summary, we show here that a judicious application of zFCS to determine dynamics of membrane-bound molecules, when combined with analysis using the FCS diffusion laws, can be used as a powerful tool to probe membrane heterogeneity at the submicron level. This assumes relevance in view of the fact that although it is generally agreed that biological membranes are patchy, characterizing the spatiotemporal resolution of these domains is turning out to be challenging (1–4). In view of the role of lateral mobility of membrane receptors on receptor-mediated signaling (30,55), our results highlight the significance of both the actin cytoskeleton network and membrane cholesterol level in the modulation of receptor dynamics and function.
Acknowledgments
We thank Nandini Rangaraj for useful discussions, and members of our laboratory for critically reading the manuscript.
This work was supported by the Council of Scientific and Industrial Research, Government of India. S.G. thanks the Council of Scientific and Industrial Research for the award of a Senior Research Fellowship. A.C. gratefully acknowledges the J.C. Bose Fellowship (Department of Science and Technology, Government of India).
Supporting Material
References
- 1.Edidin M. Shrinking patches and slippery rafts: scales of domains in the plasma membrane. Trends Cell Biol. 2001;11:492–496. doi: 10.1016/s0962-8924(01)02139-0. [DOI] [PubMed] [Google Scholar]
- 2.Mukherjee S., Maxfield F.R. Membrane domains. Annu. Rev. Cell Dev. Biol. 2004;20:839–866. doi: 10.1146/annurev.cellbio.20.010403.095451. [DOI] [PubMed] [Google Scholar]
- 3.Munro S. Lipid rafts: elusive or illusive? Cell. 2003;115:377–388. doi: 10.1016/s0092-8674(03)00882-1. [DOI] [PubMed] [Google Scholar]
- 4.Jacobson K., Mouritsen O.G., Anderson R.G.W. Lipid rafts: at a crossroad between cell biology and physics. Nat. Cell Biol. 2007;9:7–14. doi: 10.1038/ncb0107-7. [DOI] [PubMed] [Google Scholar]
- 5.Marguet D., Lenne P.-F., He H.T. Dynamics in the plasma membrane: how to combine fluidity and order. EMBO J. 2006;25:3446–3457. doi: 10.1038/sj.emboj.7601204. [DOI] [PMC free article] [PubMed] [Google Scholar]
- 6.Zimmerberg J. Membrane biophysics. Curr. Biol. 2006;16:R272–R276. doi: 10.1016/j.cub.2006.03.050. [DOI] [PubMed] [Google Scholar]
- 7.Simons K., Toomre D. Lipid rafts and signal transduction. Nat. Rev. Mol. Cell Biol. 2000;1:31–39. doi: 10.1038/35036052. [DOI] [PubMed] [Google Scholar]
- 8.Peters R. Lateral mobility of proteins and lipids in the red cell membrane and the activation of adenylate cyclase by β-adrenergic receptors. FEBS Lett. 1988;234:1–7. doi: 10.1016/0014-5793(88)81290-0. [DOI] [PubMed] [Google Scholar]
- 9.Kusumi A., Murakoshi H., Fujiwara T. Single-molecule imaging of diffusion, recruitment, and activation of signaling molecules in living cells. In: Damjanovich S., editor. Biophysical Aspects of Transmembrane Signaling, Springer Series in Biophysics. Springer-Verlag; Berlin, Germany: 2005. [Google Scholar]
- 10.Fujiwara T., Ritchie K., Kusumi A. Phospholipids undergo hop diffusion in compartmentalized cell membrane. J. Cell Biol. 2002;157:1071–1081. doi: 10.1083/jcb.200202050. [DOI] [PMC free article] [PubMed] [Google Scholar]
- 11.Müller J.D., Chen Y., Gratton E. Fluorescence correlation spectroscopy. Methods Enzymol. 2003;361:69–92. doi: 10.1016/s0076-6879(03)61006-2. [DOI] [PubMed] [Google Scholar]
- 12.Haustein E., Schwille P. Fluorescence correlation spectroscopy: novel variations of an established technique. Annu. Rev. Biophys. Biomol. Struct. 2007;36:151–169. doi: 10.1146/annurev.biophys.36.040306.132612. [DOI] [PubMed] [Google Scholar]
- 13.Briddon S.J., Hill S.J. Pharmacology under the microscope: the use of fluorescence correlation spectroscopy to determine the properties of ligand-receptor complexes. Trends Pharmacol. Sci. 2007;28:637–645. doi: 10.1016/j.tips.2007.09.008. [DOI] [PMC free article] [PubMed] [Google Scholar]
- 14.García-Sáez A.J., Schwille P. Fluorescence correlation spectroscopy for the study of membrane dynamics and protein/lipid interactions. Methods. 2008;46:116–122. doi: 10.1016/j.ymeth.2008.06.011. [DOI] [PubMed] [Google Scholar]
- 15.Hess S.T., Huang S., Webb W.W. Biological and chemical applications of fluorescence correlation spectroscopy: a review. Biochemistry. 2002;41:697–705. doi: 10.1021/bi0118512. [DOI] [PubMed] [Google Scholar]
- 16.Benda A., Benes M., Hof M. How to determine diffusion coefficients in planar phospholipid systems by confocal fluorescence correlation spectroscopy. Langmuir. 2003;19:4120–4126. [Google Scholar]
- 17.Humpolícková J., Gielen E., Engelborghs Y. Probing diffusion laws within cellular membranes by Z-scan fluorescence correlation spectroscopy. Biophys. J. 2006;91:L23–L25. doi: 10.1529/biophysj.106.089474. [DOI] [PMC free article] [PubMed] [Google Scholar]
- 18.Wawrezinieck L., Rigneault H., Lenne P.F. Fluorescence correlation spectroscopy diffusion laws to probe the submicron cell membrane organization. Biophys. J. 2005;89:4029–4042. doi: 10.1529/biophysj.105.067959. [DOI] [PMC free article] [PubMed] [Google Scholar]
- 19.Lenne P.-F., Wawrezinieck L., Marguet D. Dynamic molecular confinement in the plasma membrane by microdomains and the cytoskeleton meshwork. EMBO J. 2006;25:3245–3256. doi: 10.1038/sj.emboj.7601214. [DOI] [PMC free article] [PubMed] [Google Scholar]
- 20.Johnson I.D., Kang H.C., Haugland R.P. Fluorescent membrane probes incorporating dipyrrometheneboron difluoride fluorophores. Anal. Biochem. 1991;198:228–237. doi: 10.1016/0003-2697(91)90418-s. [DOI] [PubMed] [Google Scholar]
- 21.Rosenbaum D.M., Rasmussen S.G.F., Kobilka B.K. The structure and function of G-protein-coupled receptors. Nature. 2009;459:356–363. doi: 10.1038/nature08144. [DOI] [PMC free article] [PubMed] [Google Scholar]
- 22.Heilker R., Wolff M., Bieler M. G-protein-coupled receptor-focused drug discovery using a target class platform approach. Drug Discov. Today. 2009;14:231–240. doi: 10.1016/j.drudis.2008.11.011. [DOI] [PubMed] [Google Scholar]
- 23.Pucadyil T.J., Kalipatnapu S., Chattopadhyay A. The serotonin1A receptor: a representative member of the serotonin receptor family. Cell. Mol. Neurobiol. 2005;25:553–580. doi: 10.1007/s10571-005-3969-3. [DOI] [PMC free article] [PubMed] [Google Scholar]
- 24.Müller C.P., Carey R.J., De Souza Silva M.A. Serotonin and psychostimulant addiction: focus on 5-HT1A-receptors. Prog. Neurobiol. 2007;81:133–178. doi: 10.1016/j.pneurobio.2007.01.001. [DOI] [PubMed] [Google Scholar]
- 25.Elson E.L., Magde D. Fluorescence correlation spectroscopy. I. Conceptual basis and theory. Biopolymers. 1974;13:1–27. doi: 10.1002/bip.1974.360130103. [DOI] [PubMed] [Google Scholar]
- 26.Aragón S.R., Pecora R. Fluorescence correlation spectroscopy and Brownian rotational diffusion. Biopolymers. 1975;14:119–138. [Google Scholar]
- 27.Palmer III A.G., Thompson N.L. Optical spatial intensity profiles for high order autocorrelation in fluorescence spectroscopy. Appl. Opt. 1989;28:1214–1220. doi: 10.1364/AO.28.001214. [DOI] [PubMed] [Google Scholar]
- 28.Pucadyil T.J., Kalipatnapu S., Chattopadhyay A. G-protein-dependent cell surface dynamics of the human serotonin1A receptor tagged to yellow fluorescent protein. Biochemistry. 2004;43:15852–15862. doi: 10.1021/bi0480887. [DOI] [PubMed] [Google Scholar]
- 29.Wenger J., Conchonaud F., Lenne P.F. Diffusion analysis within single nanometric apertures reveals the ultrafine cell membrane organization. Biophys. J. 2007;92:913–919. doi: 10.1529/biophysj.106.096586. [DOI] [PMC free article] [PubMed] [Google Scholar]
- 30.Ganguly S., Pucadyil T.J., Chattopadhyay A. Actin cytoskeleton-dependent dynamics of the human serotonin1A receptor correlates with receptor signaling. Biophys. J. 2008;95:451–463. doi: 10.1529/biophysj.107.125732. [DOI] [PMC free article] [PubMed] [Google Scholar]
- 31.Ganguly S., Singh P., Chattopadhyay A. Differential dynamics of membrane proteins in yeast. Biochem. Biophys. Res. Commun. 2009;387:661–665. doi: 10.1016/j.bbrc.2009.07.054. [DOI] [PubMed] [Google Scholar]
- 32.Suzuki K., Ritchie K., Kusumi A. Rapid hop diffusion of a G-protein-coupled receptor in the plasma membrane as revealed by single-molecule techniques. Biophys. J. 2005;88:3659–3680. doi: 10.1529/biophysj.104.048538. [DOI] [PMC free article] [PubMed] [Google Scholar]
- 33.Hein P., Frank M., Bünemann M. Dynamics of receptor/G protein coupling in living cells. EMBO J. 2005;24:4106–4114. doi: 10.1038/sj.emboj.7600870. [DOI] [PMC free article] [PubMed] [Google Scholar]
- 34.Vilardaga J.-P., Bünemann M., Hoffmann C. GPCR and G proteins: drug efficacy and activation in live cells. Mol. Endocrinol. 2009;23:590–599. doi: 10.1210/me.2008-0204. [DOI] [PMC free article] [PubMed] [Google Scholar]
- 35.Sampath P., Pollard T.D. Effects of cytochalasin, phalloidin, and pH on the elongation of actin filaments. Biochemistry. 1991;30:1973–1980. doi: 10.1021/bi00221a034. [DOI] [PubMed] [Google Scholar]
- 36.Zidovetzki R., Levitan I. Use of cyclodextrins to manipulate plasma membrane cholesterol content: evidence, misconceptions and control strategies. Biochim. Biophys. Acta. 2007;1768:1311–1324. doi: 10.1016/j.bbamem.2007.03.026. [DOI] [PMC free article] [PubMed] [Google Scholar]
- 37.Pucadyil T.J., Chattopadhyay A. Role of cholesterol in the function and organization of G-protein coupled receptors. Prog. Lipid Res. 2006;45:295–333. doi: 10.1016/j.plipres.2006.02.002. [DOI] [PubMed] [Google Scholar]
- 38.Paila Y.D., Tiwari S., Chattopadhyay A. Are specific nonannular cholesterol binding sites present in G-protein coupled receptors? Biochim. Biophys. Acta. 2009;1788:295–302. doi: 10.1016/j.bbamem.2008.11.020. [DOI] [PubMed] [Google Scholar]
- 39.Pucadyil T.J., Chattopadhyay A. Cholesterol depletion induces dynamic confinement of the G-protein coupled serotonin1A receptor in the plasma membrane of living cells. Biochim. Biophys. Acta. 2007;1768:655–668. doi: 10.1016/j.bbamem.2007.01.002. [DOI] [PubMed] [Google Scholar]
- 40.Saxton M.J., Jacobson K. Single-particle tracking: applications to membrane dynamics. Annu. Rev. Biophys. Biomol. Struct. 1997;26:373–399. doi: 10.1146/annurev.biophys.26.1.373. [DOI] [PubMed] [Google Scholar]
- 41.Sung B.J., Yethiraj A. Lateral diffusion of proteins in the plasma membrane: spatial tessellation and percolation theory. J. Phys. Chem. B. 2008;112:143–149. doi: 10.1021/jp0772068. [DOI] [PubMed] [Google Scholar]
- 42.McCloskey M.A., Poo M.-M. Rates of membrane-associated reactions: reduction of dimensionality revisited. J. Cell Biol. 1986;102:88–96. doi: 10.1083/jcb.102.1.88. [DOI] [PMC free article] [PubMed] [Google Scholar]
- 43.Gennis R.B. Springer-Verlag; New York: 1989. Biomembranes: Molecular Structure and Function. [Google Scholar]
- 44.Kwik J., Boyle S., Edidin M. Membrane cholesterol, lateral mobility, and the phosphatidylinositol 4,5-bisphosphate-dependent organization of cell actin. Proc. Natl. Acad. Sci. USA. 2003;100:13964–13969. doi: 10.1073/pnas.2336102100. [DOI] [PMC free article] [PubMed] [Google Scholar]
- 45.Tsai H.-I., Tsai L.-H., Chou Y.C. Cholesterol deficiency perturbs actin signaling and glutamate homeostasis in hippocampal astrocytes. Brain Res. 2006;1104:27–38. doi: 10.1016/j.brainres.2006.05.081. [DOI] [PubMed] [Google Scholar]
- 46.Giocondi M.-C., Milhiet P.E., Le Grimellec C. Use of cyclodextrin for AFM monitoring of model raft formation. Biophys. J. 2004;86:861–869. doi: 10.1016/s0006-3495(04)74161-2. [DOI] [PMC free article] [PubMed] [Google Scholar]
- 47.Rodal S.K., Skretting G., Sandvig K. Extraction of cholesterol with methyl-β-cyclodextrin perturbs formation of clathrin-coated endocytic vesicles. Mol. Biol. Cell. 1999;10:961–974. doi: 10.1091/mbc.10.4.961. [DOI] [PMC free article] [PubMed] [Google Scholar]
- 48.Subtil A., Gaidarov I., McGraw T.E. Acute cholesterol depletion inhibits clathrin-coated pit budding. Proc. Natl. Acad. Sci. USA. 1999;96:6775–6780. doi: 10.1073/pnas.96.12.6775. [DOI] [PMC free article] [PubMed] [Google Scholar]
- 49.Paila Y.D., Murty M.R.V.S., Chattopadhyay A. Signaling by the human serotonin1A receptor is impaired in cellular model of Smith-Lemli-Opitz Syndrome. Biochim. Biophys. Acta. 2008;1778:1508–1516. doi: 10.1016/j.bbamem.2008.03.002. [DOI] [PubMed] [Google Scholar]
- 50.Kenworthy A.K., Nichols B.J., Lippincott-Schwartz J. Dynamics of putative raft-associated proteins at the cell surface. J. Cell Biol. 2004;165:735–746. doi: 10.1083/jcb.200312170. [DOI] [PMC free article] [PubMed] [Google Scholar]
- 51.Vrljic M., Nishimura S.Y., McConnell H.M. Cholesterol depletion suppresses the translational diffusion of class II major histocompatibility complex proteins in the plasma membrane. Biophys. J. 2005;88:334–347. doi: 10.1529/biophysj.104.045989. [DOI] [PMC free article] [PubMed] [Google Scholar]
- 52.Bacia K., Scherfeld D., Schwille P. Fluorescence correlation spectroscopy relates rafts in model and native membranes. Biophys. J. 2004;87:1034–1043. doi: 10.1529/biophysj.104.040519. [DOI] [PMC free article] [PubMed] [Google Scholar]
- 53.Adkins E.M., Samuvel D.J., Gether U. Membrane mobility and microdomain association of the dopamine transporter studied with fluorescence correlation spectroscopy and fluorescence recovery after photobleaching. Biochemistry. 2007;46:10484–10497. doi: 10.1021/bi700429z. [DOI] [PubMed] [Google Scholar]
- 54.Pralle A., Keller P., Hörber J.K. Sphingolipid-cholesterol rafts diffuse as small entities in the plasma membrane of mammalian cells. J. Cell Biol. 2000;148:997–1008. doi: 10.1083/jcb.148.5.997. [DOI] [PMC free article] [PubMed] [Google Scholar]
- 55.Jans D.A., Peters R., Fahrenholz F. Vasopressin V2-receptor mobile fraction and ligand-dependent adenylate cyclase activity are directly correlated in LLC-PK1 renal epithelial cells. J. Cell Biol. 1991;114:53–60. doi: 10.1083/jcb.114.1.53. [DOI] [PMC free article] [PubMed] [Google Scholar]
Associated Data
This section collects any data citations, data availability statements, or supplementary materials included in this article.