

Abstract
Successful macromolecular crystallography requires solution conditions that may alter the conformational sampling of a macromolecule. Here, site-directed spin labeling is used to examine a conformational equilibrium within BtuB, the Escherichia coli outer membrane transporter for vitamin B12. Electron paramagnetic resonance (EPR) spectra from a spin label placed within the N-terminal energy coupling motif (Ton box) of BtuB indicate that this segment is in equilibrium between folded and unfolded forms. In bilayers, substrate binding shifts this equilibrium toward the unfolded form; however, EPR spectra from this same spin-labeled mutant indicate that this unfolding transition is blocked in protein crystals. Moreover, crystal structures of this spin-labeled mutant are consistent with the EPR result. When the free energy difference between substates is estimated from the EPR spectra, the crystal environment is found to alter this energy by 3 kcal/mol when compared to the bilayer state. Approximately half of this energy change is due to solutes or osmolytes in the crystallization buffer, and the remainder is contributed by the crystal lattice. These data provide a quantitative measure of how a conformational equilibrium in BtuB is modified in the crystal environment, and suggest that more-compact, less-hydrated substates will be favored in protein crystals.
Introduction
Proteins are dynamic and structurally heterogeneous. They exhibit collective and uncoupled motions over a wide range of timescales (1,2) and they may assume numerous discrete structural substates that are in equilibrium. This motion and sampling of structural states is important and appears to be critical to enzyme activity and allosteric regulation (3–5). In protein crystals, dynamics and structural heterogeneity are present, and at sufficiently high resolution, may be well represented by the use of multiple conformations of the side-chain (6) and backbone atoms (7).
There are indications that protein crystallization and the conditions used for crystallization may alter protein dynamics and conformational sampling. Molecular dynamics simulations of proteins in a crystal lattice have been performed for both soluble (8–10), and membrane (11) proteins. These computational efforts suggest that conformational sampling may be altered by protein crystallization. In addition, experiments employing precipitants or osmolytes similar to those used in protein crystallization demonstrate that these solutes may have a significant effect on exchange between long-lived conformational substates; for example, osmolytes have been found to alter conformational substates involved in enzymatic activity (12,13) and ion conduction (14).
In BtuB, the outer membrane Escherichia coli vitamin B12 (CNCbl) transporter, an electron paramagnetic resonance (EPR)-based method termed site-directed spin labeling (SDSL), has been used to investigate the dynamics and structural transitions in an N-terminal energy coupling segment termed the Ton box (15). The Ton box couples BtuB to the inner membrane protein TonB, which provides energy for transport (16–18). SDSL provides strong evidence that the Ton box undergoes a vitamin B12-dependent unfolding (19,20), as depicted in Fig. 1. This event moves the Ton box 20–30 Å into the periplasmic space, where it may act as a trigger to initiate BtuB-TonB interactions (21). In contrast, the Ton box remains folded within the transporter in crystal structures of BtuB either in the presence or absence of substrate. While there are small shifts in the conformation of the Ton box upon substrate binding, no evidence is seen for the substrate-dependent unfolding observed spectroscopically (22).
Figure 1.
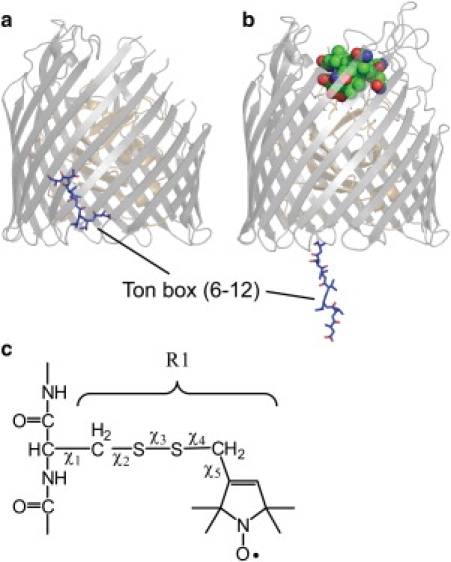
BtuB in the (a) apo form where the Ton box position is highlighted (PDB ID: 1NQE). (b) Vitamin B12 bound form of BtuB showing the state of the Ton box as determined by EPR spectra and pulse EPR distance measurements (based upon PDB ID 1NQH and spectroscopic restraints obtained for the Ton box in bilayers (21)). This unfolding event places the Ton box as much as 30 Å into the periplasmic space. (c) The structure of the spin-labeled R1 side chain and dihedral angles that define the rotamers of R1.
The discrepancy between the spectroscopic and crystallographic result might have several origins. EPR spectroscopy of membrane-associated BtuB demonstrates that there is an equilibrium between folded and unfolded substates of the Ton box, and that this equilibrium is shifted toward the more folded state by the osmolytes used in the BtuB crystallization (23–25). Osmolytes, such as polyethylene glycols (PEGs), are believed to be excluded from hydrated protein surfaces (26,27), thereby raising the energy of the protein and reducing its solubility. As a result, the presence of osmolytes will favor conformational substates that are less hydrated (12,28,29). The packing of the protein within the crystal lattice might also account for the difference between the spectroscopic and crystallographic result. Although protein-protein contacts within the unit cell should not interfere sterically with the unfolding of the Ton box, the contributions that the lattice might make to the Ton box equilibrium are not known.
To determine how the Ton box equilibrium is modified within the protein crystal compared to the bilayer state, we generated a spin-labeled mutant of BtuB where the nitroxide side chain R1 (Fig. 1 c) is incorporated into the Ton box at position 10. EPR spectroscopy was then carried out in parallel with x-ray diffraction and structure determination of this labeled BtuB mutant (V10R1) using the same protein crystals. The EPR spectra obtained from the protein crystal indicate that the substrate-dependent Ton box transition is blocked. This spectroscopic result is consistent with crystal structures of this BtuB mutant, which indicate that the Ton box remains folded and the R1 side chain buried with or without substrate. By comparing EPR spectra of BtuB-V10R1 in bilayers with spectra from the protein crystal, we estimate the free energy change induced by the crystal environment on this conformational equilibrium, and dissect the energetic contributions made by solute and the crystal lattice.
Materials and Methods
Mutagenesis, expression, and purification
The V10C mutation was introduced into btuB using a QuikChange site-directed mutagenesis kit (Stratagene, La Jolla, CA), and was subsequently verified by nucleotide sequencing. Expression and purification of BtuB for the formation of protein crystals was performed as described previously (22), and BtuB was reconstituted into vesicle bilayers by following a procedure described elsewhere (30).
Spin labeling
For spin labeling, the first round of purification was paused before initiation of the salt gradient. The Q-Sepharose slurry (Amersham, Piscataway, NJ) bound with BtuB was transferred to a conical tube and reacted with 1 mL of 45 mM S-(1-oxy-2,2,5,6-tetramethylpyrroline-3-methyl)methanethiosulfonate (MTSL; Toronto Research Chemicals, Ontario, Canada) for 4 h at room temperature.
Crystallization and crystallographic data collection
Purified BtuB (11 mg/mL in 30 mM Tris pH 8.0, 20 mM C8E4) was crystallized by mixing 1 μL of BtuB and 1 μL of reservoir buffer in an EasyXtal hanging-drop tray (Qiagen, Germantown, MD), containing 200 μL of total reservoir buffer for each crystallization condition, and followed by incubation at 290 K. The reservoir buffer consisted of 200–550 mM magnesium acetate, 5.0–7.5% PEG3350, and 20 mM Bis Tris at pH 6.6. Crystals were visible after 1–2 days, and grew to ∼200 μm in the longest dimension after 1–2 weeks. For crystals to be incubated with substrate, 1 μL of soaking buffer (150 mM calcium chloride, 2.5% PEG3350, 20 mM Bis Tris at pH 6.6, and 10 mM C8E4) was added to each well, followed by incubation overnight. The crystals were subsequently transferred into soaking buffer containing 1 mM cyanocobalamin and 20% glycerol, and allowed to incubate for at least 4 h. For x-ray diffraction, apo and Ca2+B12-soaked crystals were transferred to cryo-buffer (150 mM magnesium acetate or calcium chloride, 2.5% PEG3350, 20 mM Bis Tris at pH 6.6, 10 mM C8E4, and 20% glycerol) for 1–2 min before loop mounting and cryocooling by insertion into liquid nitrogen. Diffraction data were taken at 90 K at the 22ID beamline at the Advanced Photon Source (Argonne National Laboratory, Argonne, IL). See Table 1 for more details.
Table 1.
Data collection and refinement for BtuB-V10R1
| Structure | BtuB-V10R1 apo | BtuB-V10R1 +Ca2+B12 |
|---|---|---|
| Data collection | ||
| Beamline | APS-22ID | APS-22ID |
| Wavelength (Å) | 1.000 | 1.000 |
| Temperature (K) | 90 | 90 |
| Reflections observed | 311,539 | 294,094 |
| Unique reflections | 32,472 | 32,358 |
| Resolution range (Å)∗ | 50–2.40 (2.49–2.40) | 50–2.45 (2.54–2.45) |
| Space group | P3121 | P3121 |
| Cell dimensions | a = b = 81.3 Å, c = 226.6 Å | a = b = 82.1 Å, c = 224.5 Å |
| α = β = 90°, γ = 120° | α = β = 90°, γ = 120° | |
| Rsym (%) | 9.1 (38.3) | 12.1 (45.8) |
| Redundancy | 9.6 | 9.1 |
| Refinement | ||
| Resolution range (Å) | 44.1–2.44 (2.50–2.44) | 44.0–2.44 (2.51–2.44) |
| Reflections used | 30,769 | 30,642 |
| Completeness (%) | 97.6 (79.3) | 96.6 (67.3) |
| Rcryst (%)† | 22.1 | 22.9 |
| Rfree (%)‡ | 24.8 | 27.5 |
| Root-mean-square deviations | ||
| Bond lengths (Å) | 0.021 | 0.019 |
| Bond angles (°) | 1.839 | 2.037 |
| Number of atoms | ||
| Protein | 4605 | 4865 |
| Water | 113 | 76 |
| Other | C8E4 (7), Mg (4) | CNCbl (1), Ca2+ (3), C8E4 (6) |
| PDB accession code | 3M8B | 3M8D |
Highest resolution shell data shown in parentheses.
Rcryst = Σ‖Fobs|-|Fcalc‖ / Σ|Fobs|, where Fobs and Fcalc are the observed and calculated structure factor amplitudes, respectively.
Rfree is Rcryst calculated using 5% of the data which is randomly chosen and omitted from the refinement.
Structure determination
Indexing, integration, and scaling of the diffraction data was performed using HKL2000 (31). The structures were solved with PHASER (32) maximum likelihood molecular replacement method, using PDB depositions 1NQE and 1NQH (22) as search models for the apo- and Ca2+B12-bound data, respectively. To reduce model bias, V10 was deleted from the apo-search model, and the entire Ton box was deleted from the Ca2+-CNCbl-bound search model. Model building was done in COOT (33), and unrestrained TLS (34) refinement was performed using REFMAC (35) and PHENIX was used to refine the occupancy of the spin label (36). The spin-labeled residue V10R1 was manually built in COOT. Anomalous difference Fourier maps were calculated to accurately position bound cobalt and calcium using Sfall and fast-Fourier transform (37). Completed structures were evaluated and validated with MolProbity (38).
Electron paramagnetic resonance
Apo- and Ca2+ B12-soaked crystals were incubated for at least 4 h in cryobuffer and soaking buffer (with 1 mM cyanocobalamin and 20% glycerol), respectively. Crystals were then transferred to a 0.60 ID × 0.84 OD round capillary with a syringe (Hamilton Syringe, Bonaduz, Switzerland) for EPR spectroscopy, which was performed on an X-band EMX spectrometer (Bruker Biospin, Billerica, MA) equipped with a dielectric resonator. All EPR spectra were recorded with a 100 G magnetic field sweep at 2.0 mW incident power at a temperature of 298 K. The phasing, normalization, and subtraction of EPR spectra was performed using LabVIEW software provided by Dr. Christian Altenbach (University of California, Los Angeles, California).
To determine the free energies and free energy changes between Ton box states, the population of each Ton box conformation was determined by spectral subtraction and quantitation of the spectral components as described previously (24). For BtuB V10R1, the EPR spectra are linear combinations of the spectra resulting from the folded and unfolded Ton box conformations. As a result, the fraction of spins in each population may be estimated by determining the contribution that each conformation makes to the total spectrum. The label at position 10 was chosen for these measurements, because EPR spectra for V10R1 yield dramatically different lineshapes for the folded and unfolded forms of the Ton box. As a result, it is easy to simulate both the folded and unfolded lineshape. In this case, the mobile lineshape was simulated (using Redfield theory (39)) and subtracted from the composite spectrum until a spectrum corresponding to the purely folded Ton box conformation was obtained. Double integration of the first derivative EPR spectra yields numbers that are proportional to spin number and was used to estimate the populations of folded and unfolded Ton box.
Results
The Ton box exhibits a substrate-dependent unfolding in bilayers but not in protein crystals
The label at position 10 was chosen for these experiments for two reasons. First, the incorporation of R1 at some sites may perturb the Ton box fold; however, the incorporation of R1 at position 10 does not appear to be highly perturbing (20). Second, the spectra from BtuB-V10R1 are particularly good at revealing different conformational substates of the Ton box, and these states are easily quantitated from the EPR spectra of V10R1.
Shown in Fig. 2 a are EPR spectra for BtuB-V10R1 with and without substrate in lipid bilayers composed of POPC. Spectra for BtuB-V10R1 in bilayers have been reported previously (20), and in the absence of substrate the spectrum is dominated by a broad component resulting from an immobile spin-labeled side chain that is near the rigid-limit of nitroxide motion at X-band (τc 30–50 ns). This broad component results from a label that is in strong tertiary contact with other side chains in BtuB. In the presence of substrate, the spectrum changes dramatically and is dominated by a narrow high-amplitude component arising from a motionally averaged nitroxide attached to a disordered backbone segment. A careful examination of the EPR lineshapes in Fig. 2 a indicates that in each case (with or without substrate), both immobile and mobile components can be distinguished. These components represent folded and unfolded substates of the Ton box in equilibrium (40), and the populations of these substates may be estimated from the EPR spectra using spectral subtraction (see Methods). This estimate shows that in the presence of substrate ∼50% of the Ton box is unfolded, and the free energy difference (ΔG°) between these two states is approximately zero.
Figure 2.
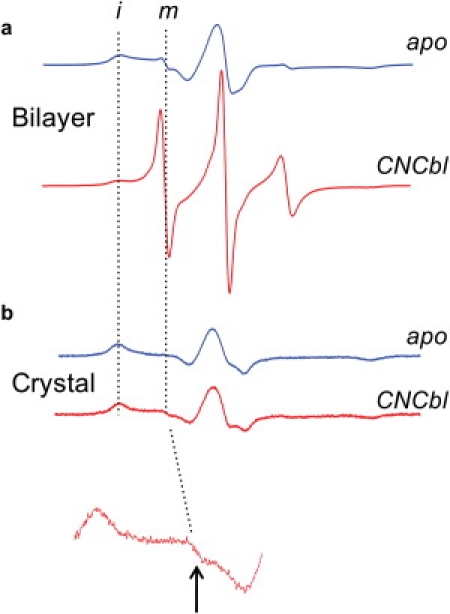
EPR spectra for V10R1 with (red traces) and without (blue traces) substrate when BtuB is incorporated into (a) POPC bilayers, or (b) in the protein crystal. The inset below is a 10× vertical expansion showing a small signal from unfolded Ton box. The dashed vertical lines indicate the positions of signals resulting from immobilized (i) and mobile (m) nitroxide side chain, corresponding to folded and unfolded Ton box, respectively.
Fig. 2 b shows an analogous pair of spectra obtained for V10R1 in protein crystals in cryo buffer (see Methods) with and without substrate. In the protein crystal, each spectrum reflects a nitroxide near the rigid limit of motion at X-band. The substrate-induced transition, which is clearly seen in bilayers (Fig. 2 a), is absent. A careful examination of the EPR spectrum for crystallized BtuB in the presence of vitamin B12 (Fig. 2 b) reveals a very minor mobile component (arrow in Fig. 2). This component matches the lineshape obtained for V10R1 in the unfolded state and appears to represent a small fraction of unfolded Ton box in the presence of substrate. Quantitation of this minor component by spectral subtraction indicates that it represents <0.5% of the total spin signal from V10R1, and that the folded form of the Ton box is stabilized by at least 3 kcal/mol for BtuB bound to substrate in the protein crystal. Because the energy difference between the folded and unfolded states of the Ton box is close to zero in bilayers, the free energy difference between these two protein substates is altered (a ΔΔG°) by ∼3 kcal/mol for BtuB-V10R1 in the protein crystal.
Structures from crystals of BtuB-V10R1 show no evidence for a substrate-dependent unfolding
Protein crystals of BtuB-V10R1 in the absence and presence of substrate diffracted to 2.4 Å and the refinement details are given in Table 1. In both cases, the Ton box is resolved and folded within the protein interior, and several extracellular loops become resolved in presence of ligand, as seen previously for wild-type (wt) BtuB (22). Fig. 3, a and b, displays periplasmic views of BtuB-V10R1, where the position of V10R1 in the protein interior as well as the configuration of the Ton box is shown. The label is sitting at the bottom of a pocket facing the periplasmic surface; and as expected, it is interacting with a number of side chains, including R219 and R255. As a result, conversion between label rotamers should be highly restricted, consistent with the rigid limit spectra seen by EPR (Fig. 2 b).
Figure 3.
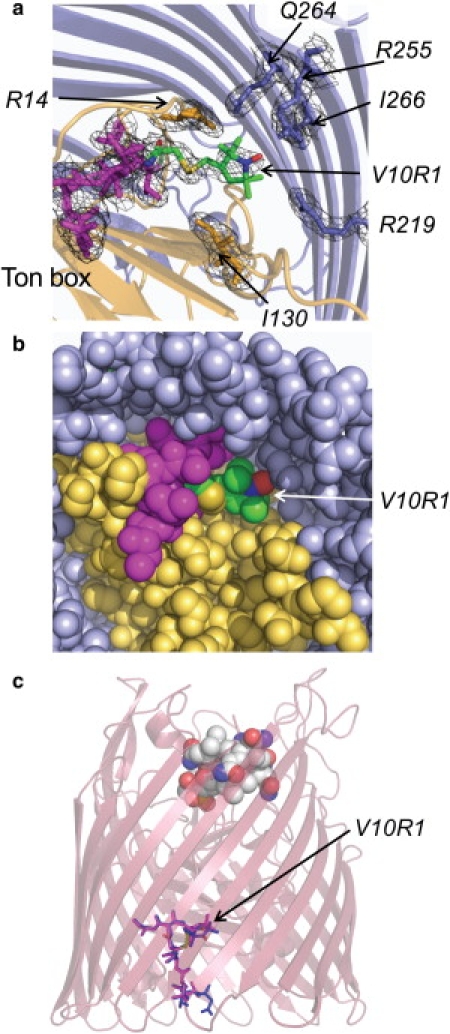
(a) Periplasmic view of the structure and electron density (1σ) showing the placement of the spin-labeled side chain V10R1 and residues that closely interact with the label in the apo form (PDB ID: 3M8B) of BtuB. (Magenta) Backbone of the Ton box. (Beige) N-terminal fold. (b) Periplasmic view of BtuB-V10R1 similar to that shown in panel a, except with van der Waals surfaces rendered for the atoms. The label, V10R1, is at the base of a periplasmic pocket in close tertiary contact with a number of atoms. (c) A comparison of the Ton box of BtuB-V10R1 with and without substrate. A side view of the crystal structure of the Ca2+-B12 bound form of V10R1 (PDB ID: 3M8D) is shown with B12 bound, and the Ton box (magenta). This structure was aligned with the apo form of BtuB-V10R1 where only the Ton box is rendered (blue).
The angles for χ1 and χ2 (Fig. 1 c) for R1 typically assume a limited set of rotameric states on protein surface sites, where the rotamers allow for an interaction between Sδ and HCα (41). Here V10R1 is found to have χ1 and χ2 angles of 56° and 69° in the apo form and 49° and 60° in the CNCbl-bound form, which are both in a {p, p} configuration using the conventions of Lovell et al. (42). The entire set of spin-label dihedral angles for V10R1 is given in Table 2. The Sδ-HCα distance for the R1 side chain is ∼4.5 Å, which is longer than that typically seen for R1 on helix surface sites. Although this rotamer is energetically allowed, it has not previously been observed in crystal structures (41), presumably due to the sterically restricted environment surrounding V10R1.
Table 2.
Summary of R1 side-chain dihedral angles and rotamer designation
| Mutant | Rotamer | χ1 | χ2 | χ3 | χ4 | χ5 |
|---|---|---|---|---|---|---|
| V10R1 apo | {p,p} | 56 | 69 | 83 | 67 | 67 |
| V10R1 Ca2+ and B12 | {p,p} | 49 | 60 | 70 | 93 | 46 |
Fig. 3 c compares the Ton box for the V10R1 mutant with and without CNCbl. The R1 side chain and the Ton box to which it is attached remain folded into the protein interior upon the addition of substrate, consistent with a lack of change in the EPR spectra shown in Fig. 2 b for the protein crystal. Substrate addition to BtuB-V10R1 produces a change in the position of residue 7, as seen previously for wt protein (22). However, residue 6, which is resolved in the wt structure, is not resolved for BtuB-V10R1 once substrate is bound. A B-factor analysis of the Ton box backbone and side-chain atoms indicates that when compared to wt BtuB structures, the BtuB-V10R1 has higher B-factors for the Ton box N-terminal to position 10, and a larger difference between apo- and ligand-bound forms. Nonetheless, the fold of the Ton box in BtuB-V10R1 is virtually identical to that seen in the wt structure (the root-mean-square deviation is 1.2 Å and 1.5 Å for the apo and CNCbl-bound forms of the Ton box, respectively, when V10R1 and wt are compared). Hence, minimal structural changes in the Ton box are induced by this particular label.
Both the crystal lattice and solutes shift the equilibrium between Ton box substates
To determine whether the crystal lattice makes a contribution to the free energy change when bilayer and crystal forms of BtuB are compared, EPR spectra from V10R1 were compared for the protein crystal and the protein solubilized into the cryo buffer. The two spectra for BtuB-V10R1 (in the CNCbl bound form) are compared in Fig. 4, a and b, and are clearly different. In particular, the spectrum from solubilized protein (Fig. 4 b) yields a mobile component with much higher amplitude than that for the protein crystal (Fig. 4 a). This mobile signal has a lineshape identical to that seen for the unfolded state in the bilayer (Fig. 2 a). Quantitation of the two components in this spectrum indicates that the mobile population makes up ∼8 ± 2% of the total spins. This fraction of unfolded Ton box corresponds to a change in free energy (a ΔΔG° for this transition relative to the bilayer reconstituted BtuB) of ∼1.5 ± 0.2 kcal/mol, indicating that solutes and the crystal lattice make roughly equal contributions to the change in conformational energy that is seen in the protein crystal.
Figure 4.
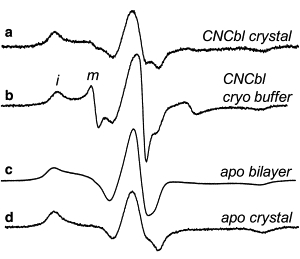
EPR spectra from BtuB-V10R1 with bound ligand in (a) the protein crystal, (b) in the crystallization buffer at a protein concentration too dilute to form crystals, and in the apo state in (c) lipid bilayers and (d) the protein crystal. The symbols i and m indicate immobilized and mobile components in the spectra for panel b. The spectrum in panel c is identical to the spectrum in Fig. 2a, except that the small mobile component seen in Fig. 2a has been subtracted. All spectra are 100 Gauss scans.
The lineshapes for the immobilized component in the absence of substrate for the bilayer reconstituted and crystallized BtuB-V10R1 are shown in Fig. 4, c and d, respectively. In this case the mobile component was subtracted from the bilayer BtuB-V10R1 (Fig. 2 a) to yield the immobile component in Fig. 4 c. Both these lineshapes result from immobile spin labels near the rigid limit of nitroxide motion. However, the hyperfine extrema in Fig. 4 c are not as distinct as in Fig. 4 d, and components representing the g-tensor anisotropy in the central (mI = 0) resonance of BtuB-V10R1 are better resolved in the protein crystal (Fig. 4 d). This difference provides an indication that additional motional modes are available for V10R1 in the bilayer environment.
Discussion
In this work, SDSL was used to examine a conformational equilibrium in the Escherichia coli outer membrane transporter, BtuB, both in lipid bilayers and in protein crystals. The results indicate that the equilibrium between folded and unfolded forms of the Ton box is shifted by ∼3 kcal/mol when the protein is taken from the bilayer phase to the protein crystal phase. This has the effect of stabilizing the folded form of the Ton box in the protein crystal, and it provides an explanation for the observation that the Ton box is resolved both in the absence and presence of substrate in crystal structures (22), but is seen to unfold in bilayers. It should be emphasized that protein crystallography does not provide an incorrect structure for BtuB. The conditions of the protein crystal alter the equilibrium distribution of substates, compared to the distribution found by EPR, to favor the more-compact-ordered conformer.
Osmolytes, such as PEGs, are well known to modify protein behavior (43), and previous work has demonstrated that osmolytes stabilize a folded form of the Ton box (15,24,25) and stabilize more-compact, less-hydrated conformations of the extracellular ligand-binding loops (44). The data obtained here indicate that solutes and the crystal lattice contribute almost equally to the energy change seen in the Ton box equilibrium. While the action of PEGs and other osmolytes is reasonably well understood, it is not presently known how the protein lattice in the crystal couples to the Ton box equilibrium and stabilizes its folded form in BtuB. Previous work has shown that there is an interaction between charged residues near the Ton box and the BtuB β-barrel (40), and that eliminating this interaction unfolds the Ton box. Conceivably, a change in the dynamics or structure of the BtuB β-barrel when the protein is in the crystal lattice might alter the energy of this interaction and account for the effect of the lattice upon the Ton box.
The structural biology of membrane proteins is far from mature, and it is not known whether the effects seen here on protein conformational sampling apply to a wider range of membrane proteins. Bacteriorhodopsin is perhaps the best-studied membrane protein, and there are indications that the kinetics of the photocycle are modified in the three-dimensional crystalline lattice when compared to the native membrane (45). Solution NMR can provide high-resolution structural data on membrane proteins in micelles, allowing comparisons to be made with crystal structures. NMR spectroscopy is often found to resolve portions of proteins that are not resolved by crystallography (as seen for DsbB (46)), presumably because NMR is better at examining structures that are inherently dynamic. In outer membrane porins, such as OmpA, the strands of the β-barrel are shorter in the NMR-derived structures than in the crystal structures (47); however, it is not clear whether this difference is a result of crystallization conditions or the micellar environment used for NMR. Even in a reconstituted bilayer environment (which is a much better approximation to the native environment than the protein crystal), protein conformational sampling may be modulated relative to the native environment (48–51); however, many of these effects appear to be due to the fraction of acidic lipids selected for the reconstitution, which in turn control local ion concentrations and pH. As for BtuB, the Ton box equilibrium does not appear to be modulated by lipid composition (Q. Xu and D. S. Cafiso, unpublished); this equilibrium is maintained within range of reconstituted bilayers as well as intact outer membrane preparations (19).
Changes in the equilibrium distribution of protein conformational substates are thought to underlie protein signaling events (52) and allostery (53). Because of its fast timescale, EPR spectroscopy is particularly well suited to detect these conformational substates and to measure conformational equilibria in proteins. In BtuB, SDSL demonstrates that both the folded and unfolded states of the Ton box are sampled and that substrate binding shifts the equilibrium to the more disordered state. Furthermore, colicin E3, which is also a ligand for BtuB, shifts the Ton box equilibrium to favor the folded, ordered state of the Ton box (54). These are precisely the types of changes that are proposed to underlie protein signaling, and in the present case, they may function to regulate coupling between BtuB and inner membrane protein TonB.
Acknowledgments
We thank Dr. Robert Nakamoto for careful reading of this manuscript.
This work was supported by National Institutes of Health grants Nos. NIGMS 035215 to D.S.C. and NIGMS 079800 to M.C.W. Use of the Advanced Photon Source was supported by the U. S. Department of Energy, Office of Science, Office of Basic Energy Sciences, under contract No. DE-AC02-06CH11357. Data were collected at Southeast Regional Collaborative Access Team (SER-CAT) 22-ID beamline at the Advanced Photon Source, Argon National Laboratory, Argonne, IL. Supporting institutions may be found at http://www.ser-cat.org/members.html.
References
- 1.Frauenfelder H., Sligar S.G., Wolynes P.G. The energy landscapes and motions of proteins. Science. 1991;254:1598–1603. doi: 10.1126/science.1749933. [DOI] [PubMed] [Google Scholar]
- 2.Henzler-Wildman K., Kern D. Dynamic personalities of proteins. Nature. 2007;450:964–972. doi: 10.1038/nature06522. [DOI] [PubMed] [Google Scholar]
- 3.Henzler-Wildman K.A., Lei M., Kern D. A hierarchy of timescales in protein dynamics is linked to enzyme catalysis. Nature. 2007;450:913–916. doi: 10.1038/nature06407. [DOI] [PubMed] [Google Scholar]
- 4.Bahar I., Chennubhotla C., Tobi D. Intrinsic dynamics of enzymes in the unbound state and relation to allosteric regulation. Curr. Opin. Struct. Biol. 2007;17:633–640. doi: 10.1016/j.sbi.2007.09.011. [DOI] [PMC free article] [PubMed] [Google Scholar]
- 5.Swain J.F., Gierasch L.M. The changing landscape of protein allostery. Curr. Opin. Struct. Biol. 2006;16:102–108. doi: 10.1016/j.sbi.2006.01.003. [DOI] [PubMed] [Google Scholar]
- 6.Dunbrack R.L., Jr. Rotamer libraries in the 21st century. Curr. Opin. Struct. Biol. 2002;12:431–440. doi: 10.1016/s0959-440x(02)00344-5. [DOI] [PubMed] [Google Scholar]
- 7.Davis I.W., Arendall W.B., 3rd, Richardson J.S. The backrub motion: how protein backbone shrugs when a sidechain dances. Structure. 2006;14:265–274. doi: 10.1016/j.str.2005.10.007. [DOI] [PubMed] [Google Scholar]
- 8.Walser R., Hünenberger P.H., van Gunsteren W.F. Molecular dynamics simulations of a double unit cell in a protein crystal: volume relaxation at constant pressure and correlation of motions between the two unit cells. Proteins. 2002;48:327–340. doi: 10.1002/prot.10143. [DOI] [PubMed] [Google Scholar]
- 9.Walser R., Hünenberger P.H., van Gunsteren W.F. Comparison of different schemes to treat long-range electrostatic interactions in molecular dynamics simulations of a protein crystal. Proteins. 2001;43:509–519. doi: 10.1002/prot.1062. [DOI] [PubMed] [Google Scholar]
- 10.Meinhold L., Smith J.C. Fluctuations and correlations in crystalline protein dynamics: a simulation analysis of staphylococcal nuclease. Biophys. J. 2005;88:2554–2563. doi: 10.1529/biophysj.104.056101. [DOI] [PMC free article] [PubMed] [Google Scholar]
- 11.Bond P.J., Faraldo-Gómez J.D., Sansom M.S. Membrane protein dynamics and detergent interactions within a crystal: a simulation study of OmpA. Proc. Natl. Acad. Sci. USA. 2006;103:9518–9523. doi: 10.1073/pnas.0600398103. [DOI] [PMC free article] [PubMed] [Google Scholar]
- 12.Colombo M.F., Rau D.C., Parsegian V.A. Protein solvation in allosteric regulation: a water effect on hemoglobin. Science. 1992;256:1335–1336. doi: 10.1126/science.1585178. [DOI] [PubMed] [Google Scholar]
- 13.Parsegian V.A., Rand R.P., Rau D.C. Macromolecules and water: probing with osmotic stress. Methods Enzymol. 1995;259:43–94. doi: 10.1016/0076-6879(95)59039-0. [DOI] [PubMed] [Google Scholar]
- 14.Vodyanoy I., Bezrukov S.M., Parsegian V.A. Probing alamethicin channels with water-soluble polymers. Size-modulated osmotic action. Biophys. J. 1993;65:2097–2105. doi: 10.1016/S0006-3495(93)81245-1. [DOI] [PMC free article] [PubMed] [Google Scholar]
- 15.Kim M., Fanucci G.E., Cafiso D.S. Substrate-dependent transmembrane signaling in TonB-dependent transporters is not conserved. Proc. Natl. Acad. Sci. USA. 2007;104:11975–11980. doi: 10.1073/pnas.0702172104. [DOI] [PMC free article] [PubMed] [Google Scholar]
- 16.Postle K., Kadner R.J. Touch and go: tying TonB to transport. Mol. Microbiol. 2003;49:869–882. doi: 10.1046/j.1365-2958.2003.03629.x. [DOI] [PubMed] [Google Scholar]
- 17.Wiener M.C. TonB-dependent outer membrane transport: going for Baroque? Curr. Opin. Struct. Biol. 2005;15:394–400. doi: 10.1016/j.sbi.2005.07.001. [DOI] [PubMed] [Google Scholar]
- 18.Schauer K., Rodionov D.A., de Reuse H. New substrates for TonB-dependent transport: do we only see the ‘tip of the iceberg’? Trends Biochem. Sci. 2008;33:330–338. doi: 10.1016/j.tibs.2008.04.012. [DOI] [PubMed] [Google Scholar]
- 19.Merianos H.J., Cadieux N., Cafiso D.S. Substrate-induced exposure of an energy-coupling motif of a membrane transporter. Nat. Struct. Biol. 2000;7:205–209. doi: 10.1038/73309. [DOI] [PubMed] [Google Scholar]
- 20.Fanucci G.E., Coggshall K.A., Cafiso D.S. Substrate-induced conformational changes of the periplasmic N-terminus of an outer-membrane transporter by site-directed spin labeling. Biochemistry. 2003;42:1391–1400. doi: 10.1021/bi027120z. [DOI] [PubMed] [Google Scholar]
- 21.Xu Q., Ellena J.F., Cafiso D.S. Substrate-dependent unfolding of the energy coupling motif of a membrane transport protein determined by double electron-electron resonance. Biochemistry. 2006;45:10847–10854. doi: 10.1021/bi061051x. [DOI] [PMC free article] [PubMed] [Google Scholar]
- 22.Chimento D.P., Mohanty A.K., Wiener M.C. Substrate-induced transmembrane signaling in the cobalamin transporter BtuB. Nat. Struct. Biol. 2003;10:394–401. doi: 10.1038/nsb914. [DOI] [PubMed] [Google Scholar]
- 23.Fanucci G.E., Lee J.Y., Cafiso D.S. Spectroscopic evidence that osmolytes used in crystallization buffers inhibit a conformation change in a membrane protein. Biochemistry. 2003;42:13106–13112. doi: 10.1021/bi035439t. [DOI] [PubMed] [Google Scholar]
- 24.Kim M., Xu Q., Cafiso D.S. Solutes modify a conformational transition in a membrane transport protein. Biophys. J. 2006;90:2922–2929. doi: 10.1529/biophysj.105.078246. [DOI] [PMC free article] [PubMed] [Google Scholar]
- 25.Flores Jiménez R.H., Do Cao M.A., Cafiso D.S. Osmolytes modulate conformational exchange in solvent-exposed regions of membrane proteins. Protein Sci. 2010;19:269–278. doi: 10.1002/pro.305. [DOI] [PMC free article] [PubMed] [Google Scholar]
- 26.Arakawa T., Timasheff S.N. The stabilization of proteins by osmolytes. Biophys. J. 1985;47:411–414. doi: 10.1016/S0006-3495(85)83932-1. [DOI] [PMC free article] [PubMed] [Google Scholar]
- 27.Arakawa T., Timasheff S.N. Mechanism of poly(ethylene glycol) interaction with proteins. Biochemistry. 1985;24:6756–6762. doi: 10.1021/bi00345a005. [DOI] [PubMed] [Google Scholar]
- 28.Timasheff S.N. Protein hydration, thermodynamic binding, and preferential hydration. Biochemistry. 2002;41:13473–13482. doi: 10.1021/bi020316e. [DOI] [PubMed] [Google Scholar]
- 29.Zimmerberg J., Bezanilla F., Parsegian V.A. Solute inaccessible aqueous volume changes during opening of the potassium channel of the squid giant axon. Biophys. J. 1990;57:1049–1064. doi: 10.1016/S0006-3495(90)82623-0. [DOI] [PMC free article] [PubMed] [Google Scholar]
- 30.Fanucci G.E., Cadieux N., Cafiso D.S. Structure and dynamics of the β-barrel of the membrane transporter BtuB by site-directed spin labeling. Biochemistry. 2002;41:11543–11551. doi: 10.1021/bi0259397. [DOI] [PubMed] [Google Scholar]
- 31.Otwinowski Z., Minor W. Processing of x-ray diffraction data collected in oscillation mode. Methods Enzymol. 1997;276:307–326. doi: 10.1016/S0076-6879(97)76066-X. [DOI] [PubMed] [Google Scholar]
- 32.McCoy A.J., Grosse-Kunstleve R.W., Read R.J. PHASER crystallographic software. J. Appl. Cryst. 2007;40:658–674. doi: 10.1107/S0021889807021206. [DOI] [PMC free article] [PubMed] [Google Scholar]
- 33.Emsley P., Cowtan K. COOT: model-building tools for molecular graphics. Acta Crystallogr. D Biol. Crystallogr. 2004;60:2126–2132. doi: 10.1107/S0907444904019158. [DOI] [PubMed] [Google Scholar]
- 34.Adams P.D., Grosse-Kunstleve R.W., Terwilliger T.C. PHENIX: building new software for automated crystallographic structure determination. Acta Crystallogr. D Biol. Crystallogr. 2002;58:1948–1954. doi: 10.1107/s0907444902016657. [DOI] [PubMed] [Google Scholar]
- 35.Murshudov G.N., Vagin A.A., Dodson E.J. Refinement of macromolecular structures by the maximum-likelihood method. Acta Crystallogr. D Biol. Crystallogr. 1997;53:240–255. doi: 10.1107/S0907444996012255. [DOI] [PubMed] [Google Scholar]
- 36.Winn M.D., Isupov M.N., Murshudov G.N. Use of TLS parameters to model anisotropic displacements in macromolecular refinement. Acta Crystallogr. D Biol. Crystallogr. 2001;57:122–133. doi: 10.1107/s0907444900014736. [DOI] [PubMed] [Google Scholar]
- 37.Potterton E., Briggs P., Dodson E. A graphical user interface to the CCP4 program suite. Acta Crystallogr. D Biol. Crystallogr. 2003;59:1131–1137. doi: 10.1107/s0907444903008126. [DOI] [PubMed] [Google Scholar]
- 38.Davis I.W., Leaver-Fay A., Richardson D.C. MolProbity: all-atom contacts and structure validation for proteins and nucleic acids. Nucleic Acids Res. 2007;35(Web Server issue):W375–W383. doi: 10.1093/nar/gkm216. [DOI] [PMC free article] [PubMed] [Google Scholar]
- 39.Stone T.J., Buckman T., McConnell H.M. Spin-labeled biomolecules. Proc. Natl. Acad. Sci. USA. 1965;54:1010–1017. doi: 10.1073/pnas.54.4.1010. [DOI] [PMC free article] [PubMed] [Google Scholar]
- 40.Lukasik S.M., Ho K.W., Cafiso D.S. Molecular basis for substrate-dependent transmembrane signaling in an outer-membrane transporter. J. Mol. Biol. 2007;370:807–811. doi: 10.1016/j.jmb.2007.05.040. [DOI] [PMC free article] [PubMed] [Google Scholar]
- 41.Guo Z., Cascio D., Hubbell W.L. Structural determinants of nitroxide motion in spin-labeled proteins: solvent-exposed sites in helix B of T4 lysozyme. Protein Sci. 2008;17:228–239. doi: 10.1110/ps.073174008. [DOI] [PMC free article] [PubMed] [Google Scholar]
- 42.Lovell S.C., Word J.M., Richardson D.C. The penultimate rotamer library. Proteins. 2000;40:389–408. [PubMed] [Google Scholar]
- 43.Auton M., Bolen D.W., Rösgen J. Structural thermodynamics of protein preferential solvation: osmolyte solvation of proteins, amino acids, and peptides. Proteins. 2008;73:802–813. doi: 10.1002/prot.22103. [DOI] [PubMed] [Google Scholar]
- 44.Kim M., Xu Q., Cafiso D.S. Solutes alter the conformation of the ligand binding loops in outer membrane transporters. Biochemistry. 2008;47:670–679. doi: 10.1021/bi7016415. [DOI] [PubMed] [Google Scholar]
- 45.Efremov R., Gordeliy V.I., Büldt G. Time-resolved microspectroscopy on a single crystal of bacteriorhodopsin reveals lattice-induced differences in the photocycle kinetics. Biophys. J. 2006;91:1441–1451. doi: 10.1529/biophysj.106.083345. [DOI] [PMC free article] [PubMed] [Google Scholar]
- 46.Zhou Y., Cierpicki T., Bushweller J.H. NMR solution structure of the integral membrane enzyme DsbB: functional insights into DsbB-catalyzed disulfide bond formation. Mol. Cell. 2008;31:896–908. doi: 10.1016/j.molcel.2008.08.028. [DOI] [PMC free article] [PubMed] [Google Scholar]
- 47.Tamm L.K., Abildgaard F., Bushweller J.H. Structure, dynamics and function of the outer membrane protein A (OmpA) and influenza hemagglutinin fusion domain in detergent micelles by solution NMR. FEBS Lett. 2003;555:139–143. doi: 10.1016/s0014-5793(03)01127-x. [DOI] [PubMed] [Google Scholar]
- 48.Brown M.F. Modulation of rhodopsin function by properties of the membrane bilayer. Chem. Phys. Lipids. 1994;73:159–180. doi: 10.1016/0009-3084(94)90180-5. [DOI] [PubMed] [Google Scholar]
- 49.Turnheim K., Gruber J., Ruiz-Gutiérrez V. Membrane phospholipid composition affects function of potassium channels from rabbit colon epithelium. Am. J. Physiol. 1999;277:C83–C90. doi: 10.1152/ajpcell.1999.277.1.C83. [DOI] [PubMed] [Google Scholar]
- 50.Baenziger J.E., Ryan S.E., daCosta C.J. Lipid composition alters drug action at the nicotinic acetylcholine receptor. Mol. Pharmacol. 2008;73:880–890. doi: 10.1124/mol.107.039008. [DOI] [PubMed] [Google Scholar]
- 51.Charalambous K., Miller D., Booth P.J. Lipid bilayer composition influences small multidrug transporters. BMC Biochem. 2008;9:31. doi: 10.1186/1471-2091-9-31. [DOI] [PMC free article] [PubMed] [Google Scholar]
- 52.Smock R.G., Gierasch L.M. Sending signals dynamically. Science. 2009;324:198–203. doi: 10.1126/science.1169377. [DOI] [PMC free article] [PubMed] [Google Scholar]
- 53.Hilser V.J. Biochemistry. An ensemble view of allostery. Science. 2010;327:653–654. doi: 10.1126/science.1186121. [DOI] [PMC free article] [PubMed] [Google Scholar]
- 54.Fanucci G.E., Cadieux N., Cafiso D.S. Competing ligands stabilize alternate conformations of the energy coupling motif of a TonB-dependent outer membrane transporter. Proc. Natl. Acad. Sci. USA. 2003;100:11382–11387. doi: 10.1073/pnas.1932486100. [DOI] [PMC free article] [PubMed] [Google Scholar]