Abstract
Objective:
To investigate the cognitive and neural basis for nonfluent speech in progressive nonfluent aphasia (PNFA).
Background:
Nonfluent speech is the hallmark feature of PNFA, and this has been attributed to impairments in syntactic processing, motor-speech planning, and executive functioning that also occur in these patients. Patients with PNFA have left inferior frontal atrophy.
Methods:
A large semi-structured speech sample and neuropsychological measures of language and executive functioning were examined in 16 patients with PNFA, 12 patients with behavioral-variant frontotemporal dementia (bvFTD), and 13 age-matched controls. Speech fluency was quantified as words per minute (WPM) in the semi-structured speech sample. Stepwise linear regression analyses were used to relate WPM to grammatic, motor-speech planning, and executive aspects of patient functioning. These measures were then related to cortical thickness in 8 patients with PNFA and 7 patients with bvFTD using structural MRI.
Results:
WPM was significantly reduced in patients with PNFA relative to controls and patients with bvFTD. Regression analyses revealed that only grammatic measures predicted WPM in PNFA, whereas executive measures were the only significant predictor of WPM in bvFTD. Cortical thinning was significant in PNFA relative to controls in left inferior frontal and anterior-superior temporal regions, and a regression analysis related this area to reduced WPM in PNFA. Significant cortical thinning associated with limited grammatic processing also was seen in the left inferior frontal-superior temporal region in PNFA, and this overlapped with the area of frontal-temporal thinning related to reduced WPM.
Conclusion:
Nonfluent speech in PNFA may be due in part to difficulty with grammatic processing associated with left inferior frontal and anterior-superior temporal disease.
GLOSSARY
- AOS
= apraxia of speech;
- aSTC
= anterior superior temporal cortex;
- bvFTD
= behavioral-variant frontotemporal dementia;
- CBD
= corticobasal degeneration;
- CBS
= corticobasal syndrome;
- FTLD
= frontotemporal lobar degeneration;
- IFC
= inferior frontal cortex;
- PNFA
= progressive nonfluent aphasia;
- PSP
= progressive supranuclear palsy;
- WPM
= words per minute.
Progressive nonfluent aphasia (PNFA) is one clinical presentation of frontotemporal lobar degeneration (FTLD).1,2 PNFA may be a clinical marker of tauopathies such as dementia with Pick bodies, corticobasal degeneration (CBD), and progressive supranuclear palsy (PSP),3,4 and thus it is critical to understand the characteristics of this condition. The hallmark feature of PNFA is reduced speech fluency.5,6 In this study, we investigated 3 potential sources of nonfluent speech attributed to PNFA, including grammatic simplifications and errors,1,5 a motor-related disorder associated with speech-sound errors known as apraxia of speech (AOS),3,7 and executive difficulty that limits mental search for words.8,9 An executive deficit also is seen in patients with FTLD with a disorder of personality and executive functioning known as behavioral-variant frontotemporal dementia (bvFTD).2,10 Since these patients also have reduced speech fluency,11 it is important to distinguish between reduced fluency in bvFTD and PNFA.
In PNFA, left inferior frontal cortex (IFC) atrophy is associated with grammatic processing,12 and an fMRI study shows reduced left IFC recruitment during grammatic processing.13 Patients with PNFA also have atrophy in left insula, an area associated with motor-speech errors,7 and in left dorsolateral prefrontal cortex, an area associated with mental search.14,15 In this study, we related fluency, grammar, executive functioning, and speech-sound production to quantitative measures of cortical thickness. We predicted that nonfluent speech would be related to limited grammatic processing in PNFA and reduced executive functioning in bvFTD. Moreover, in PNFA, we expected reduced WPM to be associated with IFC thinning, and that this would overlap with regions implicated in grammatic difficulty.
METHODS
Participants.
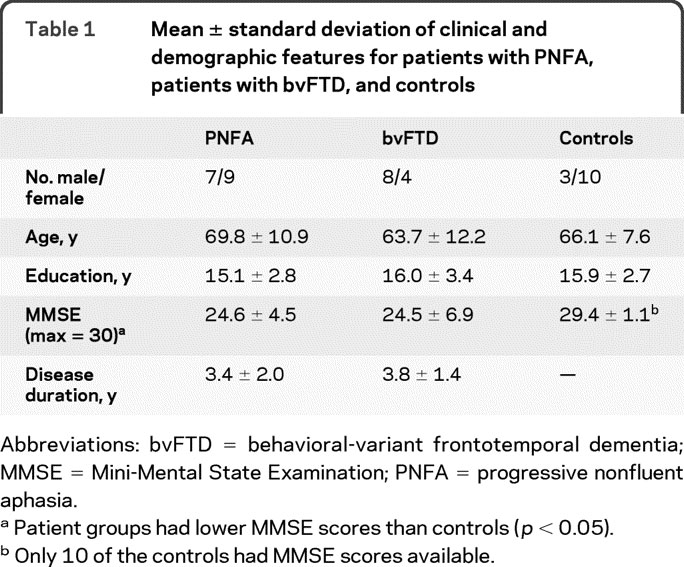
We studied 28 patients diagnosed with FTLD by an experienced neurologist (M.G.) according to modifications of published criteria16,17 in the Department of Neurology at the University of Pennsylvania. This included 16 consecutively examined patients with PNFA, including 3 patients with corticobasal syndrome (CBS) and an associated extrapyramidal disorder involving rigidity, myoclonus or dystonia, and ideomotor limb apraxia, and 12 patients with bvFTD. Characteristics of PNFA included effortful speech with grammatic and speech sound errors.1 Nine patients with PNFA had a motor-speech disorder, including 7 with dysarthria and 2 with AOS. Patients with bvFTD have a disorder of social comportment such as poor inhibitory control, apathy and poor motivation, obsessive behaviors, eating disorder, and other social abnormalities.2,10 We excluded patients with PNFA who also had a social disorder. We also excluded patients with bvFTD with aphasia. Exclusion criteria also included other neurologic conditions such as stroke, head trauma or hydrocephalus, other causes of dementia, medical conditions associated with cognitive difficulty, and primary psychiatric disorders. Demographic characteristics are summarized in table 1. We also excluded patients with visual-perceptual difficulty that might interfere with the ability to perceive the stimuli used to elicit the speech sample. Cognitive data in patients were compared to 13 healthy seniors matched for age and education who were recruited from the community. Structural MRI data were available for 8 patients with PNFA and 7 patients with bvFTD, and were compared to imaging in 31 healthy seniors matched for age and education.
Table 1 Mean ± standard deviation of clinical and demographic features for patients with PNFA, patients with bvFTD, and controls
Standard protocol approvals, registrations, and patient consents.
All patients participated in an informed consent procedure approved by the Institutional Review Board of the University of Pennsylvania.
Cognitive procedure.
To investigate the basis for nonfluent speech in PNFA, a narrative speech sample and a neuropsychological evaluation were obtained. Since pilot work showed that description of a single complex picture does not provide a speech sample reflecting the participant's full breadth of language production capability, a large semi-structured speech sample was elicited5,11 by asking participants to tell the story of the wordless children's picture book Frog, Where Are You?18 At the beginning of a session, each participant looked through the book's 24 pictures. Once familiar with the story, the participant was asked to narrate the story “as if telling it to a child.” Narratives were digitally recorded. Trained transcribers used the signal processing software Praat19 to help transcribe the narratives. All transcriptions were checked by 2 independent reviewers, and the transcripts were scored by 2 independent, trained judges. The narratives were analyzed for speech fluency, quantified by words per minute (WPM); motor-related aspects of speech planning or AOS, quantified as % speech-sound errors per total number of words; and grammatic aspects of speech, measured by the % complex grammatic structures per utterance. These variables, described in previous publications,5,11 are detailed in appendix e-1 on the Neurology® Web site at www.neurology.org.
All patients underwent neuropsychological testing within 116 (±91) days of the recording. Previous work has shown that significant decline occurs only over a longer period of time in patients with FTLD.20 Neuropsychological testing with executive measures included category naming fluency for animals, where patients named as many different animals as possible in 60 seconds; letter-guided category naming fluency, where patients named as many words as possible beginning with the letters F, A, and S; Stroop interference, where we quantified the amount of time needed to name the font color of 50 color names printed in a font of a different color; Trail-Making Test B, where we quantified the time needed to mark a line connecting an alternating series of letters and numbers in ascending order; and Reverse Digit Span, the repetition of a digit sequence in the order reversing its presentation. A summary measure of executive functioning was computed by averaging Z scores from executive measures. We also administered Pyramids and Palm Trees, a measure of semantic memory involving pictures and names of objects, and an abbreviated version of the Boston Naming Test.
Independent-samples t tests compared groups for reduced WPM and other aspects of speech. Stepwise linear regression analyses were used to identify predictors of reduced WPM using SPSS v12 (SPSS, Chicago, IL). We included each measure of grammatic, motor-speech, and executive aspects of patient functioning in the regressions. Another pair of regression analyses was computed by substituting the summary executive measure for the individual executive measures.
Imaging procedure.
High-resolution structural MRI scans were acquired by a Siemens Trio 3-T MRI scanner in 6 patients with PNFA and in all 7 patients with bvFTD. MRI scans were acquired by a GE Horizon Echospeed 1.5-T scanner in 2 patients with PNFA. Each study began with a sagittal T1-weighted image for patient position. Next, high-resolution T1-weighted 3-dimensional spoiled gradient echo images were acquired with repetition time = 1,620 msec, echo time = 3 msec, slice thickness 1.0 mm, flip angle 15°, matrix = 192 × 256, and in-plane resolution 0.9 × 0.9 mm. Cortical atrophy relative to controls was identified using voxel-based cortical thickness analyses.
We used PipeDream (https://sourceforge.net/projects/neuropipedream/) and Advanced Normalization Tools (ANTS, http://www.picsl.upenn.edu/ANTS/) to perform the most stable and reliable multivariate normalization and structure-specific processing currently available.21,22 PipeDream deforms each individual dataset into a standard local template space in a canonical stereotactic coordinate system. Core processing involves mapping T1 structural MRI to a population-specific, unbiased average-shape and average-appearance image derived from a representative population consisting of 25 healthy seniors and 25 patients with FTLD.23 The coordinate deformation is diffeomorphic—that is, smooth and invertible, symmetric so that it is not biased toward the reference space for computing the mappings, and topology-preserving to capture the large deformation necessary to aggregate images in a common space. These algorithms allow template-based priors to guide cortical segmentation and compute cortical thickness.24 Cortical thickness images were smoothed in SPM5 (http://www.fil.ion.ucl.ac.uk/spm/software/spm5) using a 3-mm full-width half-maximum Gaussian kernel to minimize individual gyral variations.
In SPM5, 2-sample t tests contrasted cortical thickness between each patient group and 31 healthy controls. An explicit mask defined by a gray matter prior probability map in SPM5 limited the analysis to voxel-wise comparisons within gray matter. The analysis included all clusters surviving a p < 0.0005 height threshold, 100 voxel extent criterion, and a cluster level criterion of p < 0.10 (familywise error corrected). SPM5 then performed a regression analysis relating reduced WPM to cortical thinning. Regression analyses also related the proportion of complex structures, executive, and speech-sound errors to cortical thickness. We interpreted these regressions only in areas of cortical thinning because it is only these areas that are abnormal in patients. To test the claim that each of these factors explains reduced WPM, explicit masking limited regression analyses to regions where reduced WPM was significantly related to cortical thinning, as established in the previous analysis. For each of these analyses, we used a peak voxel Z score ≥3.09 (equivalent to p < 0.001) and a 20-voxel extent.
RESULTS
Cognitive results.
Speech fluency, as measured by WPM, was significantly reduced in PNFA compared to controls and bvFTD. These findings are summarized in table 2. Representative speech samples are provided in appendix e-2. Speech samples in PNFA were longer in duration than those of controls and bvFTD, yet patients with PNFA produced fewer words than controls and patients with bvFTD. Table 2 also shows that patients with PNFA differed from controls on other measures of language expression. Significantly fewer complex grammatic structures/utterance were produced in PNFA relative to bvFTD and controls. While patients with PNFA produced the largest number of speech-sound errors, this did not differ significantly from controls or patients with bvFTD.
Table 2 Mean ± standard deviation of performance measures on speech production and cognition
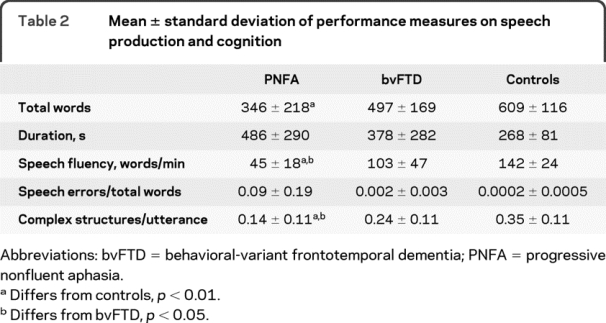
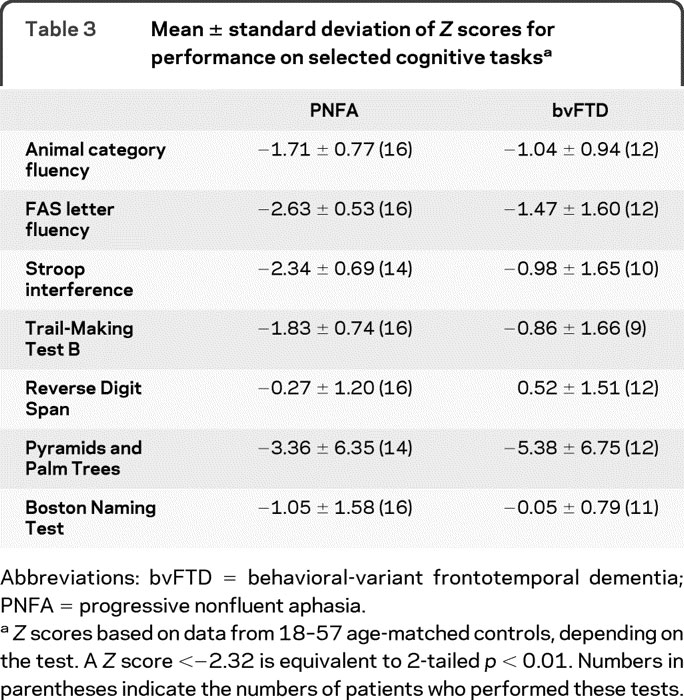
Neuropsychological measures are summarized in table 3. FAS and Stroop interference were impaired in PNFA relative to controls at the p < 0.01 level. Both patient groups were impaired on the Pyramids and Palm Trees test at the p < 0.01 level.
Table 3 Mean ± standard deviation of Z scores for performance on selected cognitive tasks
Stepwise linear regression analyses were used to relate measures of grammatic complexity, executive functioning, and speech-sound errors to WPM. The correlation matrix for all language and executive measures in each group of patients is provided in table e-1. For PNFA, only simplified grammatic structures predicted WPM (F1,15 = 7.64, p < 0.05), accounting for 35.3% of the variance. Category naming fluency was the only executive measure predicting WPM in bvFTD (F1,11 = 17.86, p < 0.005), accounting for 64.1% of the variance. The summary measure of executive functioning also was a predictor of WPM in bvFTD (F1,11 = 35.78, p < 0.005), accounting for 78.2% of the variance.
Imaging results.
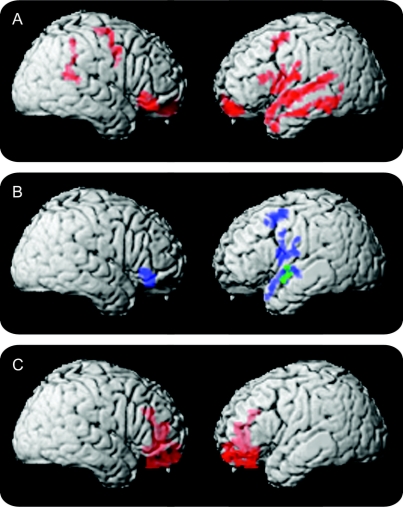
The figure and table 4 summarize the imaging results in PNFA. Panel A shows that atrophy involves peri-Sylvian areas in left IFC and adjacent anterior superior temporal cortex (aSTC). In panel B, reduced WPM in PNFA is related to extensive regions of IFC thinning, more prominently on the left than the right, as well as to adjacent regions of left aSTC. Areas of significant cortical thinning associated with limited grammatic complexity overlap areas related to reduced WPM in PNFA in left IFC and aSTC. Areas of significant cortical atrophy related to speech-sound errors or category naming fluency did not overlap with areas of cortical thinning related to WPM.
Figure Image analyses of patients with progressive nonfluent aphasia (PNFA) and behavioral-variant frontotemporal dementia (bvFTD)
(A) Significant cortical thinning in PNFA. (B) Regression analyses relating language features to cortical thinning (blue areas indicate regions where reduced WPM is related to PNFA atrophy; green areas indicate regions where the proportion of complex structures is related to atrophy). (C) Significant cortical thinning in bvFTD.
Table 4 Significant cortical thinning in patients with PNFA and bvFTD, and significant association of nonfluent speech (words per minute) and proportion of complex structures with cortical thinning
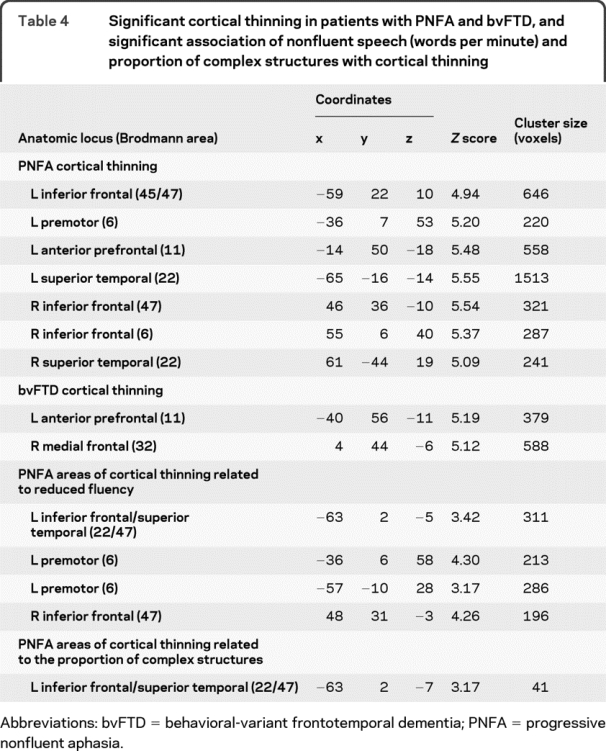
The figure, C, and table 4 summarize imaging results in bvFTD. Thinning in bvFTD is more anterior than in PNFA, and includes significant medial frontal thinning. Regression analyses did not reveal any relationship between cortical thinning and reduced WPM in bvFTD.
DISCUSSION
Patients with PNFA and bvFTD both exhibit reduced WPM relative to controls. Behavioral results suggest that different sources of impairment contribute to slowed speech in these 2 groups. Grammatic processing difficulty is most associated with reduced WPM in PNFA, while executive resource limitations play a role in reduced WPM in bvFTD. Imaging results relate nonfluent speech to left IFC and aSTC thinning in PNFA. Moreover, thinning related to grammatic limitations in left IFC and aSTC overlaps with the region of cortical thinning related to nonfluent speech. Impairments in executive functioning and motor-speech errors do not overlap with this region of cortical thinning in PNFA.
Speech in PNFA is slow and effortful.5,6,11,25 This is the hallmark characteristic of this subgroup of PPA. We observed significantly nonfluent speech in a large, semi-structured sample in PNFA. While we used WPM to index nonfluent speech, other factors also contribute to this speech pattern such as impaired prosody and the distribution of prolonged pauses, and future work should investigate these characteristics of nonfluent speech. Several factors are hypothesized to account for nonfluent speech in PNFA. These include impairments in grammatic processing, motor-speech planning, and executive functioning. While patients with PNFA were impaired in all of these factors, stepwise regression analysis revealed that reduced grammatic complexity was most predictive of reduced speech fluency. Previous work has shown limited grammatic expression and comprehension in PNFA.4,12,26 We examined small groups of patients, and our observations require confirmation with larger groups. Prior work with other patients with PPA has related semantic memory difficulty to nonfluent speech in semantic dementia,5 but additional work is needed to examine factors contributing to nonfluent speech in the logopenic variant of PPA. With these caveats in mind, our observations suggest that grammatically mediated deficits constructing sentences during speech expression contribute to nonfluent speech in PNFA.
We and others have observed frequent speech-sound errors in patients with PNFA.3,4,7,27 We observed speech errors more often in PNFA than bvFTD. While some observations have associated speech-sound errors with a disorder of motor-speech planning known as AOS,3,7 our quantitative analyses suggest that these errors are much more often due to a linguistic disruption of the phonologic processing system.27 Regardless of the basis for speech-sound errors in PNFA, a regression analysis in the present study revealed that reduced speech fluency is not related to speech-sound errors.
Patients with PNFA also produced significantly fewer words during a category naming fluency measure, illustrating an impairment in executive functioning that has been demonstrated previously.15,28 Deficits in executive functioning have been hypothesized to interfere with strategic planning and mental search in language, and therefore potentially contribute to reduced speech fluency.9 However, our regression analyses indicated that executive functioning does not contribute to reduced WPM in PNFA. Other factors may contribute to reduced fluency such as word-finding difficulty and narrative discourse limitations, and these should be investigated in future studies.
Previous neuroimaging studies have associated PNFA with disease in left IFC and adjacent regions of aSTC.4,26,29 Our observations are consistent with these findings, although our imaging observations must be interpreted cautiously until replicated with a larger group of patients. Converging evidence from fMRI studies of healthy adults also has related grammatically mediated speech and language processing to left IFC and aSTC.30–32 Furthermore, our neuroimaging results revealed an overlap between regions of cortical thinning related to nonfluent speech and the region of thinning related to grammatically simplified utterances in left IFC and aSTC. While this overlap does not necessarily provide a causal link between nonfluent speech and grammatic difficulty, our findings are consistent with prior work showing reduced left IFC activation in PNFA during processing of grammatically complex sentences.13 Moreover, overlapping left IFC and aSTC thinning for nonfluent speech and grammatic difficulty is consistent with our observation finding that difficulty producing syntactically complex structures contributes to nonfluent speech in PNFA. While prior work has related reduced category naming fluency to left frontal regions in PNFA,15 the neuroimaging results of the present study did not reveal an overlap between areas of thinning related to nonfluent speech and areas of thinning related to category naming fluency. We are unaware of prior work directly relating speech-sound errors to cortical atrophy in PNFA, although a study of stroke patients has associated AOS with left insula stroke.33 We did not find an area of cortical thinning related to speech errors in PNFA that overlapped with the left IFC and aSTC region associated with nonfluent speech. The absence of an overlap between the region of cortical thinning related to nonfluent speech and areas of cortical thinning related to category naming fluency and speech errors emphasizes the specificity of our observations relating nonfluent speech to grammatic simplification. Additional work is needed to confirm these findings in larger groups of patients.
Patients with bvFTD, while not aphasic, were observed to have reduced speech rate relative to controls. In addition, these patients produced significantly fewer words during category naming fluency. Behavioral results revealed that limitations in executive functioning are the only significant predictor of reduced speech fluency in bvFTD. One possibility is that executive resources facilitate narrative organization needed for fluent speech in a semi-structured speech sample, and that poor category naming fluency reflects executive resource limitations in bvFTD. Previous work has shown that patients with bvFTD have poor narrative organization that correlates with their limited executive resources.11 Another possibility is that limited category naming fluency reflects lexical retrieval difficulty during a semi-structured speech sample.
We observed significant bilateral anterior and medial frontal atrophy in bvFTD, consistent with previous work.10,14 We did not observe significant cortical thinning in left IFC and aSTC, thus differing from PNFA. Previous work has observed narrative speech difficulty in patients with bvFTD who also have right frontal and anterior temporal atrophy,11 although nonfluent speech was not directly related to cortical atrophy in bvFTD. Additional work is needed to establish the neuroanatomic basis for reduced fluency in bvFTD.
DISCLOSURE
D. Gunawardena reports no disclosures. Dr. Ash receives royalties from the publication of The Atlas of North American English: Phonetics, Phonology and Sound Change (Mouton de Gruyter, 2006) and has received research support from the NIH (AG17586 [research specialist], AG15116 [research specialist], NS44266 [research specialist], and NIH NS53488 [research specialist]). Dr. McMillan receives research support from the NIH (NICHHD HD060406 [PI]). Dr. Avants reports no disclosures. Dr. Gee serves as an Associate Editor for the Journal of Electronic Imaging, IEEE Transactions on Medical Imaging, and Medical Image Analysis and as Deputy Editor, Rapid Communication Section for Academic Radiology; and receives research support from the NIH (R01- NS065347 [PI], R01-DA022807 [PI], R01-EB006266 [PI], R03-EB009321 [PI], UL1-RR024134 [coinvestigator], R01-MH073529 [coinvestigator], P01-AG017586 [coinvestigator], and P50-NS053488 [coinvestigator]), the Children's Hospital of Philadelphia, and Howard Hughes Medical Institute. Dr. Grossman serves on a scientific advisory board for Allon Therapeutics Inc.; serves as Editor of Cognitive and Behavioral Neurology; serves as a consultant for Pfizer Inc., Forest Laboratories, Inc., and Allon Therapeutics Inc.; and receives research support from the NIH (AG17586 [PI], AG15116 [PI], NS44266 [PI], and NS53488 [PI]).
Supplementary Material
Address correspondence and reprint requests to Dr. Murray Grossman, Department of Neurology, 3 Gates, Hospital of the University of Pennsylvania, 3400 Spruce St., Philadelphia, PA 19104-4283 mgrossma@mail.med.upenn.edu
Editorial, page 582
See pages 595 and 603
Supplemental data at www.neurology.org
Study funding: Supported in part by the NIH (AG17586, AG15116, NS44266, NS53488).
Disclosure: Author disclosures are provided at the end of the article.
Received October 23, 2009. Accepted in final form February 22, 2010.
REFERENCES
- 1.Grossman M, Ash S. Primary progressive aphasia: a review. Neurocase 2004;10:3–18. [DOI] [PubMed] [Google Scholar]
- 2.Snowden JS, Neary D, Mann DM. Fronto-temporal Lobar Degeneration: Fronto-temporal Dementia, Progressive Aphasia, Semantic Dementia. New York: Churchill Livingstone; 1996. [Google Scholar]
- 3.Josephs KA, Duffy JR, Strand EA, et al. Clinicopathological and imaging correlates of progressive aphasia and apraxia of speech. Brain 2006;129:1385–1398. [DOI] [PMC free article] [PubMed] [Google Scholar]
- 4.Gorno-Tempini ML, Dronkers NF, Rankin KP, et al. Cognition and anatomy in three variants of primary progressive aphasia. Ann Neurol 2004;55:335–346. [DOI] [PMC free article] [PubMed] [Google Scholar]
- 5.Ash S, Moore P, Vesely L, et al. Non-fluent speech in frontotemporal lobar degeneration. J Neurolinguistics 2009;22:370–383. [DOI] [PMC free article] [PubMed] [Google Scholar]
- 6.Amici S, Ogar JM, Brambati SM, et al. Performance in specific language tasks correlates with regional volume changes in progressive aphasia. Cogn Behav Neurol 2007;20:203–211. [DOI] [PubMed] [Google Scholar]
- 7.Ogar JM, Dronkers N, Brambati SM, et al. Progressive nonfluent aphasia and its characteristic motor deficits. Alzheimer Dis Assoc Disord 2007;21:S23–S30. [DOI] [PubMed] [Google Scholar]
- 8.Libon DJ, Xie SX, Moore P, et al. Patterns of neuropsychological impairment in frontotemporal dementia. Neurology 2007;68:369–375. [DOI] [PubMed] [Google Scholar]
- 9.Weintraub S, Rubin NP, Mesulam MM. Primary progressive aphasia: longitudinal course, neuropsychological profile, and language features. Arch Neurol 1990;47:1329–1335. [DOI] [PubMed] [Google Scholar]
- 10.Rosen HJ, Allison SC, Schauer GF, et al. Neuroanatomical correlates of behavioural disorders in dementia. Brain 2005;128:2612–2625. [DOI] [PMC free article] [PubMed] [Google Scholar]
- 11.Ash S, Moore P, Antani S, et al. Trying to tell a tale: discourse impairments in progressive aphasia and frontotemporal dementia. Neurology 2006;66:1405–1413. [DOI] [PubMed] [Google Scholar]
- 12.Peelle JE, Troiani V, Gee J, et al. Sentence comprehension and voxel-based morphometry in progressive nonfluent aphasia, semantic dementia, and nonaphasic frontotemporal dementia. J Neurolinguistics 2008;21:418–432. [DOI] [PMC free article] [PubMed] [Google Scholar]
- 13.Cooke A, DeVita C, Gee JC, et al. Neural basis for sentence comprehension deficits in frontotemporal dementia. Brain Lang 2003;85:211–221. [DOI] [PubMed] [Google Scholar]
- 14.Grossman M, McMillan C, Moore P, et al. What's in a name? Voxel-based morphometric analyses of MRI and naming difficult in Alzheimer's disease, frontotemporal dementia, and corticobasal degeneration. Brain 2004;127:628–649. [DOI] [PubMed] [Google Scholar]
- 15.Libon DJ, McMillan C, Gunawardena D, et al. Neurocognitive contributions to verbal fluency deficits in frontotemporal lobar degeneration. Neurology 2009;73:535–542. [DOI] [PMC free article] [PubMed] [Google Scholar]
- 16.McKhann G, Trojanowski JQ, Grossman M, et al. Clinical and pathological diagnosis of frontotemporal dementia: report of a work group on frontotemporal dementia and Pick's disease. Arch Neurol 2001;58:1803–1809. [DOI] [PubMed] [Google Scholar]
- 17.Neary D, Snowden JS, Gustafson L, et al. Frontotemporal lobar degeneration: a consensus on clinical diagnostic criteria. Neurology 1998;51:1546–1554. [DOI] [PubMed] [Google Scholar]
- 18.Mayer M. Frog, Where Are You? New York: Penguin Books; 1969. [Google Scholar]
- 19.Boersma P, Weenink D, Praat V. 4.3.27. Institute of Phonetic Sciences, University of Amsterdam, 1992–2000.
- 20.Libon DJ, Xie S, Wang X, et al. Neuropsychological decline in frontotemporal lobar degeneration: a longitudinal analysis. Neuropsychology 2008;23:337–346. [DOI] [PMC free article] [PubMed] [Google Scholar]
- 21.Avants BB, Epstein CL, Grossman M, Gee J. Symmetric diffeomorphic image registration with cross-correlation: evaluating automated labeling of elderly and neurodegenerative brain. Med Image Anal 2008;12:26–41. [DOI] [PMC free article] [PubMed] [Google Scholar]
- 22.Klein A, Andersson J, Ardekani BA, et al. Evaluation of 14 nonlinear deformation algorithms applied to human brain MRI registration. Neuroimage 2009;46:786–802. [DOI] [PMC free article] [PubMed] [Google Scholar]
- 23.Kim J, Avants B, Patel S, et al. Structural consequences of diffuse traumatic brain injury: a large deformation tensor-based morphometry study. 2008;39:1014–1026. [DOI] [PMC free article] [PubMed]
- 24.Das SR, Avants BB, Grossman M, Gee J. Registration based cortical thickness measurement. Neuroimage 2009;45:867–879. [DOI] [PMC free article] [PubMed] [Google Scholar]
- 25.Graham NL, Patterson K, Hodges JR. When more yields less: speaking and writing deficits in nonfluent progressive aphasia. Neurocase 2004;10:141–155. [DOI] [PubMed] [Google Scholar]
- 26.Grossman M, Mickanin J, Onishi K, et al. Progressive non-fluent aphasia: language, cognitive and PET measures contrasted with probable Alzheimer's disease. J Cogn Neurosci 1996;8:135–154. [DOI] [PubMed] [Google Scholar]
- 27.Ash S, McMillan C, Gunawardena D, et al. Speech errors in progressive non-fluent aphasia. Brain Lang (in press 2010). [DOI] [PMC free article] [PubMed]
- 28.Kramer JH, Jurik J, Sha SJ. Distinctive neuropsychological patterns of frontotemporal dementia, semantic dementia, and Alzheimer's Disease. Cogn Behav Neurol 2003;16:211–218. [DOI] [PubMed] [Google Scholar]
- 29.Nestor PJ, Graham NL, Fryer TD, et al. Progressive non-fluent aphasia is associated with hypometabolism centered on the left anterior insula. Brain 2003;126:2406–2418. [DOI] [PubMed] [Google Scholar]
- 30.Troiani V, Fernandez-Seara MA, Wang Z, et al. Narrative speech production: an fMRI study using continuous arterial spin labeling. Neuroimage 2008;40:932–939. [DOI] [PMC free article] [PubMed] [Google Scholar]
- 31.Ferstl EC, Neumann J, Bogler C, Cramon DY. The extended language network: a meta-analysis of neuroimaging studies on text comprehension. Hum Brain Mapp 2008;29:581–593. [DOI] [PMC free article] [PubMed] [Google Scholar]
- 32.Xu J, Kemeny S, Park G, et al. Language in context: emergent features of word, sentence, and narrative comprehension. Neuroimage 2005;25:1002–1015. [DOI] [PubMed] [Google Scholar]
- 33.Dronkers NF. A new brain region for coordinating speech articulation. Nature 1996;384:159–161. [DOI] [PubMed] [Google Scholar]
Associated Data
This section collects any data citations, data availability statements, or supplementary materials included in this article.


