Abstract
Mammalian NOS is a homodimeric flavo-hemoprotein that catalyzes the oxidation of l-arginine to NO. Regulation of NO biosynthesis by NOS is primarily through control of interdomain electron transfer (IET) processes in NOS catalysis. The IET from the FMN to heme domains is essential in the delivery of electrons required for O2 activation in the heme domain and the subsequent NO synthesis by NOS. The NOS output state for NO production is an IET-competent complex of the FMN-binding domain and heme domain, and thereby it facilitates the IET from the FMN to the catalytic heme site. The structure of the functional output state has not yet been determined. In the absence of crystal structure data for NOS holoenzyme, it is important to experimentally determine the Fe⋯FMN distance to provide a key calibration for computational docking studies and for the IET kinetics studies. Here we used the relaxation-induced dipolar modulation enhancement (RIDME) technique to measure the electron spin echo envelope modulation caused by the dipole interactions between paramagnetic FMN and heme iron centers in the [Fe(III)][FMNH•] form of a human iNOS oxygenase/FMN bi-domain construct. The FMNH•⋯Fe distance has been directly determined from the RIDME spectrum. This distance (18.8 ± 0.1 Å) is in excellent agreement with the IET rate constant measured by laser flash photolysis.
Introduction
Nitric oxide synthase (NOS) is the enzyme responsible for the oxidation of l-arginine (Arg) to NO, a key signaling molecule for vasodilation and neurotransmission at low concentrations and a defensive cytotoxin at higher concentrations.1,2 NO’s availability is tightly regulated at the synthesis level by NOS. Aberrant NO synthesis by NOS is associated with an increasing number of human pathologies, including stroke, hypertension and cancer.2,3 Selective NOS modulators are required for therapeutic intervention because of the ubiquitous nature of NO in mammalian physiology, and the fact that multiple NOS isoforms are each capable of producing NO in vivo. Until recently, advances in understanding the structural and functional mechanisms of this enzyme class led to identification of agents that are designed to selectively modulate NOS.4–6 However, clinical agents that directly and selectively modulate NOS isoform activity remain elusive. Clearly, molecular mechanisms of NOS regulation, once fully understood, are key targets for development of selective new pharmaceuticals for treating a wide range of NOS-mediated diseases that currently lack effective treatments.
Mammalian NOS is a homodimeric flavo-hemoprotein that catalyzes the oxidation of l-Arg to NO and l-citrulline with NADPH and O2 as co-substrates.7 Each subunit contains a C-terminal electron-supplying reductase domain with binding sites for NADPH (the electron source), flavin adenine dinucleotide (FAD) and flavin mononucleotide (FMN), and an N-terminal catalytic heme-containing oxygenase domain. The substrate, l-Arg, and a cofactor, (6R)-5,6,7,8 tetrahydrobiopterin (H4B), both bind near the heme center in the oxygenase domain. The oxygenase and reductase domains are connected through a CaM-binding region, which is irreversibly bound to CaM in iNOS (inducible NOS) at all physiological Ca2+ concentrations, while reversible CaM binding to the region of nNOS and eNOS (neuronal and endothelial NOS) requires an increase in intracellular Ca2+ concentration.7 The major differences between the CaM-regulated isoforms of nNOS/eNOS and the Ca2+ insensitive isoform iNOS are intrinsic regulatory elements,7 including an unique autoregulatory insert within the FMN domain of eNOS/nNOS 8 and the C-terminal tail.9
The three NOS isoforms, iNOS, eNOS and nNOS, achieve their biological functions via an intricate regulation of interdomain electron transfer (IET) processes.7 These IET processes are key steps in NO synthesis through coupling reactions between the flavins and heme domains. Uncoupled or partially coupled NOS results in synthesis of reactive oxygen species such as superoxide, hydrogen peroxide, and peroxynitrite.10 It is of current interest to investigate the thermodynamics11–16 and kinetics17–22 of the IET processes in NOS, as well as structures of IET-relevant NOS intermediates by advanced spectroscopy techniques.23,24 In particular, it is important to elucidate control mechanisms for the IET process from FMN to heme,17,25,26 which is essential in the delivery of electrons required for O2 activation in the catalytic heme domain and the subsequent NO synthesis.
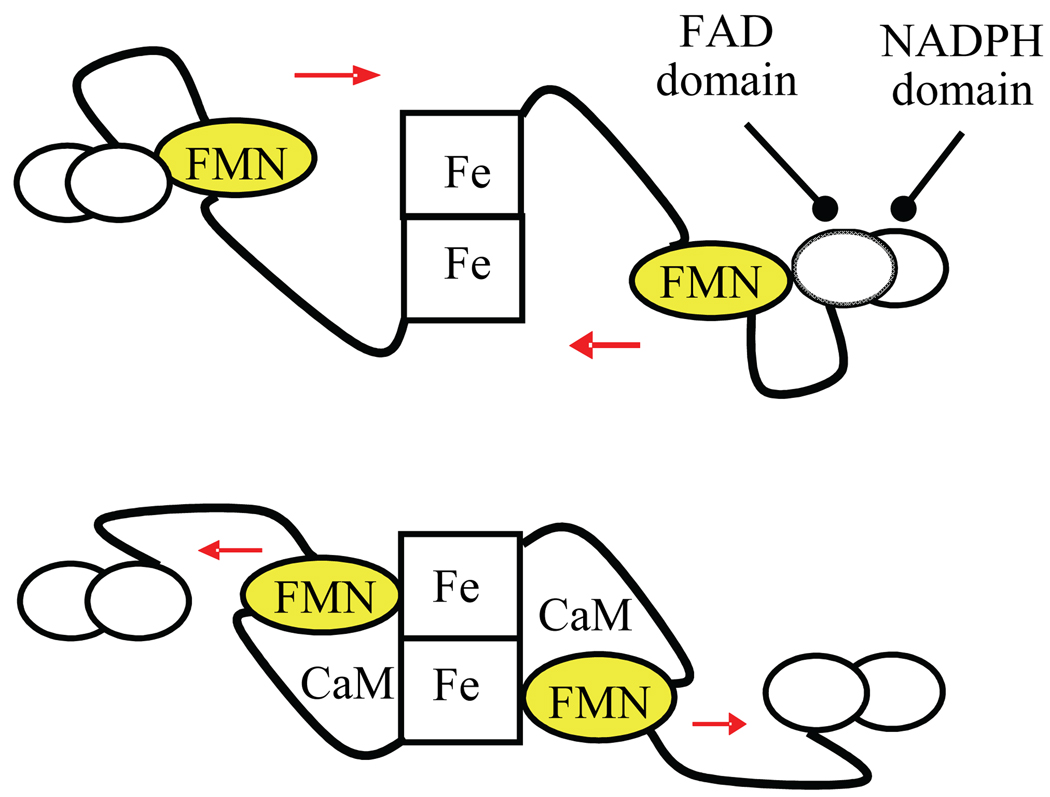
An “FMN-domain tethered shuttle” model (Figure 1) was recently proposed,27,28 and strongly supported by IET kinetic studies17,28–36 and low temperature MCD data.37 This model involves the swinging of the FMN domain from its original electron-accepting (input) state to a new electron-donating (output) state. This molecular rearrangement facilitates efficient IET between the FMN and the catalytic heme in the oxygenase domain. The structure of the functional output state has not yet been determined. To favor observation of the output state, bi-domain NOS oxyFMN constructs, in which only the oxygenase and FMN domains, along with the CaM binding region, are expressed, were originally designed by Ghosh and Salerno.38 Rat nNOS oxyFMN protein was also constructed in other laboratories.32,39 Biochemical, kinetic and spectroscopic results have shown that these homologous dimeric oxyFMN constructs are well-validated models of the output state for NO production.28,31,37,38
Figure 1.
Tethered shuttle model: FMN-binding domain shuttles between the FAD domain and heme-containing oxygenase domain. Top: input state; bottom: putative output state. CaM binding unlocks the input state, thereby enabling the shuttling of the FMN domain between the two enzyme states. CaM is also required for proper alignment of the FMN and heme domains in iNOS.
Currently, only the oxygenase and reductase domain crystal structures are available, while the structures of the NOS holoenzyme remain elusive. Since 1998, crystal structures have been reported for the truncated NOS constructs, including the oxygenase domains of each of the NOS isoforms,40–42 rat nNOS reductase constructs,43,44 CaM bound human iNOS FMN domain,45 and CaM bound to peptides corresponding to the CaM-binding region in nNOS (PDB 2O60) and human eNOS46. Trying to piece together the heme and reductase domain structures by computational docking studies may provide some insights,32,45 but alternative models will be difficult to distinguish when compared to the favored ones.Therefore, it is important to identify a method that can provide distance constraints within the FMN–heme IET complex. The FMN⋯Fe distance information is also important for better understanding the FMN–heme IET mechanism, because the distance between redox centers is critical for controlling electron transfer processes in proteins.47
The FMN⋯Fe distance can be evaluated from magnetic dipolar interactions determined by electron paramagnetic resonance (EPR). Continuous wave (CW) EPR was used previously to detect the magnetic relaxation enhancement of FMNH• at cryogenic temperatures due to the dipole interaction with the heme iron center,48,49 but no concrete distance estimates were made. In another report50 neither relaxation enhancement nor EPR line broadening were observed for FMNH•, and it was proposed that the Fe⋯FMN distance should be greater than 15 Å. Unlike CW EPR, the pulsed EPR techniques of electron-electron double resonance (ELDOR), double-quantum coherence (DQC), selective hole-burning and relaxation-induced dipolar modulation enhancement (RIDME) have sufficiently high spectral resolution to measure the dipole interactions directly. These techniques have been recently applied to measure distances between paramagnetic centers in proteins in general and in electron transfer protein systems in particular.51–56 In this study, we performed a RIDME experiment57,58 on the [Fe(III)][FMNH•] form of a human iNOS oxyFMN construct. To make the heme iron center readily observable by pulsed EPR, we chose to convert it to the low-spin (S = 1/2) state (rather than the high-spin (S = 5/2) state) by adding imidazole that coordinates to the heme iron. Dipolar modulation of the electron spin echo (ESE) signal of FMNH• induced by the longitudinal relaxation of the heme iron center was detected and analyzed, yielding a FMNH•⋯Fe distance of 18.8 ± 0.1 Å.
Experimental Section
Preparation of EPR sample of NOS
Human iNOS oxyFMN construct was expressed and purified as described elsewhere.29 For the EPR experiments in this work, the heme was converted to exclusively low-spin form by adding imidazole that binds directly to the heme iron. The [Fe(III)][FMNH•] form of the imidazole-bound iNOS was prepared by titration with dithionite. Briefly, the iNOS sample was degassed with argon, and titrated to the [Fe(III)][FMNH•] form by adding certain volumes of fresh buffered dithionite solution under anaerobic conditions. The titration was followed by UV-vis spectra (Figure S1a in Supporting Information). For the pulsed EPR sample, the total [iNOS] was 324 µM, and 42% ethylene glycol was added as a glassing agent; buffer: 100 mM bis-Tris-propane, 200 mM NaCl, 3 mM imidazole, pH 7.6. Formation of the [Fe(III)][FMNH•] form in high yield was confirmed by UV-vis and CW EPR spectra (Figures S1b and S2, respectively).
Pulsed EPR spectroscopy
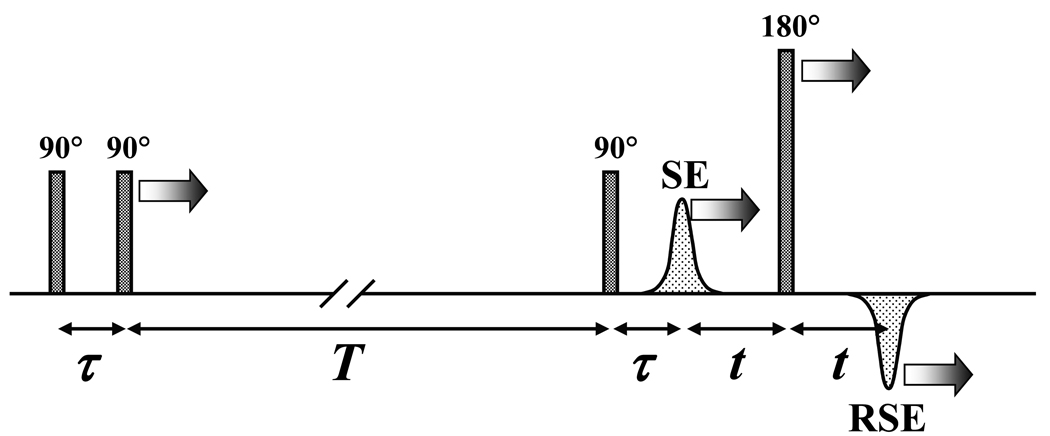
The pulsed EPR experiments were performed on a homebuilt Ka-band (26–40 GHz) pulsed EPR spectrometer59 at the microwave (mw) frequency of 29.454 GHz. The Ka band was chosen for our experiments in order to improve sensitivity compared to the lower-frequency mw bands. The refocused stimulated ESE pulse sequence used for RIDME measurements is shown in Figure 2. The parameters of specific experiments are described in the figure caption. The measurement temperatures were 15 K and 25 K.
Figure 2.
Refocused stimulated ESE pulse sequence used for RIDME measurements. The nominal flip angles of the mw pulses are indicated. The labels “SE” and “RSE” indicate the stimulated ESE and refocused stimulated ESE signals, respectively. The arrows show the mw pulses and ESE signals whose positions are varied during the experiment. In RIDME experiment, only time interval τ is varied, while T and t are kept constant. The echo signal of interest is the refocused stimulated ESE (“RSE”).
Docking of the heme and FMN domains of iNOS
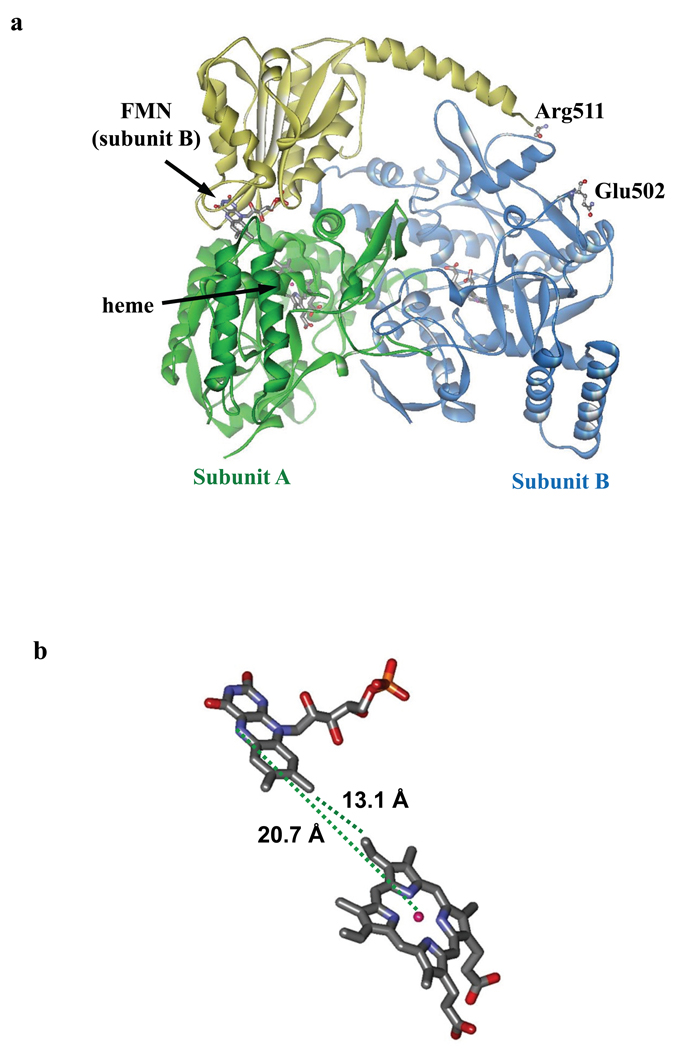
ZDOCK60 was employed to dock crystal structures of human iNOS oxygenase domain (pdb 1NSI) and a complex between Ca2+/CaM and human iNOS FMN domain, including the CaM-binding region (pdb 3HR4). Glu546 (FMN domain) was included as a required residue in the contact area because spectroscopic studies have identified this residue as being involved in the interaction with the oxygenase domain in human iNOS,37 and the equivalent residue in rat nNOS FMN domain (E762) has been shown to be important for the FMN-heme electron transfer and nNOS activity.61 Arg203 (oxygenase domain) was also at the interface because it is near the corresponding residue (Asn208) of rat nNOS Lys423 (that is crucial for nNOS activity62), while another nearby Arg215 was not included because it is on the other side of the protein surface containing Asn208. An acceptable ZDOCK solution should satisfy the following two structural constraints. First, the distance between FMN N5 and heme iron should be close to 18.8 Å, as determined by RIDME in this study. Second, the FMN domain should dock to one subunit of the oxygenase domain (A; Figure 9), while positioning the Arg511 residue (CaM-binding region) at a distance of < 25 Å from Glu502 of the other oxygenase domain subunit (B; Figure 9). The latter requirement is based on the facts that the FMN–heme IET is inter-subunit,22 and the residues E502 and R511 in the holoenzyme are separated by a 9-amino acid fragment.63 The residues that covalently link Glu502 and Arg511 are missing from the crystal structures available. When the CaM molecule was included in the input pdb file of the iNOS FMN domain (3HR4), ZDOCK didn’t produce any satisfactory solutions. The CaM molecule was then removed from the pdb file to obtain ZDOCK solutions that meet the two restrictions described above. The ZDOCK score, Fe⋯N5 distance, and R511⋯E502 distance of the top nine solutions are listed in Table S1; the sixth model was selected because it meets all the requirements above. No further refinement of the docked structure was attempted.
Figure 9.
(a) A ZDOCK model of a complex between the human iNOS oxygenase and FMN domains satisfying the structural constraints described in the text. This model was selected from the ZDOCK solutions listed in Table S1. The FMN and heme cofactors are shown in sticks. Note that the FMN domain (yellow) docks to oxygenase subunit A (green), and is covalently connected to the other oxygenase subunit B (blue) through the residues R511 (CaM-binding region) and E502 (oxygenase subunit B); these two residues are labeled and shown in balls and sticks. The arrangement of the domains meets the major constraint that the FMN-heme IET should be inter-subunit.22 The cofactors, between which the distance is measured (FMN of subunit B and heme of subunit A), are indicated by arrows. (b) Stick representation of the heme and FMN cofactors in the complex showing their distances. The graph was created using Discovery Studio Visualizer 2.0.
Results
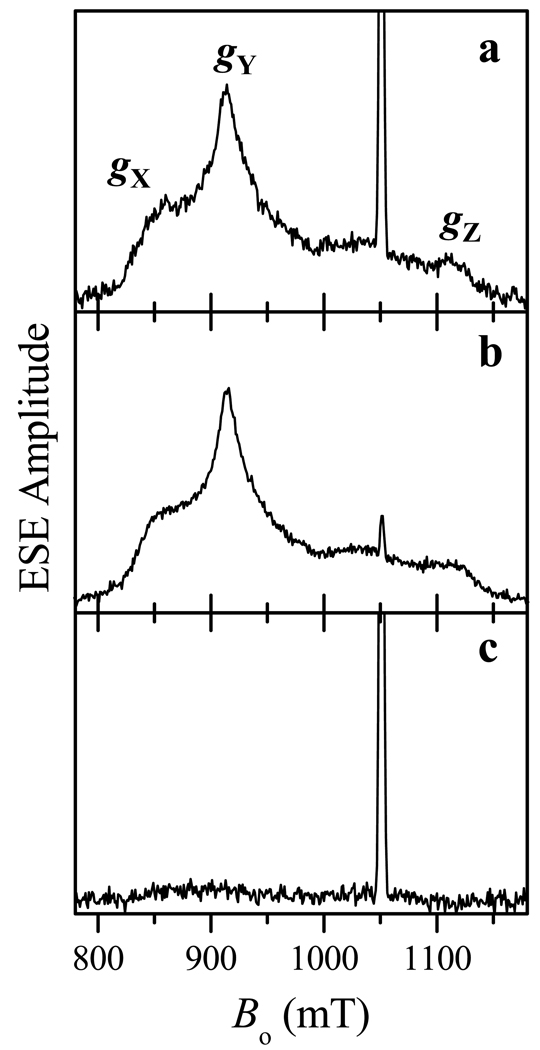
Figure 3 shows the field-sweep spectra of iNOS oxyFMN recorded at different temperatures and repetition rates using the refocused stimulated ESE pulse sequence (Figure 2) that was also used for the distance measurements (see below). The broad low-amplitude signal in Figures 3a and 3b has the principal g-values (gX, gY, gZ) = (2.52, 2.30, 1.85) and originates from the ferric heme center coordinated by imidazole and cysteine. The strong narrow signal at g ≈ 2.003 belongs to the neutral FMNH• radical.
Figure 3.
Refocused stimulated ESE field sweeps of low-spin Fe(III)/FMNH• form of imidazole-bound human iNOS oxyFMN recorded at the temperatures of 15 K (a, b) and 25 K (c), and the repetition rates of 10 Hz (a, c) and 1000 Hz (b). The convention of this work for correspondence between the heme iron principal g-values and g-frame axes (X,Y,Z) is indicated in panel a. Other experimental conditions: mw frequency, 29.454 GHz; mw pulses, 9, 9, 9, and 15 ns; τ = 20 ns; T = 20 µs; t = 200 ns.
The width of the Ka band EPR spectrum of heme iron is about 300 mT. Such a large linewidth precludes a meaningful use of ELDOR for distance measurements between the heme iron and FMNH•. In a pulsed ELDOR experiment on the NOS sample, one would normally observe the ESE signal from Fe(III), while flipping the spins of FMNH• by the pumping mw pulse. However, for any resonance position of the observation pulse sequence with respect to the EPR spectrum of Fe(III), only a limited subset of orientations of the heme centers (and therefore a limited subset of orientations of the radius vector R joining Fe(III) and FMNH•) will contribute to the ESE signal. This orientational selectivity requires multiple pulsed ELDOR experiments to be performed, with the observation frequencies sampling various positions across the EPR spectrum of Fe(III) signal. The required offsets between the pumping and observation mw frequencies can be up to 6 GHz, and both frequencies cannot be simultaneously accommodated within a single mode of a mw resonator.
Therefore, in this work we used an alternative distance measurement technique, RIDME; the pulse sequence is shown in Figure 2. Unlike pulsed ELDOR, it only uses mw pulses to observe one of the paramagnetic centers forming a pair (usually referred to as “spin A”). The other center, “spin B”, is not manipulated by the mw pulses, but is allowed to flip due to the natural process of spin-lattice relaxation (during the time interval T). The relaxation-induced reorientation of spin B changes the local magnetic field at the position of spin A by D/gAβ (where D is the dipole interaction energy, gA is the g-factor of spin A, and β is the Bohr magneton) and results in oscillatory dependence of the ESE signal of spin A as a function of the time interval τ. The oscillation frequency equals to D (as is customary in pulsed EPR, we are not making a distinction between energy and frequency units). This oscillatory dependence is often called the dipolar electron spin echo envelope modulation (ESEEM), and it is superimposed on the ESE signal decay (as a function of τ) along with the ESEEM caused by the interaction of the unpaired electron with nearby magnetic nuclei.
An efficient RIDME experiment requires the spin-lattice relaxation time of spin B to be much shorter than that of spin A (T1A ≫ T1B). This requirement is usually satisfied for a pair consisting of an organic radical (slowly relaxing spin A) and a transition metal ion center (fast-relaxing spin B). For the NOS system at hand, the longitudinal relaxation of FMNH• is orders of magnitude slower than that of Fe(III) heme center. Therefore, we can designate FMNH• as spin A and the ferric heme center as spin B.
In order to separate the dipolar ESEEM from other sources of ESEEM, two experiments have to be performed. The first experiment is performed at the measurement temperature Tlow selected in such a way as to possibly minimize the flip probability for spin B during the time interval T of the RIDME pulse sequence. The second experiment is performed at the temperature Thigh that maximizes the flip probability for spin B (the asymptotic probability of 50% is reached when the relaxation is complete).The ESE signal containing pure dipolar ESEEM is then obtained as a quotient of the ESE signals recorded at Thigh and Tlow.
The general requirements for selecting the measurement temperatures and the relaxation time interval, T, are as follows: (1) As a rule, T should be kept as short as possible in order to minimize the spectral diffusion effects, but still much longer than the maximal interval τ, τmax, so that the longitudinal relaxation of spin B during τ could be neglected; (2) the temperature Tlow should be as low as possible in order to minimize the relaxation of spin B during the time interval T, but still high enough for the slow-relaxing spin A to be observable at reasonable repetition rates of, at least, 5 – 10 Hz; and (3) the temperature Thigh should be sufficiently high to provide for possibly complete relaxation of spin B during the time interval T, but still low enough to satisfy the condition of T1B ≫ τmax.
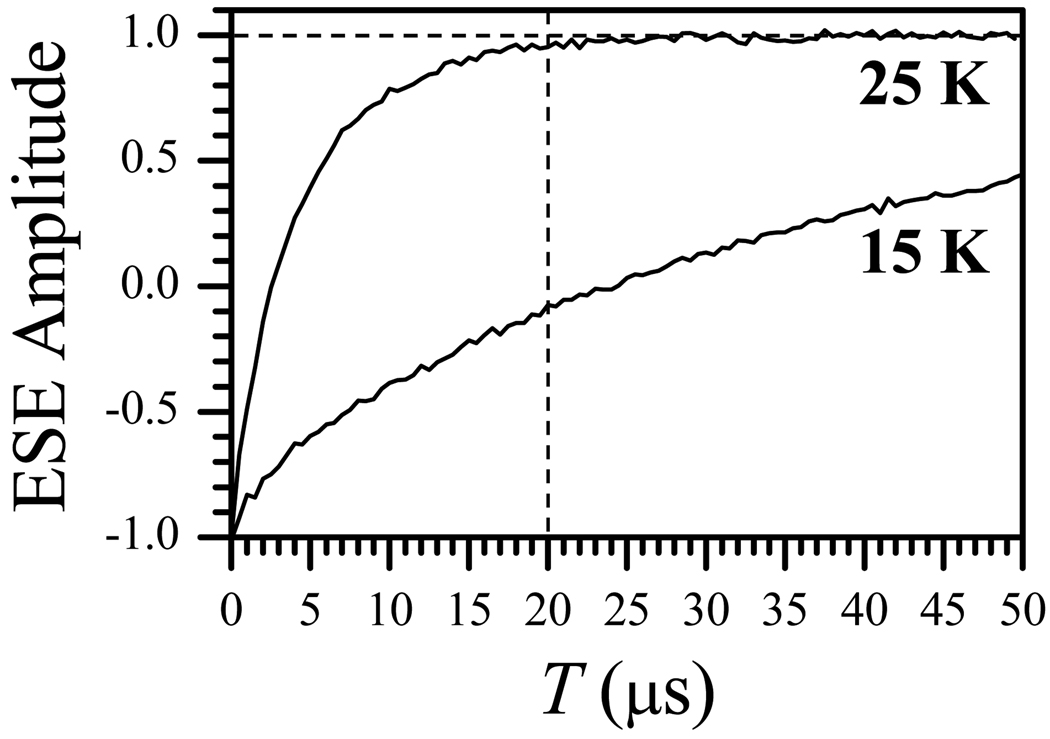
In order to select the appropriate Thigh and Tlow for our RIDME experiments, the longitudinal relaxation of the Fe(III) center was measured at different temperatures using the inversion recovery technique. Figure 4 shows the results of inversion recovery experiments for Fe(III) center at the temperatures of 15 K and 25 K. Note that for T = 20 µs, the relaxation at 25 K is practically complete, while at 15 K only about 20% of Fe(III) spins have flipped. At temperatures lower than 15 K, the flip probability for Fe(III) was even smaller (e.g., ~ 5% at 10 K), but a strong saturation of the FMNH• ESE signal required the use of very low repetition rates (~ 1 Hz), which made the RIDME measurements at such low temperatures impracticable. Therefore, we have designated the following conditions for our RIDME measurements: Thigh = 25 K, Tlow = 15 K and the relaxation time interval T = 20 µs.
Figure 4.
Inversion recovery traces for the Fe(III) heme center recorded at the temperatures of 15 K and 25 K. Other experimental conditions: mw frequency, 29.454 GHz; magnetic field, Bo = 914.8 mT (gY); inversion mw pulse, 15 ns; observation mw pulses, 20 ns and 40 ns. The vertical dashed line shows the relaxation time interval T = 20 µs used in the RIDME measurements.
The two measurements (one at Thigh and one at Tlow) described above represent a formal minimum that pertains to a situation when the EPR spectra of spins A and B do not overlap. In our case, however, the EPR signal of FMNH• overlaps with that of Fe(III) heme center (see Figure 3). Therefore, the ESE signal detected at the temperature Tlow at the resonance position of FMNH• is also contributed to by the ESE signal of Fe(III). At Thigh no Fe(III) contribution exists because at T = 20 µs the longitudinal relaxation of Fe(III) reduces its refocused stimulated ESE signal virtually to zero (see Figure 3c).
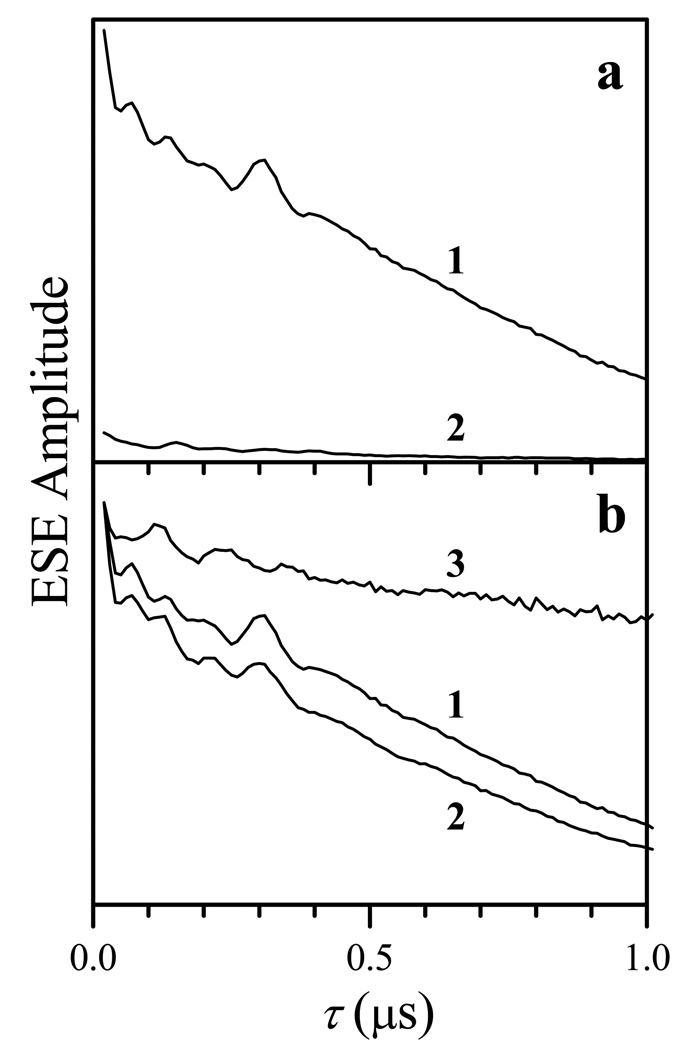
In order to obtain the pure ESE signal of FMNH• at Tlow, one can use the dramatic difference in the longitudinal relaxation rates of Fe(III) and FMNH•. In fact, the ESE signal of Fe(III) at 15 K has the same amplitude at the repetition rates of several Hz and 1000 Hz (Figures 3a and 3b). On the other hand, the ESE signal of FMNH• rapidly saturates, and at 1000 Hz becomes practically unobservable (Figure 3b). Therefore, in order to separate the FMNH• ESEEM from the contribution of the Fe(III) signal, the refocused stimulated ESEEM traces at Tlow were collected at the repetition rates of 10 Hz and 1000 Hz (Figure 5a), and then the 1000 Hz trace was subtracted from the 10 Hz one (trace 1, Figure 5b).
Figure 5.
(a) RIDME traces recorded at 15 K, Bo = 1050.9 mT (the resonance position of FMNH•), at the repetition rates of 10 Hz (trace 1, the ESE signal is mostly contributed to by FMNH•) and 1000 Hz (trace 2,the ESE signal is mostly contributed to by Fe(III)). Trace 1 of panel b is the difference of RIDME traces 1 and 2 of panel a, and it corresponds to FMNH• contributions only. Trace 2 of panel b is the experimental RIDME trace recorded at 25 K, Bo = 1050.9 mT, and the repetition rate of 10 Hz. Trace 3 of panel b is the quotient of traces 2 and 1 in the same panel; the ESEEM observed in this trace is from the magnetic dipole interaction between Fe(III) and FMNH•. Other experimental conditions: mw frequency, 29.454 GHz; mw pulses, 9, 9, 9, and 15 ns; starting τ = 20 ns; T = 20 µs; t = 200 ns.
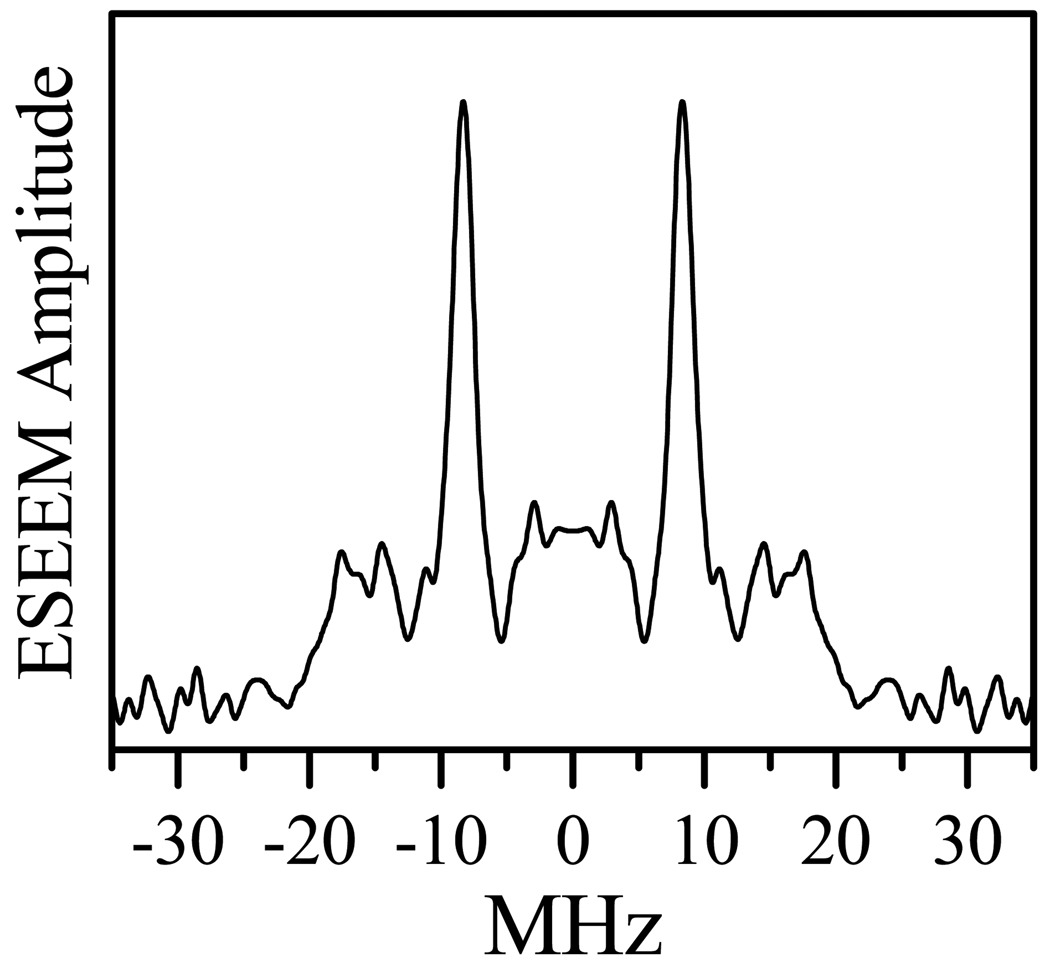
Dividing the trace recorded at Thigh (trace 2 in Figure 5b) by the difference trace obtained at Tlow (trace 1 in Figure 5b) results in the pure dipolar ESEEM (trace 3 in Figure 5b). By subtracting the non-oscillating background and performing a cosine Fourier transformation (FT), we obtain the spectrum of the dipolar and, possibly, exchange interactions between FMNH• and the ferric heme center (Figure 6). The shape of this spectrum resembles the Pake doublet, with the peaks corresponding to the effective dipolar couplings |D⊥| ≈ 8.3 MHz (correspond to R ⊥ Bo) and the shoulders corresponding to the couplings |D∥| ≈ 19 MHz (correspond to R ∥ Bo). The RIDME spectrum of Figure 6 is analyzed below assuming the exchange interaction constant to be zero (J = 0). The validity of such an approximation is evaluated in the Discussion section.
Figure 6.
Cosine FT of the dipolar ESEEM spectrum shown in the quotient RIDME trace (trace 3 of Figure 5b).
If the g-factors of FMNH• and heme iron forming a pair were isotropic, the ratio |D∥/D⊥| = 2 would be observed. The g-factor of Fe(III), however, is noticeably anisotropic (see Figure 3), which results in orientation-dependent rescaling of the dipolar interaction as compared with the case of isotropic g-factors. The dipole interaction in systems with anisotropic g-factor(s) was described in detail elsewhere.64–66 For the spectroscopic situation of this work, the dipole interaction can be written as:
| (1) |
where X, Y, and Z are the principal axes of spin B (i.e., heme iron) g-frame (see Figure 3a for the assignment of the axes to the EPR turning points), Do = gAgBβ2/hR3, gA is the g-factor of spin A (i.e., FMNH•), β is the Bohr magneton, h is the Planck constant, gBj are the principal components of the g-tensor of spin B, gB = [(gBXbX)2 + (gBYbY)2 + (gBZbZ)2]1/2, bk and rk are the projections of, respectively, Bo and R on axes X, Y, and Z. Equation 1 can be conveniently rewritten as:
| (2) |
where are the components of a reference dipole interaction tensor defined for two spins with isotropic g = 2. The last part of Eq. 2 (after the “≈” sign) takes into account that gA ≈ 2 with very good accuracy.
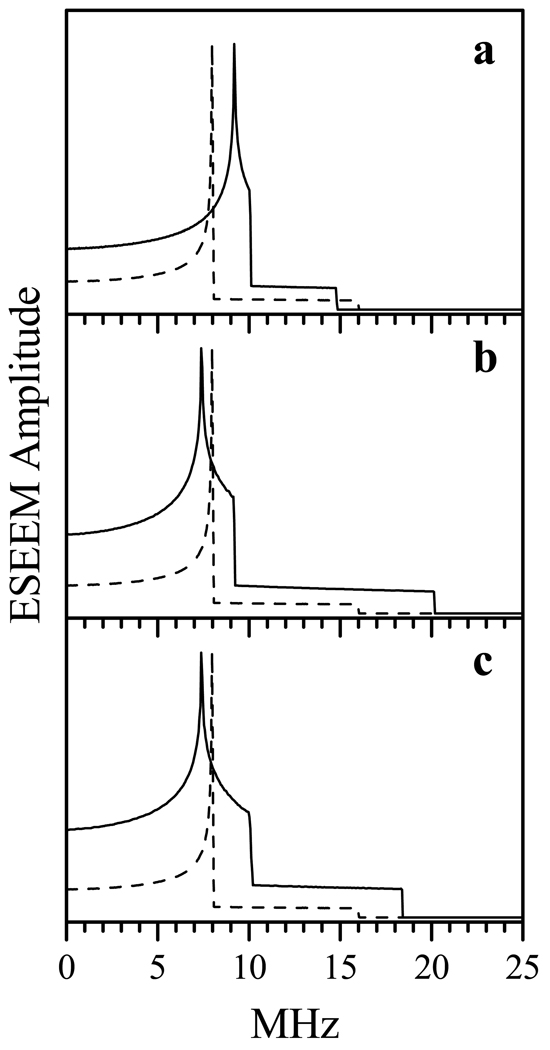
From Eq. 2 one can see that the anisotropic g-factor of Fe(III) will result in effective elongation or shortening of with the factor of . This can result in the observable ratio |D∥/D⊥| in the experimental RIDME spectrum being generally different from Eq. 2. This is illustrated by the simulated dipole interaction spectra shown in Figure 7. These spectra correspond to the three possible situations where the dipolar axes are aligned with the spin B g-frame, which results in the principal components of D(2) being multiplied by gBj / 2.
Figure 7.
Examples of simulated dipole interaction spectra for the cases of isotropic and anisotropic g-factors. Solid traces, ideal dipole interaction spectra calculated for the system with isotropic gA = 2 and anisotropic gB = (gBX, gBY, gBZ) = (2.52, 2.3, 1.85). The reference dipole interaction tensor D(2) is axial, with the components (8, 8, −16) MHz. In panels a, b, and c, the long axis of D(2) is aligned with axis Z, X and Y of spin B g-frame, respectively. Dashed traces show the dipole interaction spectrum corresponding to D(2) (that is, in the system with isotropic gA = gB = 2).
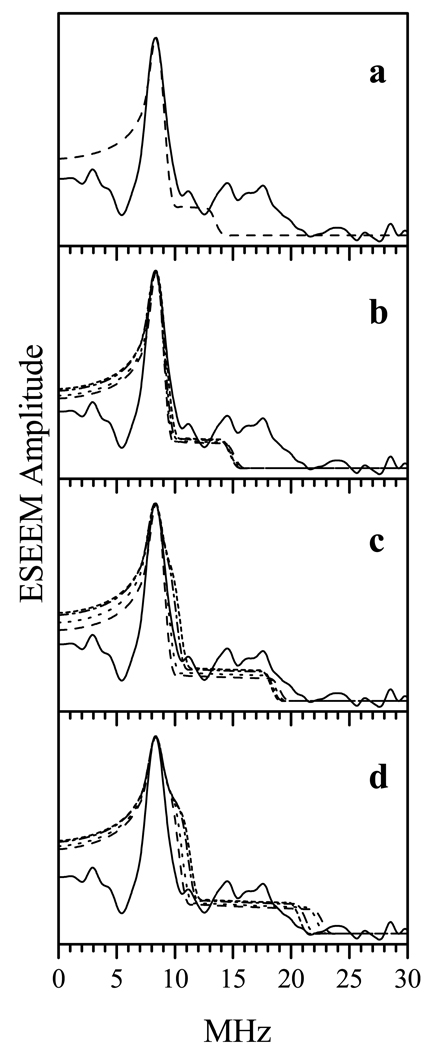
In the studied NOS system, the orientation of R with respect to the g-frame of the heme iron center is not known a priori, and different assumptions about this orientation may result in somewhat different distance estimates because of the scaling of the dipolar tensor components described above. Based on |D∥| = 19 MHz, the possible point-dipole distance estimates range from 17.4 Å for R ∥ Z to 19.3 Å for R ∥ X. These estimates, however, do not guarantee that the corresponding D⊥ features will coincide with the experimental ones, and it is possible that only a significantly narrower range of distances will actually fit the experimental data. Therefore, in order to improve the distance estimate and obtain the information about the orientation of R with respect to the heme g-frame, numerical simulations of the experimental RIDME spectrum were performed. In these simulations, the orientation of R with respect to the heme iron g-frame was defined by the polar angle θ (the angle between R and Z) and azimuthal angle φ (the angle between the projection of R on the XY plane and axis X). For each orientation, the distance R was adjusted in such a way as to reproduce the positions of D⊥ peaks. The coincidence or divergence between positions of the calculated and experimental D∥ shoulders was used as a main criterion for acceptability of the given structural model.
Figure 8 shows the spectra calculated for θ = 0°, 30°, 60° and 90°, and for similar values of φ. The corresponding reference dipole interaction tensors (D(2)) are given in Table 1. One can see that for θ = 0° and 30° the simulated D∥ features are too narrow (Figures 8a and 8b), while for θ = 90° they are too wide compared with the experimental ones (Figure 8d). At θ = 60° and φ = 0° – 30° the position of D∥ approximately reproduces the experimental one (Figure 8c). Additional calculations for θ close to 60° allow one to establish the range of acceptable values of θ to be from 60° to 70°, and the range of φ to be from 0° to 30°. While the larger values of θ (up to 80°) and φ (up to 90°) allowed to reproduce the position of the D∥ shoulder, the D⊥ feature became unacceptably broad (e.g., the short-dashed and dash-dotted traces in Figure 8c). The values corresponding to θ = 60° and 70° are 8 and 8.2 MHz, respectively, which correspond to the respective distances of 18.9 Å and 18.7 Å (i.e., R = 18.8 ± 0.1 Å).
Figure 8.
Comparison of experimental and simulated dipole interaction spectra. The solid trace in each panel is the experimental RIDME spectrum reproduced from Figure 6. Dashed, dotted, short-dashed, and dash-dotted traces in all panels are simulated with parameters described in Table 1. To emulate the experimental linewidth, the simulated “ideal” spectra were Fourier-transformed, truncated to a 1 µs time interval, apodized using a cosine window, and Fourier-transformed back to the frequency domain.
Table 1.
Reference dipole interaction tensors (D(2)) and their orientations used for simulating the dipole interaction spectra in Figure 8. The reference tensors are axial and are characterized by their perpendicular component chosen in such a way as to fit the position of the 8.3 MHz peak in the experimental spectrum. The orientation of the long component, , with respect to the heme iron g-frame is defined by the polar, θ, and azimuthal, φ, angles.
| Panel in Figure 8 | dashed line (MHz), θ,φ |
dotted line (MHz), θ,φ |
short-dashed line (MHz), θ,φ |
dash-dotted line (MHz), θ,φ |
|---|---|---|---|---|
| a | 7.3, 0°, 0° | - | - | - |
| b | 7.4, 30°, 0° | 7.4, 30°, 30° | 7.4, 30°, 60° | 7.5, 30°, 90° |
| c | 8.0, 60°, 0° | 8.0, 60°, 30° | 8.2, 60°, 60° | 8.3, 60°, 90° |
| d | 9.0, 90°, 0° | 9.0, 90°, 30° | 9.0, 90°, 60° | 9.0, 90°, 90° |
Discussion
In the Results section we described the detection of the dipole interaction between the NOS heme iron and FMNH• centers using RIDME. The distance between these two centers was estimated under the assumptions of full orientational disorder, point dipole approximation, and negligibility of the scalar exchange interaction. The accuracy of these three approximations is discussed below.
The orientational selectivity is first discussed. The inversion recovery experiments show that the relaxation rate of Fe(III) depends very little on the orientation of its molecular frame with respect to the external magnetic field vector, Bo (see Figure S3). Therefore, the ensemble of spins B flipped by the relaxation process under the conditions of our RIDME experiment is, to a good accuracy, completely orientationally disordered. In addition, the field sweep spectrum of FMNH• (Figure S4) is almost symmetric, and its width (ΔBpp = 2.4 mT) is comparable with the mw excitation width (B1 = 1 mT for the 90° mw pulses of 9 ns). Thus, the ensemble of spins A observed in our RIDME experiment is also, to a good accuracy, completely orientationally disordered. This orientational disorder of the observed spins A and relaxing spins B results in the lack of orientational selectivity in our RIDME experiments.
In order to evaluate the scale of possible departures of the reference dipole interaction tensor D(2) from that based on a point dipole approximation, one has to take into account the spin density distribution in the heme system and in the π-system of FMNH•. For the heme system the worst scenario would correspond to the dxy ground state, which is characterized by relatively low spin population of the central Fe(III) (~ 0.65) and relatively high spin population of the porphyrin meso carbons (~ 0.06).67–69 For the heme systems with dπ ground state the spin population of the central Fe(III) is significantly larger (~0.85),68 and the whole heme system corresponds more closely to a point dipole. In FMNH•, the electronic spin is mostly located on nitrogens N5 and N10 and carbon C4a (total spin population ~ 0.670,71) in the central part of the molecule. The rest of the spin density is distributed over the isoalloxazine π-system in a sign-alternating manner. Calculations of the reference dipole interaction tensor D(2) for the abovementioned spin density distribution show that for distances R ~ 19 Å the largest possible rhombicity does not exceed 2%, and the departure of from the point-dipolar value is no more than 8%. This results in the possible inaccuracy in the distance estimate of ~ 2% (about 0.5 Å), which is much less than the size of one of the aromatic rings in FMNH•.
With regard to the possible scalar exchange interaction, a survey of the literature on model systems shows that for characteristic distances of 15 – 20 Å considerable exchange coupling constants J of up to several MHz can only be observed if the two paramagnetic centers are linked by conjugated bonds, while in the case of σ-bonds or in the absence of a direct linker, the exchange coupling is effectively zero.72,73 These results confirm that the approximation of J = 0 used in our analysis is reasonable.
Let us now consider the orientational information we obtained in this work. The orientation of vector R was determined with respect to the g-frame of the heme iron center. In order to obtain the orientation with respect to the molecular frame (e.g., the angle between R and the heme plane), one needs to know how the g-frame axes are oriented relative to the molecular axes, and specifically which g-axes, X or Z, corresponds to the heme plane normal. To our knowledge, no experimental data that unequivocally answer this question have been reported, and we will address this problem in our future experiments. Nonetheless, if we tentatively assign gZ to the heme plane normal, then the angle between R and the heme plane is within 20° – 30°, and the edge-to-edge distance between FMNH• and the heme (that is, the shortest distance between their respective π-systems) can be as low as ~ 13 Å, while for gZ being one of the in-plane principal components, the distance can be up to 18 Å.
Our recent low temperature MCD studies indicate that the interdomain FMN–heme interactions modulate the interactions between the substrate and catalytic heme center.37 A kinetic study by Haque et al. suggested that the FMN domain docking may be involved in regulating NOS catalytic activity.74 In that work, a neutralization mutation at the nNOS FMN domain surface was shown to increase NO synthesis activity by enhancing the rate of [Fe(II)–NO] oxidation. Another study showed that FMN domain residue E658 is important for human iNOS activity, and also suggested the importance of the FMN module for such activity.75 These results indicate the importance of appropriate docking of the FMN domain for both efficient IET and substrate-heme interactions. Therefore, we have used the ZDOCK software60 to calculate possible structures of IET complex between the heme and FMN domains, in which the distance between the heme iron and FMN centers should be close to the experimental distance obtained in this work. Because the center of the electron spin density of the neutral flavin radical in flavoproteins is near the N5 position of the pyrazine ring,70,71 the Fe ⋯ FMN N5 distance in the human iNOS oxyFMN construct should be ~ 18.8 Å. The docking structure shown in Figure 9 represents a ZDOCK solution (number 6 in Table S1) that satisfies this major constraint and the other two conditions described in the Experimental Section (that Arg511 of the CaM-binding region and Glu502 in the oxygenase subunit B be within 25 Å from each other, and that residues Arg203 of the oxygenase subunit A and Glu546 of the CaM-binding region be in the interdomain FMN–heme interaction area). Note that the shortest distance between the heme and the flavin (i.e., the vinyl group of the B ring and the C8 methyl group of FMN) in this model is 13.1 Å (Figure 9b), which is in excellent agreement with the IET rate constants determined by CO photolysis.29,31
It is known that CaM binds tightly to iNOS and should actually be present in the complex of the FMN and heme domains. As described in the Experimental Section, no satisfactory ZDOCK solutions could be obtained with the CaM molecule included in the input file for the calculation, and the selected solution (Figure 9) does not contain CaM. Nonetheless, the inspection of the structure of Figure 9 shows that there may be enough space in this structure to accommodate the CaM molecule. The proposed structure including CaM is shown in Figure S5, and the contact area between the CaM and NOS proteins of this structure does include the CaM EF hand 3, which is important in iNOS catalysis.76 This suggests that the docking solution of Figure 9 may still be a reasonable model of the CaM-bound iNOS FMN/heme complex. The inability of ZDOCK to find satisfactory docking solutions that include CaM in the input file could be caused by a possible slight change in the structures of the heme and FMN domains in the docking complex as compared to the respective crystal structures of the separate domains (e.g., the specific position of the CaM molecule found in the iNOS FMN domain crystal structure may obstruct the docking of heme domain in the ZDOCK settings). Indeed, the complex between CaM and the FMN domain of human iNOS has been crystallized in four different conformations, demonstrating the flexible nature of interdomain interactions between CaM and the FMN domain.45
Conclusion
In the absence of crystal structures of full length NOS proteins, it is important to employ alternative experimental methods to obtain structural information relevant for the NOS function. One of such alternative approaches is to use EPR to determine the FMN⋯Fe distance in the FMN–heme IET complex. In this study, we have found optimal conditions for making [Fe(III)][FMNH•] samples in which the two paramagnetic centers reside in the same protein molecule, and have identified a suitable pulsed EPR technique for measuring the dipole interaction between the unpaired electrons on the Fe(III) and FMNH• centers, from which the FMNH•⋯Fe(III) distance has been determined.
The pulsed EPR measurements described in this work represent the first direct determination of the distance between the heme iron of one subunit and FMN centers of the other subunit of the NOS dimer (Figure 9). The distance of 18.8 ± 0.1 Å obtained by pulsed EPR is between the Fe(III) ion and the pyrazine ring of FMNH•, where the most of the respective electronic spin populations are concentrated. Depending on the orientation of the Fe(III) – FMNH• radius-vector, R, with respect to the heme molecular frame, this distance range translates to the range of the shortest distances between the π-systems (edge to edge distances) of about 13 – 18 Å. These distances are in excellent agreement with the IET rate constants. To narrow down the range of the estimated edge-to-edge distances, one needs to experimentally establish the orientation of the heme iron g-frame with respect to the molecular frame. This work is currently in progress.
The experimental distance between the heme iron and the FMN centers, along with other information from crystal structures of NOS domains and kinetic studies of NOS constructs, was used to evaluate various domain docking structures. This analysis demonstrates that the distance constraints obtained from EPR can significantly facilitate the choice between alternative computational docking solutions. The selected docking model(s) may in turn help design further experiments to test the role of specific residues in the NOS IET processes. Additional pulsed EPR spectroscopic studies of NOS with point mutations at the interdomain interaction sites should provide new important insights into the role of key structural determinants in regulating the IET and NOS catalysis in the isoforms by docking of the FMN domain.
Supplementary Material
ACKNOWLEDGMENT
We thank Prof. John Salerno at Kennesaw State University and Prof. Ah-lim Tsai at the University of Texas Health Science Center at Houston for helpful discussions. This work was supported by grants from the National Institutes of Health (GM081811 and HL091280 to C.F.), AHA Grant-in-Aid (09GRNT2220310 to C.F.), and NSERC (183521 to J.G.G.). The project described was also supported by Grant Number P20RR016480 from the National Center for Research Resources (NCRR), a component of the National institutes of Health (NIH). Its contents are solely the responsibility of the authors and do not necessarily represent the official views of NCRR or NIH.
Abbreviations
- NO
nitric oxide
- NOS
nitric oxide synthase
- iNOS
inducible NOS
- CaM
calmodulin
- oxyFMN
bi-domain NOS construct in which only oxygenase and FMN domains along with CaM-binding region are present
- FMN
flavin mononucleotide
- FMNH•
FMN semiquinone
- IET
interdomain electron transfer
- EPR
electron paramagnetic resonance
- ESE
electron spin echo
- ESEEM
electron spin echo envelope modulation
- ELDOR
electron-electron double resonance
- RIDME
relaxation-induced dipolar modulation enhancement
- mw
microwave
Footnotes
SUPPORTING INFORMATION. UV-vis and X-band CW EPR spectra of the [Fe(III)][FMNH•] form of human iNOS oxyFMN construct; relaxation recovery traces for the Fe(III) center; narrow-range Ka-band field sweep spectrum of FMNH•; model of a complex between the human iNOS oxygenase and FMN domains in which CaM is added; and parameters for the ZDOCK solutions.
REFERENCES
- 1.Schmidt H, Walter U. Cell. 1994;78:919–925. doi: 10.1016/0092-8674(94)90267-4. [DOI] [PubMed] [Google Scholar]
- 2.Moncada S, Higgs EA. Br J Pharmacol. 2006;147:S193–S201. doi: 10.1038/sj.bjp.0706458. [DOI] [PMC free article] [PubMed] [Google Scholar]
- 3.Lancaster JR, Xie KP. Cancer Res. 2006;66:6459–6462. doi: 10.1158/0008-5472.CAN-05-2900. [DOI] [PubMed] [Google Scholar]
- 4.Vallance P, Leiper J. Nature Reviews Drug Discovery. 2002;1:939–950. doi: 10.1038/nrd960. [DOI] [PubMed] [Google Scholar]
- 5.Silverman RB. Acc. Chem. Res. 2009;42:439–451. doi: 10.1021/ar800201v. [DOI] [PMC free article] [PubMed] [Google Scholar]
- 6.Delker SL, Ji H, Li H, Jamal J, Fang J, Xue F, Silverman RB, Poulos TL. J. Am. Chem. Soc. 2010;132:5437–5442. doi: 10.1021/ja910228a. [DOI] [PMC free article] [PubMed] [Google Scholar]
- 7.Roman LJ, Martasek P, Masters BSS. Chem. Rev. 2002;102:1179–1189. doi: 10.1021/cr000661e. [DOI] [PubMed] [Google Scholar]
- 8.Salerno JC, Harris DE, Irizarry K, Patel B, Morales AJ, Smith SME, Martasek P, Roman LJ, Masters BSS, Jones CL, Weissman BA, Lane P, Liu Q, Gross SS. J. Biol. Chem. 1997;272:29769–29777. doi: 10.1074/jbc.272.47.29769. [DOI] [PubMed] [Google Scholar]
- 9.Roman LJ, Martasek P, Miller RT, Harris DE, de la Garza MA, Shea TM, Kim JJP, Masters BSS. J. Biol. Chem. 2000;275:29225–29232. doi: 10.1074/jbc.M004766200. [DOI] [PubMed] [Google Scholar]
- 10.Chen CA, Druhan LJ, Varadharaj S, Chen YR, Zweier JL. J. Biol. Chem. 2008;283:27038–27047. doi: 10.1074/jbc.M802269200. [DOI] [PMC free article] [PubMed] [Google Scholar]
- 11.Gao YT, Roman LJ, Martasek P, Panda SP, Ishimura Y, Masters BSS. J. Biol. Chem. 2007;282:28557–28565. doi: 10.1074/jbc.M704890200. [DOI] [PubMed] [Google Scholar]
- 12.Gao YT, Panda SP, Roman LJ, Martasek P, Ishimura Y, Masters BSS. J. Biol. Chem. 2007;282:7921–7929. doi: 10.1074/jbc.M609814200. [DOI] [PubMed] [Google Scholar]
- 13.Dunford AJ, Rigby SEJ, Hay S, Munro AW, Scrutton NS. Biochemistry. 2007;46:5018–5029. doi: 10.1021/bi7001339. [DOI] [PubMed] [Google Scholar]
- 14.Udit AK, Belliston-Bittner W, Glazer EC, Le Nguyen YH, Gillan JM, Hill MG, Marletta MA, Goodin DB, Gray HB. J. Am. Chem. Soc. 2005;127:11212–11213. doi: 10.1021/ja0520114. [DOI] [PMC free article] [PubMed] [Google Scholar]
- 15.Bayachou M, Boutros JA. J. Am. Chem. Soc. 2004;126:12722–12723. doi: 10.1021/ja0482987. [DOI] [PubMed] [Google Scholar]
- 16.Gao YT, Smith SME, Weinberg JB, Montgomery HJ, Newman E, Guillemette JG, Ghosh DK, Roman LJ, Martasek P, Salerno JC. J. Biol. Chem. 2004;279:18759–18766. doi: 10.1074/jbc.M308936200. [DOI] [PubMed] [Google Scholar]
- 17.Feng CJ, Tollin G, Hazzard JT, Nahm NJ, Guillemette JG, Salerno JC, Ghosh DK. J. Am. Chem. Soc. 2007;129:5621–5629. doi: 10.1021/ja068685b. [DOI] [PubMed] [Google Scholar]
- 18.Beaumont E, Lambry JC, Gautier C, Robin AC, Gmouh S, Berka V, Tsai AL, Blanchard-Desce M, Slama-Schwok A. J. Am. Chem. Soc. 2007;129:2178–2186. doi: 10.1021/ja067543e. [DOI] [PubMed] [Google Scholar]
- 19.Guan ZW, Kamatani D, Kimura S, Iyanagi T. J. Biol. Chem. 2003;278:30859–30868. doi: 10.1074/jbc.M301929200. [DOI] [PubMed] [Google Scholar]
- 20.Craig DH, Chapman SK, Daff S. J. Biol. Chem. 2002;277:33987–33994. doi: 10.1074/jbc.M203118200. [DOI] [PubMed] [Google Scholar]
- 21.Tejero J, Hannibal L, Mustovich A, Stuehr DJ. J. Biol. Chem. 2010;285 doi: 10.1074/jbc.M110.138842. in press. [DOI] [PMC free article] [PubMed] [Google Scholar]
- 22.Panda K, Ghosh S, Stuehr DJ. J. Biol. Chem. 2001;276:23349–23356. doi: 10.1074/jbc.M100687200. [DOI] [PubMed] [Google Scholar]
- 23.Li D, Kabir M, Stuehr DJ, Rousseau DL, Yeh SR. J. Am. Chem. Soc. 2007;129:6943–6951. doi: 10.1021/ja070683j. [DOI] [PubMed] [Google Scholar]
- 24.Davydov R, Sudhamsu J, Lees NS, Crane BR, Hoffman BM. J. Am. Chem. Soc. 2009;131:14493–14507. doi: 10.1021/ja906133h. [DOI] [PubMed] [Google Scholar]
- 25.Stuehr DJ, Tejero J, Haque MM. FEBS J. 2009;276:3959–3974. doi: 10.1111/j.1742-4658.2009.07120.x. [DOI] [PMC free article] [PubMed] [Google Scholar]
- 26.Feng CJ, Tollin G. Dalton Trans. 2009:6692–6700. doi: 10.1039/b902884f. [DOI] [PMC free article] [PubMed] [Google Scholar]
- 27.Ghosh DK, Salerno JC. Front Biosci. 2003;8:D193–D209. doi: 10.2741/959. [DOI] [PubMed] [Google Scholar]
- 28.Feng CJ, Tollin G, Holliday MA, Thomas C, Salerno JC, Enemark JH, Ghosh DK. Biochemistry. 2006;45:6354–6362. doi: 10.1021/bi060223n. [DOI] [PubMed] [Google Scholar]
- 29.Feng CJ, Dupont A, Nahm N, Spratt D, Hazzard JT, Weinberg J, Guillemette J, Tollin G, Ghosh DK. J. Biol. Inorg. Chem. 2009;14:133–142. doi: 10.1007/s00775-008-0431-2. [DOI] [PMC free article] [PubMed] [Google Scholar]
- 30.Feng CJ, Roman LJ, Hazzard JT, Ghosh DK, Tollin G, Masters BSS. FEBS Lett. 2008;582:2768–2772. doi: 10.1016/j.febslet.2008.07.005. [DOI] [PMC free article] [PubMed] [Google Scholar]
- 31.Feng CJ, Thomas C, Holliday MA, Tollin G, Salerno JC, Ghosh DK, Enemark JH. J. Am. Chem. Soc. 2006;128:3808–3811. doi: 10.1021/ja0578606. [DOI] [PubMed] [Google Scholar]
- 32.Ilagan RP, Tejero Js, Aulak KS, Ray SS, Hemann C, Wang Z-Q, Gangoda M, Zweier JL, Stuehr DJ. Biochemistry. 2009;48:3864–3876. doi: 10.1021/bi8021087. [DOI] [PMC free article] [PubMed] [Google Scholar]
- 33.Li H, Das A, Sibhatu H, Jamal J, Sligar SG, Poulos TL. J. Biol. Chem. 2008;283:34762–34772. doi: 10.1074/jbc.M806949200. [DOI] [PMC free article] [PubMed] [Google Scholar]
- 34.Ilagan RP, Tiso M, Konas DW, Hemann C, Durra D, Hille R, Stuehr DJ. J. Biol. Chem. 2008;283:19603–19615. doi: 10.1074/jbc.M802914200. [DOI] [PMC free article] [PubMed] [Google Scholar]
- 35.Welland A, Garnaud PE, Kitamura M, Miles CS, Daff S. Biochemistry. 2008;47:9771–9780. doi: 10.1021/bi800787m. [DOI] [PubMed] [Google Scholar]
- 36.Haque MM, Panda K, Tejero J, Aulak KS, Fadlalla MA, Mustovich AT, Stuehr DJ. Proc Natl Acad Sci U S A. 2007;104:9254–9259. doi: 10.1073/pnas.0700332104. [DOI] [PMC free article] [PubMed] [Google Scholar]
- 37.Sempombe J, Elmore BO, Sun X, Dupont A, Ghosh DK, Guillemette JG, Kirk ML, Feng C. J. Am. Chem. Soc. 2009;131:6940–6941. doi: 10.1021/ja902141v. [DOI] [PMC free article] [PubMed] [Google Scholar]
- 38.Ghosh DK, Holliday MA, Thomas C, Weinberg JB, Smith SME, Salerno JC. J. Biol. Chem. 2006;281:14173–14183. doi: 10.1074/jbc.M509937200. [DOI] [PubMed] [Google Scholar]
- 39.Li HY, Igarashi J, Jamal J, Yang WP, Poulos TL. J. Biol. Inorg. Chem. 2006;11:753–768. doi: 10.1007/s00775-006-0123-8. [DOI] [PubMed] [Google Scholar]
- 40.Crane BR, Arvai AS, Ghosh DK, Wu CQ, Getzoff ED, Stuehr DJ, Tainer JA. Science. 1998;279:2121–2126. doi: 10.1126/science.279.5359.2121. [DOI] [PubMed] [Google Scholar]
- 41.Raman CS, Li HY, Martasek P, Kral V, Masters BSS, Poulos TL. Cell. 1998;95:939–950. doi: 10.1016/s0092-8674(00)81718-3. [DOI] [PubMed] [Google Scholar]
- 42.Li HY, Shimizu H, Flinspach M, Jamal J, Yang WP, Xian M, Cai TW, Wen EZ, Jia QA, Wang PG, Poulos TL. Biochemistry. 2002;41:13868–13875. doi: 10.1021/bi020417c. [DOI] [PubMed] [Google Scholar]
- 43.Zhang J, Martasek P, Paschke R, Shea T, Masters BSS, Kim JJP. J. Biol. Chem. 2001;276:37506–37513. doi: 10.1074/jbc.M105503200. [DOI] [PubMed] [Google Scholar]
- 44.Garcin ED, Bruns CM, Lloyd SJ, Hosfield DJ, Tiso M, Gachhui R, Stuehr DJ, Tainer JA, Getzoff ED. J. Biol. Chem. 2004;279:37918–37927. doi: 10.1074/jbc.M406204200. [DOI] [PubMed] [Google Scholar]
- 45.Xia C, Misra I, Iyanagi T, Kim JJP. J. Biol. Chem. 2009;284:30708–30717. doi: 10.1074/jbc.M109.031682. [DOI] [PMC free article] [PubMed] [Google Scholar]
- 46.Aoyagi M, Arvai AS, Tainer JA, Getzoff ED. EMBO J. 2003;22:766–775. doi: 10.1093/emboj/cdg078. [DOI] [PMC free article] [PubMed] [Google Scholar]
- 47.Page CC, Moser CC, Chen XX, Dutton PL. Nature. 1999;402:47–52. doi: 10.1038/46972. [DOI] [PubMed] [Google Scholar]
- 48.Galli C, MacArthur R, Abu-Soud HM, Clark P, Stuehr DJ, Brudvig GW. Biochemistry. 1996;35:2804–2810. doi: 10.1021/bi9520444. [DOI] [PubMed] [Google Scholar]
- 49.Tsai AL, Berka V, Chen PF, Palmer G. J. Biol. Chem. 1996;271:32563–32571. doi: 10.1074/jbc.271.51.32563. [DOI] [PubMed] [Google Scholar]
- 50.Perry JM, Moon N, Zhao Y, Dunham WR, Marletta MA. Chemistry & Biology. 1998;5:355–364. doi: 10.1016/s1074-5521(98)90069-2. [DOI] [PubMed] [Google Scholar]
- 51.Schiemann O, Prisner TF. Q Rev Biophys. 2007;40:1–53. doi: 10.1017/S003358350700460X. [DOI] [PubMed] [Google Scholar]
- 52.Astashkin AV, Kawamori A. In: Adv Photosynth Respir. Aartsma TJ, Matysik J, editors. Vol. 26. Dordrecht: Springer; 2008. pp. 325–343. [Google Scholar]
- 53.Borbat PP, Freed JH. In: Biol Magn Reson. Lawrence J, Berliner SSE, Gareth R, Eaton, editors. Vol. 19. New York: Kluwer Academic/Plenum Publishers; 2000. pp. 383–459. [Google Scholar]
- 54.Astashkin AV, Seravalli J, Mansoorabadi SO, Reed GH, Ragsdale SW. J. Am. Chem. Soc. 2006;128:3888–3889. doi: 10.1021/ja0585275. [DOI] [PMC free article] [PubMed] [Google Scholar]
- 55.Bogachev AV, Kulik LV, Bloch DA, Bertsova YV, Fadeeva MS, Verkhovsky MI. Biochemistry. 2009;48:6291–6298. doi: 10.1021/bi900524m. [DOI] [PubMed] [Google Scholar]
- 56.Lovett JE, Bowen AM, Timmel CR, Jones MW, Dilworth JR, Caprotti D, Bell SG, Wong LL, Harmer J. PCCP. 2009;11:6840–6848. doi: 10.1039/b907010a. [DOI] [PubMed] [Google Scholar]
- 57.Kulik LV, Dzuba SA, Grigoryev IA, Tsvetkov YD. Chem. Phys. Lett. 2001;343:315–324. [Google Scholar]
- 58.Kulik LV, Grishin YA, Dzuba SA, Grigoryev IA, Klyatskaya SV, Vasilevsky SF, Tsvetkov YD. J. Magn. Reson. 2002;157:61–68. doi: 10.1006/jmre.2002.2579. [DOI] [PubMed] [Google Scholar]
- 59.Astashkin AV, Enemark JH, Raitsimring A. Concepts in Magnetic Resonance Part B-Magnetic Resonance Engineering. 2006;29B:125–136. [Google Scholar]
- 60.Chen R, Li L, Weng Z. Proteins: Structure, Function, and Genetics. 2003;52:80–87. doi: 10.1002/prot.10389. [DOI] [PubMed] [Google Scholar]
- 61.Panda K, Haque MM, Garcin-Hosfield ED, Durra D, Getzoff ED, Stuehr DJ. J. Biol. Chem. 2006;281:36819–36827. doi: 10.1074/jbc.M606129200. [DOI] [PubMed] [Google Scholar]
- 62.Shimanuki T, Sato H, Daff S, Sagami I, Shimizu T. J. Biol. Chem. 1999;274:26956–26961. doi: 10.1074/jbc.274.38.26956. [DOI] [PubMed] [Google Scholar]
- 63.Charles IG, Palmer RM, Hickery MS, Bayliss MT, Chubb AP, Hall VS, Moss DW, Moncada S. Proc Natl Acad Sci U S A. 1993;90:11419–11423. doi: 10.1073/pnas.90.23.11419. [DOI] [PMC free article] [PubMed] [Google Scholar]
- 64.Bedilo AF, Maryasov AG. Journal of Magnetic Resonance, Series A. 1995;116:87–96. [Google Scholar]
- 65.Hurst GC, Henderson TA, Kreilick RW. J. Am. Chem. Soc. 1985;107:7294–7299. [Google Scholar]
- 66.Hoffman BM, Martinsen J, Venters RA. J. Magn. Reson. 1984;59:110–123. [Google Scholar]
- 67.Walker FA, Nasri H, TurowskaTyrk I, Mohanrao K, Watson CT, Shokhirev NV, Debrunner PG, Scheidt WR. J. Am. Chem. Soc. 1996;118:12109–12118. [Google Scholar]
- 68.Ghosh A, Gonzalez E, Vangberg T. J. Phys. Chem. B. 1999;103:1363–1367. [Google Scholar]
- 69.Astashkin AV, Raitsimring AM, Kennedy AR, Shokhireva TK, Walker FA. J. Phys. Chem. A. 2002;106:74–82. [Google Scholar]
- 70.Edmondson DE. Biochem. Soc. Trans. 1985;13:593–600. doi: 10.1042/bst0130593. [DOI] [PubMed] [Google Scholar]
- 71.Garcia JI, Medina M, Sancho J, Alonso PJ, Gomez-Moreno C, Mayoral JA, Martinez JI. The Journal of Physical Chemistry A. 2002;106:4729–4735. [Google Scholar]
- 72.Margraf D, Cekan P, Prisner TF, Sigurdsson ST, Schiemann O. PCCP. 2009;11:6708–6714. doi: 10.1039/b905524j. [DOI] [PubMed] [Google Scholar]
- 73.Bode BE, Plackmeyer J, Bolte M, Prisner TF, Schiemann O. J. Organomet. Chem. 2009;694:1172–1179. [Google Scholar]
- 74.Haque MM, Fadlalla M, Wang ZQ, Ray SS, Panda K, Stuehr DJ. J. Biol. Chem. 2009;284:19237–19247. doi: 10.1074/jbc.M109.013144. [DOI] [PMC free article] [PubMed] [Google Scholar]
- 75.Liu X-D, Mazumdar T, Xu Y, Getzoff ED, Eissa NT. J Immunol. 2009;183:5977–5982. doi: 10.4049/jimmunol.0902274. [DOI] [PubMed] [Google Scholar]
- 76.Newman E, Spratt DE, Mosher J, Cheyne B, Montgomery HJ, Wilson DL, Weinberg JB, Smith SME, Salerno JC, Ghosh DK, Guillemette JG. J. Biol. Chem. 2004;279:33547–33557. doi: 10.1074/jbc.M403892200. [DOI] [PubMed] [Google Scholar]
Associated Data
This section collects any data citations, data availability statements, or supplementary materials included in this article.


