Abstract
In most eukaryotic cells, mitochondria use the respiratory chain to produce a proton gradient, which is then harnessed for the synthesis of ATP. Recently, mitochondrial roles in regulation of apoptosis have been discovered in many cell types. Eosinophils (Eos) die by apoptosis, but the presence and function of mitochondria in Eos are unknown. This study found that Eos contain mitochondria in small numbers, as shown by labeling with membrane potential-sensitive dyes and in situ PCR for a mitochondrial gene. Eos generate mitochondrial membrane potential from hydrolysis of ATP rather than from respiration, as shown by mitochondrial respiratory inhibitors and mitochondrial uncouplers. The mitochondria provide insignificant respiration but can induce apoptosis, as shown by using the mitochondrial F1F0-ATPase inhibitor oligomycin and translocation of cytochrome c. Thus during differentiation of Eos, although respiration is lost, the other central role of mitochondria, the induction of apoptosis, is retained.
Eosinophils (Eos) are polymorphonuclear granulocytes that are involved in diverse diseases, especially those caused by allergies or by invasive metazoan parasites (1–3). Normally, Eos die in vitro and in vivo by apoptosis (4, 5). Apoptosis of Eos is delayed by cytokines [IL-5, granulocyte macrophage–colony-stimulating factor (GM-CSF)], which are released in allergic diseases, and possible defects in processes of programmed cell death may contribute to the eosinophilia of allergic disease (6). Apoptosis would facilitate clearance of the dying cells by tissue cells such as macrophages. Delayed apoptosis could allow Eos death by other mechanisms, including cytolytic degeneration (7). Such cytolysis would cause local release of Eos granules that contain several highly toxic proteins that could cause local tissue damage. Thus, the method of Eos death could alter pathogenesis of certain diseases. Unfortunately, intracellular mechanisms of Eos apoptosis have not been extensively studied. In many other cell types, mitochondria have been heavily implicated in early and late stages of apoptosis, but mitochondrial functions in Eos have not been addressed. This study sought to determine whether Eos contain mitochondria, whether these mitochondria function in ATP generation through respiration, and whether they are involved in apoptosis by Eos. The data of the study further indicate that the apoptotic function of mitochondria was preserved even in cells where respiratory function of mitochondria was lost.
Materials and Methods
Eosinophil Isolation.
Normal human donors with absolute peripheral blood eosinophil counts below 350 per mm3 were used. Granulocytes were isolated from whole blood by gravity sedimentation over Ficoll/Hypaque, as described previously (8). Eos were separated by negative magnetic selection from neutrophils tagged by adherence of anti-FcRγIII coupled to magnetic beads (9) (anti-FcRγIII, 3G8, a gift from Jay Unkeless, Mt. Sinai School of Medicine, New York). Cell preparations were >95% pure, with contaminating cells being mainly neutrophils. Mononuclear cells were kept under 1%.
Chloromethyl-X-Rosamine (CMX) Staining.
In brief, 3 × 10⁵ Eos were pelleted and resuspended in 1 ml of PBS without Ca2+ or Mg2+. Fresh CMX was prepared daily from a frozen 1 mM DMSO stock. Samples were treated with CMX (0.8 μM final), placed on ice for 15 min, and centrifuged for 5 min at 200 × g. The pellet was resuspended in 30 μl of supernatant and placed on a slide for analysis by fluorescence microscopy. Eos were placed in two categories: cells that contained organellar labeling and those that lacked all organellar labeling. One hundred cells were counted per condition.
In Situ PCR Amplification of Cytochrome Oxidase Subunit II.
To detect mitochondrial DNA by in situ PCR, 400,000 mixed white blood cells were fixed in ice-cold buffered 4% paraformaldehyde for 15 min, divided in half, and placed on silane-Prep slides via a Shandon Cytospin 3 (Shandon, Pittsburgh). The slides were air-dried and stored. Plasma membrane permeability differences between mononuclear cells and Eos led to digestion with 1 M a pepsin solution (9.0 ml H2O/1.0 ml HCl/20 mg pepsin) at room temperature, 2 min for mononuclear cells, or 5 min for Eos. The slides were washed in 0.1 M Tris⋅HCl, pH 7.2, and 0.1 M NaCl for 1 min, and in 1 ml of 100% EtOH for 1 min, then air-dried. The amplification solution consisted of 3 mM MgCl2, GeneAmp Buffer II (10 mM Tris, pH 8.3/50 mM KCl/0.001% gelatin)/200 μM dNTP (dATP, dGTP, dUTP, dCTP)/10 μM digoxigenin-11-dUTP/0.06% BSA/0.6 μM of each primer, and water. A Perkin–Elmer GeneAmp in situ PCR 100 System was used for the PCR step. The thermocycler was prewarmed to 70°C, and the amplification buffer was warmed to 60°C. AmpliTaq DNA polymerase, 7.5 units per sample, was added, and 60 μl of amplification solution was placed on a prewarmed slide and covered by using an AmpliCover disk. After a 3-min cycle at 94°C, 35 cycles of 51°C for 30 sec, 60°C for 1:15 min, and 94°C for 1 min were run. The slides were washed at 50°C for 10 min with 0.2% BSA and 0.1 × SSC. An alkaline phosphatase-conjugate anti-digoxigenin antibody was used to probe the DNA. The anti-digoxigenin–alkaline phosphatase was diluted 1:150 in Tris 0.1 M, pH 7.5/+0.1 M NaCl. The antibody was incubated on the slide for 30 min at 37°C. The slides were washed in Tris 0.1 M, pH 9.5/NaCl 0.1 M/MgCl2 0.1 M at room temperature for 2 min. Reaction products were visualized by 5-bromo-4-chloro-3-indolyl phosphate (BCIP)/nitroblue tetrazolium (NBT) staining. The slides were incubated with BCIP/NBT for 10 min at room temperature, washed with water, stained with nuclear acid red for 3 min, rinsed in water, and dried before mounting with epoxy (10).
Respiration Measurements.
Oxygen consumption was performed as described previously (11). Hep G-2 cells (a hepatocyte cell line), primary mononuclear cells, neutrophils, and Eos were placed in buffered Hanks' balanced salt solution media for 3 min to warm to 37°C and then treated with and without 1 mM buffered potassium cyanide, pH 7.2, at 37°C. O2 was measured by using a Clark electrode. Eos concentrations ranged from 1.58 × 10⁶ to 1.65 × 10⁷ Eos/ml. HepG-2 concentrations ranged from 0.5 × 10⁶ to 1 × 10⁷ cells/ml. Mononuclear cell concentrations ranged from 7.5 × 10⁶ to 2.56 × 10⁷ cells/ml. Neutrophil concentrations were 2.37 × 10⁷ cells/ml.
Respiratory Inhibitors, Mitochondrial Uncouplers, and F1F0-ATPase Inhibitor.
Inhibitors included 5 mM potassium cyanide (KCN) and 10 μg/ml antimycin A. Mitochondrial uncouplers included 5 μM carbonyl cyanide m-chlorophenyl hydrazone (CCCP) and 1 μM carbonyl cyanide p-(trifluoromethoxy)phenyl hydrazone (FCCP). Oligomycin was used as an F1F0-ATPase inhibitor at concentrations from 0 to 20 μg/ml.
Luciferase-Based ATP Measurements.
Eos (5 × 10⁵) in 0.5 ml of RPMI 1640 were cultured with inhibitors of mitochondrial respiration, mitochondrial uncouplers, or inhibitors of the F1F0-ATPase listed above. As controls, Eos were cultured with and without an antiapoptotic agent, 0.05 ng/ml IL-5. At 0, 0.5, 2, and 7 h, cells were washed with Hanks' balanced salt solution, pH 7.2, lysed with 500 μl of H2O, and boiled 5 min before storage at −20°C. ATP levels were determined by using a luciferase-based assay, according to Molecular Probes' directions, by using a Tuner Designs Luminometer TD 20/20 (Sunnyvale, CA).
Apoptotic Morphology.
Eos were stained in Baxter's Dif -Quik (Baxter Diagnostics, McGaw Park, IL) stains and observed under light microscopy for morphological changes, including condensation of the nucleus and decreased cytoplasm at times 30 min, 2, 7, 9, and 11 h (12, 13). One hundred cells were examined per condition.
Immunofluorescence.
One milliliter of polylysine [1 mg/ml polylysine (Sigma) 70,000–130,000] was placed into a 35-mm dish (Fisher) for 5 min. Plates were washed 4 to 5 times in PBS. Cells/plate (1–2 × 10⁶) were added and centrifuged for 5 min at 120 × g. Supernatant was removed, and cells were fixed with formaldehyde [1:10 dilution of 37% Formalin (Sigma) in PBS] for 10 min at room temperature. Cells were washed in PBS and permeabilized with 0.1% Triton (Sigma) in PBS for 3 min, then washed and blocked with 1% BSA in PBS with 0.1% saponin (Sigma) for 10 min. Primary antibodies included cytochrome c (cyto c) (PharMingen) or IgG2b-matched controls were added at 10 μg/ml and incubated for 30 min at room temperature. Cells were washed in PBS and incubated with secondary antibody, 6.25 μg/ml affinity-purified goat anti-mouse IgG tagged with rhodamine (tetramethylrhodamine B isothiocyanate-conjugated) (Jackson ImmunoResearch) for 30 min at room temperature. Plates were washed in PBS, covered with 90% glycerol/10% PBS, and covered with coverslip.
DNA Fragmentation.
Eos (1.5 × 10⁶) were cultured in 1.5 ml of RPMI 1640 + 10% FCS with and without 5, 10, and 20 μg/ml of oligomycin. At time 0 and 7 h, samples were collected, and DNA was extracted following Gentra's Puregene DNA Isolation Kit (Gentra Systems) protocol with one modification: instead of air drying the DNA, it was dried under N2. The DNA was separated on a 1.2% agarose gel containing 0.5 μg/ml of ethidium bromide. Gels were visualized with UV light, and images were obtained with an IS-500 digital imaging system (Alpha Innotech, San Leandro, CA). Eos treated with oligomycin showed morphological changes and DNA fragmentation consistent with apoptosis.
Caspase Activity.
After culturing with and without 20 μg/ml oligomycin and 0.05 ng/ml IL-5 for 0, 2, or 7 h, Eos were treated according to R & D Systems protocols for caspase 9 with the minor modification of 50 μl of lysis buffer for 1.5 × 10⁶ cells instead of 25 μl. The samples were also incubated 2 h versus 1 h after the addition of the fluorimetric substrate Lys-Glu-His-Asp conjugated to the fluorescent reporter molecule 7-amino-4-trifluoromethyl coumarin. The substrate is fluorometric only when cleaved. Fluorescence was measured at an excitation of 400 nm and emission of 505 nm on an SLM 8000C spectrofluorometer (SLM–Aminco, Urbana, IL).
Results and Discussion
Presence of Mitochondria in Eos.
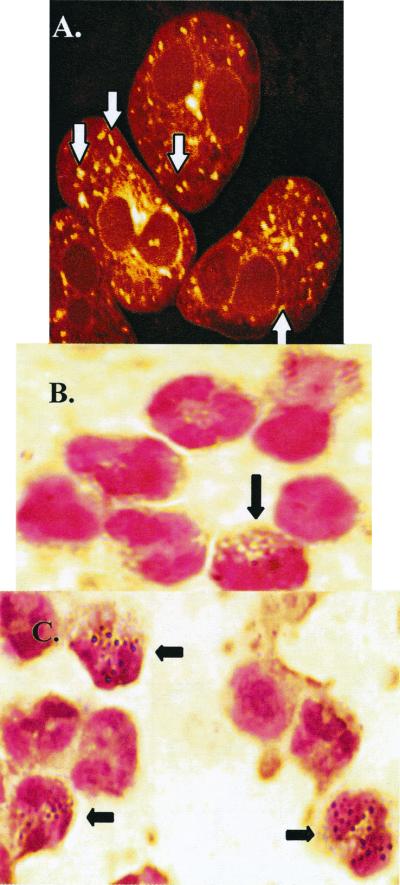
Early data on Eos mitochondria are limited to structural reports from electron microscopy and suggest that Eos contain mitochondria-like organelles (14). However, other criteria are required to determine whether these organelles are functional mitochondria. Mitochondria maintain an ionic gradient across the inner membrane that gives rise to an electric potential (Ψm), and certain lipophilic, membrane potential-sensitive fluorescent dyes are thought to stain mitochondria specifically. To determine whether Eos contain functional mitochondria, Eos were labeled with such dyes including CMX (15) and examined by confocal fluorescent microscopy (Fig. 1A). Similar organelles were labeled with other Ψm-sensitive fluorescent dyes, JC-1, DiOC6, and rhodamine 123 (data not shown). Eos contained elongated oval-shaped organelles of the appropriate size for mitochondria (Fig. 1A). The number of organelles per Eos ranged from 24 to 36. In contrast, hepatocytes contain approximately 1,300 mitochondria per cell (16).
Figure 1.
Determination whether Eos contain organelles that label with mitochondrial-specific dyes and contain mitochondrial-specific DNA. (A) Partitioning of CMX into organelles within Eos. Examination by fluorescence confocal microscopy revealed 24–36 labeled organelles per Eos, as indicated by white arrows. (B and C) In situ PCR amplification and visualization of the mitochondrial-specific gene, cytochrome oxidase subunit II. Peripheral blood cells were used in these experiments. Black arrows indicate Eos. (B) The controls that contained no DNA primers specific for cytochrome oxidase subunit II showed little to no endogenous staining. (C) In situ PCR with DNA primers for cytochrome oxidase subunit II showed 24–36 organelles per Eos. Mitochondria of other cell types were not labeled, because PCR conditions were specifically optimized for labeling Eos. A representative experiment of n = 3 experiments with consistent results.
The presence of labeled organelles did not rule out the possibility of dye uptake by organelles other than mitochondria. To further test for the presence of mitochondria, Eos were labeled by in situ PCR by using primers for the mitochondrial-specific gene, cytochrome oxidase subunit II (Fig. 1 B and C). The number, location, and size of organelles labeling with the in situ PCR method were consistent with the organelles labeling with the mitochondrial-specific dye CMX. The other cells present in the preparations did not label because of optimization for Eos labeling.
Human granulocytes have been thought to contain few if any mitochondria (17). The data in Fig. 1 show that Eos have organelles, which maintain a Ψm and contain mitochondrial DNA. These mitochondria are indeed few in number, being almost 50-fold fewer than in hepatocytes.
Functional Analysis: Respiration.
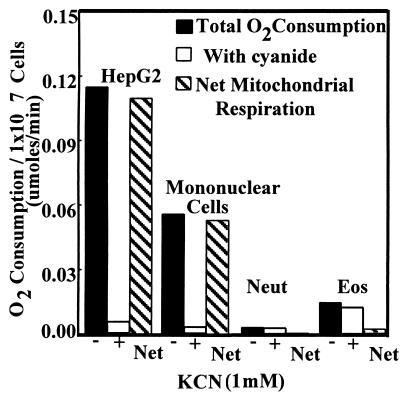
An important function of the mitochondrion in most cell types is oxidative phosphorylation. As electrons are passed through the respiratory chain to molecular O2, protons are pumped out into the intermembrane space to provide a potential that is then used by the F1F0-ATPase to produce ATP. To determine whether Eos mitochondria consume O2, the amount of O2 consumption that could be inhibited by cyanide was measured (Fig. 2). Cyanide binds cytochrome oxidase subunit IV and prevents transfer of electrons to molecular oxygen. Eos consumed very little O2, and of the O2 consumed, little if any was inhibitable by cyanide. The difference in Eos oxygen consumption was compared with mononuclear cells and HepG2 cells that were used as controls (Fig. 2). It has been calculated that rat hepatocytes consume 2.3 × 10⁻¹¹ μmol of O2 per mitochondrion/min (18). From the data in Fig. 2, we can place an upper limit of O2 consumption by Eos to 0.8 × 10⁻¹¹ μmol of O2 per mitochondrion/min at most. The non-cyanide-inhibitable O2 was probably because of the cyanide-resistant NADPH oxidase system.
Figure 2.
Measurement of respiration of Eos by cyanide-inhibitable O2 consumption. As positive controls, the hepatocyte cell line HepG2 and primary human mononuclear cells were used. Human neutrophils were used as a negative control. The solid bars indicate O2 consumption without cyanide present. The white bars indicate O2 consumption with cyanide present. Gray bars indicate the net O2 consumption contributable to mitochondrial respiration. Bars represent means from four experiments.
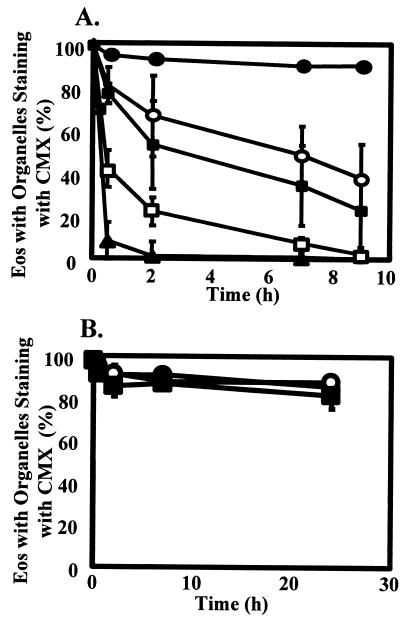
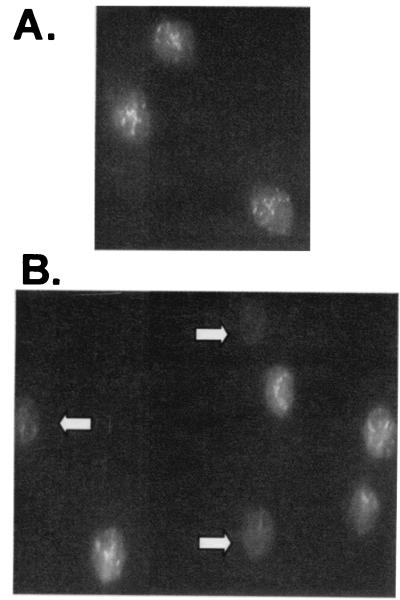
The lack of detectable O2 consumption by mitochondria in Eos raises the question of the source of their Ψm. The F1F0.-ATPase is a reversible ATPase that can use the energy of the proton gradient for ATP synthesis or can function in reverse to cause the hydrolysis of ATP to ADP to maintain a Ψm across the inner mitochondrial membrane (19). If Eos do not have a functional electron transport chain, as the above data suggest, then the Ψm seen with the mitochondria-specific dyes may be derived from reversal of the normal direction of the reaction catalyzed by the F1F0-ATPase. To test this hypothesis, the F1F0-ATPase inhibitor oligomycin was used. Oligomycin binds the F1F0-ATPase (20) and prevents the enzymatic synthesis or hydrolysis of ATP (21). If the Ψm of the mitochondria is provided by the respiratory chain, a hyperpolarization would be expected, because the proton gradient would no longer be used for ATP synthesis. However, if Ψm is derived from ATP hydrolysis, oligomycin should induce a rapid loss of Ψm. The number of Eos with detectable Ψm was determined by CMX labeling and visualized by fluorescent microscopy. Oligomycin caused a dose-dependent loss of Ψm in Eos that was very rapid, occurring within 30 min without any observable hyperpolarization (Fig. 3A). If the Ψm is derived from hydrolysis of ATP, then the ATP must be transported into the matrix of the mitochondria through the adenine translocator (ANT). The ANT inhibitor, bongkrekic acid, caused the loss of Ψm in approximately 50% of the Eos within 1 h, indicating that the Eos mitochondria depend on cytosolic ATP (Fig. 4 A and B). These data indicate that the Ψm of the Eos mitochondria is derived from ATP hydrolysis by F1F0-ATPase and not from the respiratory chain. In support of this conclusion, mitochondrial respiratory chain inhibitors, potassium cyanide (5 mM) and antimycin A (10 μg/ml), did not cause a loss of Ψm compared with untreated Eos over 24 h (Fig. 3B). These respiratory chain inhibitors also did not induce cell death in Eos throughout 24 h (data not shown).
Figure 3.
Effect of oligomycin, which blocks the mitochondrial F1F0-ATPase, or respiratory inhibitors, cyanide or antimycin A, on membrane potential-dependent CMX labeling of eosinophil organelles. (A) Eos were cultured in medium with oligomycin at 0 μg/ml (closed circles), 0.1 μg/ml (open circles), 1.0 μg/ml (closed squares), 10 μg/ml (open squares), and 20 μg/ml (closed triangles) for 0, 0.5, 2, 7, and 9 h. Data indicate the percent of Eos retaining the CMX within the mitochondria of four separate Eos preparations ± SEM. (B) Eos were untreated (closed circle) or treated with 5 mM KCN (open circle) or 10 μg/ml antimycin A (closed square). CMX retention was measured after 0, 0.5, 2, 7, and 24 h from 3 separate Eos preparations ± SEM.
Figure 4.
Eos lose membrane potential when cultured with bongkrekic acid, an inhibitor of the adenine nucleotide translocator. Eos were cultured without (A) and with (B) bongkrekic acid (100 μM) for 1 h and then stained with CMX. Fluorescence images are shown. White arrows indicate Eos that have lost CMX staining.
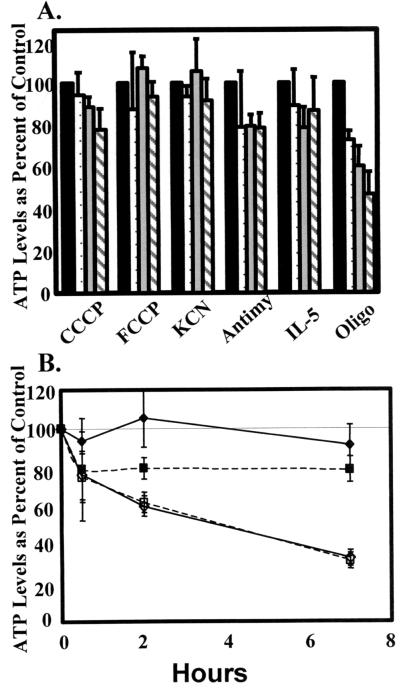
To further test the hypothesis that synthesis of ATP in Eos does not depend on oxidative phosphorylation, ATP levels were measured in the presence of two different respiratory chain inhibitors, cyanide and antimycin A, and two different mitochondrial uncouplers, CCCP and FCCP, which collapse the Ψm by increasing membrane permeability to ions (Fig. 5A). The inhibitors of mitochondrial respiration and the uncouplers had little effect on ATP levels over the course of a 7-h incubation, whereas antimycin A decreased ATP levels by 70% in Hep-G2 cells at 7 h (Fig. 5B). These data further indicate the lack of oxidative phosphorylation in the Eos and are consistent with earlier studies showing the Eos function could be inhibited by inhibitors of glycolysis but not by inhibitors of oxidative phosphorylation (22, 23). In contrast to other inhibitors of mitochondrial functions, oligomycin did cause a significant drop in ATP levels over the 7-h time course. This appears to be because of the rapid induction of apoptosis by oligomycin (described further below). In summary, the mitochondria-like organelles of Eos cannot respire but do maintain a transmembrane gradient by a functional F1F0-ATPase, probably by its hydrolysis of ATP generated in the cytosol.
Figure 5.
Effects of mitochondrial uncouplers and respiratory inhibitors on Eos ATP levels. (A) Eos were cultured with inhibitors of mitochondrial respiration, antimycin A (10 μg/ml), and KCN (5 mM), mitochondrial uncouplers, CCCP (5 μM), and FCCP (1 μM), or an inhibitor of the F1F0-ATPase, oligomycin (10 μg/ml). As controls, Eos were cultured with and without an antiapoptotic agent, IL-5 (0.05 ng/ml). Cells were incubated for 0 (black bars), 0.5 (dotted bars), 2 (gray bars), or 7 h (hatched bars). Data were normalized to the value at 0 h (100%). Means ± SEM of four to seven separate Eos preparations. (B) Eos were cultured with 5 mM KCN (solid diamonds) or 10 μg/ml of antimycin A (solid squares) for 0, 0.5, 2, or 7 h. Hep-G2 cells were cultured with 5 mM KCN (open diamonds) or 10 μg/ml of antimycin A (open squares) for 0, 0.5, 2, or 7 h.
Functional Analysis: Apoptosis.
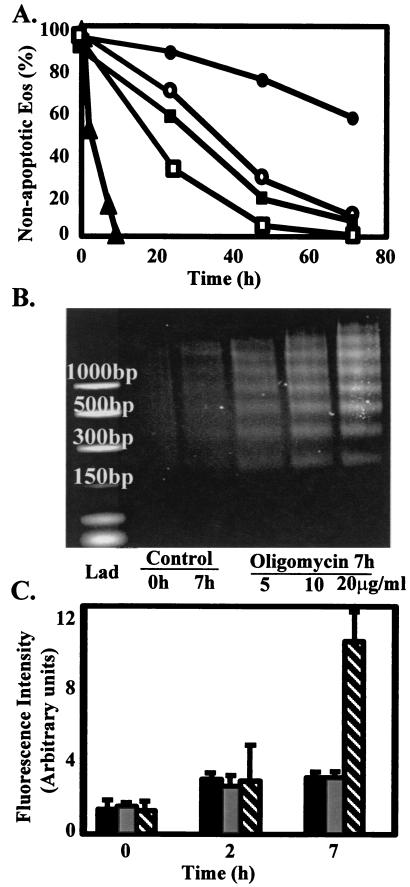
Normally Eos die in vitro and in vivo by apoptosis (4, 5). When cultured in vitro, Eos undergo apoptosis within 2–3 days. In many cell types, mitochondria are important mediators of the apoptosis response. Because Eos mitochondria do not function significantly in respiration, this raises the question of whether they function in Eos apoptosis. Treatment with oligomycin dramatically increases the rate of Eos apoptosis, with complete apoptosis by 8 h (Fig. 6A). Apoptosis was confirmed by DNA fragmentation and caspase 9 activation (Fig. 6 B and C). This is faster than other Eos apoptotic agents including dexamethasone, transforming growth factor β, and Fas, which caused complete apoptosis by 15–36 h (Fig. 6A). These apoptotic agents also cause a drop in Ψm but not as rapidly as oligomycin (data not shown). On the basis of the correlation between loss of Ψm of the mitochondria and the induction of apoptosis in the eosinophil, the next question was whether loss of Ψm alone was sufficient to induce apoptosis. This was tested with the two mitochondrial uncouplers, CCCP and FCCP, which collapse the Ψm without interfering directly with the F1F0-ATPase or the electron transport chain. When CCCP or FCCP was added to culture media, a rapid loss of Ψm was observed within 30 min (data not shown). However, these uncouplers caused apoptosis more slowly and to a lesser extent than oligomycin with only 35–45% compared with 85% apoptosis at 7 h, respectively (data not shown). These data indicate that Ψm loss alone is not sufficient to induce extensive apoptosis in Eos treated with oligomycin.
Figure 6.
Effects of oligomycin on Eos apoptosis, including morphology, DNA fragmentation, and caspase 9 activity. Eos were cultured with 0.05 ng/ml IL-5 (closed circle), 100 ng/ml anti-Fas (open squares), 0.5 ng/ml transforming growth factor β (closed square), 20 μg/ml oligomycin (triangle), or with buffer as a control (open circle). Eos were stained and observed under light microscopy for morphological changes (e.g., nuclear condensation). One hundred cells were examined per condition. Lines represent means of n = three to six experiments. (B) Eos 1.5 × 10⁶ were cultured with and without 5, 10, and 20 μg/ml of oligomycin. At time 0 and 7 h, samples were collected. This is a representative experiment of n = three experiments with consistent results. (C) Effect of oligomycin on activity of caspase 9 in Eos. Eos were untreated (control, black bars), treated with 0.05 ng/ml IL-5 (gray bars), or with 20 μM oligomycin (hatched bars) for 0, 2, and 7 h. Data are means ± SEM of four separate Eos preparations.
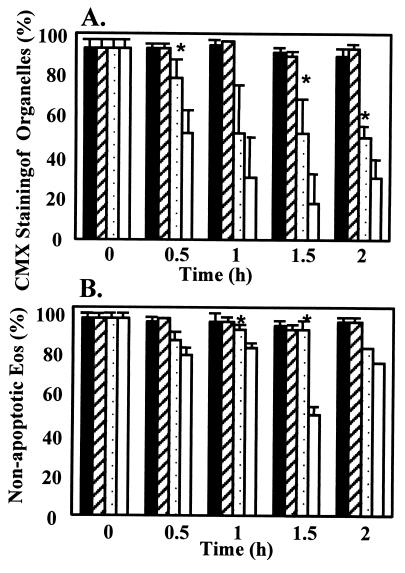
In many types of cells, induction of apoptosis has been associated with opening of the mitochondrial permeability transition pore (PTP). The permeability pore is a channel including the voltage-dependent anion channel and adenine nucleotide translocator, but the exact composition is not known. Mechanism(s) controlling the PTP are currently being defined. Inhibition of the F1F0-ATPase may favor permeability transition (24, 25). Cyclosporin A inhibits the opening of the PTP by blocking the translocation of mitochondrial matrix-specific cyclophilin D to the inner membrane (25). The ability of cyclosporin A to stabilize the mitochondrial Ψm lasts only 60 min in other cells. In Eos, it was found that cyclosporin A delayed the effects of oligomycin, including Ψm loss, induction of apoptotic morphological changes, and decreases in ATP levels (Fig. 7 A and B, and data not shown). There was a temporary stabilization of Ψm in the oligomycin/cyclosporin A-treated Eos that is consistent with findings of others (reviewed in ref. 26). The data suggest that the inhibition of the F1F0-ATPase does cause the opening of the PTP, and that inhibition of the PTP by cyclosporin A delays onset of apoptosis. This suggests that the permeability transition pore may mediate apoptosis in the Eos.
Figure 7.
Effects of cyclosporin A on Ψm losses and apoptotic morphologic characteristics in Eos treated with oligomycin. Eos were precultured for 10 min with or without addition of 5 μM cyclosporin A before the addition of 10 μg/ml oligomycin. Cells were untreated (solid bars), treated with cyclosporin A alone (diagonal bar), oligomycin + cyclosporin A (dotted bars), or oligomycin alone (white bar). (A) Percent of cells retaining CMX labeling. *, P < 0.05 at 30 min between oligomycin + cyclosporin A and oligomycin alone. Means ± SEM of four separate cell preparations. (B) Morphology *, P < 0.05 at 2 and 7 h between oligomycin + cyclosporin A and oligomycin alone. n = five separate preparations.
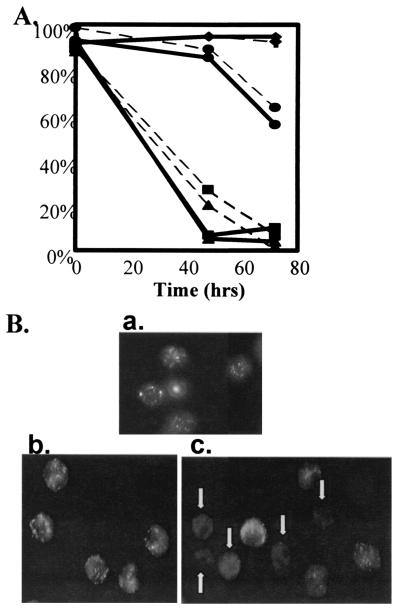
Cyto c has long been recognized as a central component of the mitochondrial electron transport chain. It is normally loosely attached in the mitochondrial intermembrane space. Once released from mitochondria, cyto c plus other factors promote activation of the caspase cascade (27, 28). Three Eos donors were examined for the loss of cyto c from organelles and for apoptotic morphology. All three donors showed cyto c loss before or concurrent with apoptotic morphology despite the donor variability in Eos life spans (Fig. 8 A and B). Cyto c loss at the time of apoptotic morphological changes further suggests a mitochondrial role in Eos apoptosis.
Figure 8.
Cyto c translocation from control Eos. (A) Eos from three separate donors (circle, square, and triangle) were either treated or not with (0.05 ng/ml) IL-5 (diamonds) for 72 h. Percent nonapoptotic morphology (dotted line) and cells with organellar cyto c (solid line) were measured microscopically. IL-5 data represents the mean of three experiments with + SEM. (B) Immunofluorescence of cyto c (a) represents the 0 h cyto c data for donor 1 (circle) and (b and c) represent the 72 h cyto c data on donor 1, IL-5 treated and untreated respectively. The white arrows in c indicate Eos which have lost organellar cyto c labeling.
In the past, the sine qua non of a mitochondrion would almost certainly be respiration and production of ATP as the energy source for the cell. The data indicate that Eos have violated that tradition. Functionally, the Eos mitochondria have insignificant cyanide-inhibitable oxygen consumption, suggesting the lack of a respiratory chain. The rates of O2 consumption in the Eos may be at our limit of detection; however, sustained ATP levels and the lack of Ψm loss in the presence of cyanide or antimycin provide further support for the conclusion that these cells have insignificant mitochondrial respiration and minimal, if any, oxidative phosphorylation.
Instead, the data presented appear to define a priority of mitochondrial function in Eos to initiate apoptosis, even though they do not provide significant respiration.
Acknowledgments
This project was supported by National Institutes of Health Grants P01-HL50395, R01-AI32983, and T32 AI07401.
Abbreviations
- Eos
eosinophils
- GM-CSF
granulocyte–macrophage colony-stimulating factor
- CCCP
carbonyl cyanide m-chlorophenyl hydrazone
- FCCP
carbonyl cyanide p-(trifluoromethoxy) phenyl hydrazone
- CMX
chloromethyl-X-Rosamine
- Ψm
membrane potential
- PTP
permeability transition pore
- cyto c
cytochrome c
References
- 1.Spry C J F, Kay A B, Gleich G J. Immunol Today. 1992;13:384–387. doi: 10.1016/0167-5699(92)90085-L. [DOI] [PubMed] [Google Scholar]
- 2.Weller P F. N Engl J Med. 1991;324:1110–1118. doi: 10.1056/NEJM199104183241607. [DOI] [PubMed] [Google Scholar]
- 3.Venge P, Håkansson L. Clin Exp Allergy. 1991;21,Suppl. 3:31–37. doi: 10.1111/j.1365-2222.1991.tb01761.x. [DOI] [PubMed] [Google Scholar]
- 4.Yamaguchi Y, Suda T, Ohta S, Tominaga K, Miura Y, Kasahara T. Blood. 1991;78:2542–2547. [PubMed] [Google Scholar]
- 5.Yamaguchi Y, Hayashi Y, Sugama Y, Miura Y, Kasahara T, Kitamura S, Torisu M, Mita S, Tominaga A, Takatsu K, Suda T. J Exp Med. 1988;167:1737–1742. doi: 10.1084/jem.167.5.1737. [DOI] [PMC free article] [PubMed] [Google Scholar]
- 6.Simon H U, Blaser K. Immunol Today. 1995;16:53–55. doi: 10.1016/0167-5699(95)80086-7. [DOI] [PubMed] [Google Scholar]
- 7.Erjefalt J S, Greiff L, Andersson M, Matsson E, Petersen H, Linden M, Ansari T, Jeffery P K, Persson C G. Am J Respir Crit Care Med. 1999;160:304–312. doi: 10.1164/ajrccm.160.1.9809048. [DOI] [PubMed] [Google Scholar]
- 8.Boyum A. Nature (London) 1964;204:793–794. doi: 10.1038/204793a0. [DOI] [PubMed] [Google Scholar]
- 9.Hansel T T, De Vries I J M, Iff T, Rihs S, Wandzilak M, Betz S, Blaser K, Walker C. J Immunol Methods. 1991;145:105–110. doi: 10.1016/0022-1759(91)90315-7. [DOI] [PubMed] [Google Scholar]
- 10.Nuovo G J. PCR in Situ Hybridization. 3rd Ed. Philadelphia: Lippincott-Raven; 1998. pp. 193–244. [Google Scholar]
- 11.Bass D A, Gerard C, Olbrantz P, Wilson J, McCall C E, McPhail L C. J Biol Chem. 1987;262:6643–6649. [PubMed] [Google Scholar]
- 12.Woolley M J, Wattie J, Ellis R, Lane C G, Stevens W H, Woolley K L, Dahlback M, O'Byrne P M. J Appl Physiol. 1994;77:1303–1308. doi: 10.1152/jappl.1994.77.3.1303. [DOI] [PubMed] [Google Scholar]
- 13.Burow S, Valet G. Eur J Cell Biol. 1987;43:128–133. [PubMed] [Google Scholar]
- 14.Zucker-Franklin D. Semin Hematol. 1968;5:109–133. [PubMed] [Google Scholar]
- 15.Macho A, Decaudin D, Castedo M, Hirsch T, Susin S A, Zamzami N, Kroemer G. Cytometry. 1996;25:333–340. doi: 10.1002/(SICI)1097-0320(19961201)25:4<333::AID-CYTO4>3.0.CO;2-E. [DOI] [PubMed] [Google Scholar]
- 16.Loud A V. J Cell Biol. 1968;37:27–46. doi: 10.1083/jcb.37.1.27. [DOI] [PMC free article] [PubMed] [Google Scholar]
- 17.Korchak H M, Rich A M, Wilkenfeld C, Rutherford L E, Weissmann G. Biochem Biophys Res Commun. 1982;108:1495–1501. doi: 10.1016/s0006-291x(82)80076-4. [DOI] [PubMed] [Google Scholar]
- 18.Cunningham C C, DeChatelet L R, Spach P I, Parce J W, Thomas M J, Lees C J, Shirley P S. Biochim Biophys Acta. 1982;682:430–435. doi: 10.1016/0005-2728(82)90057-3. [DOI] [PubMed] [Google Scholar]
- 19.Sebald W, Hoppe J. In: On the Structure and Genetics of the Proteolipid Subunit of the ATP Synthase Complex. Sanadi R R, editor. Vol. 12. London: Academic; 1981. pp. 2–65. [Google Scholar]
- 20.Bertina R M, Tager J M. Proc. Biochem. Soc. 1970. 9P–10P. [Google Scholar]
- 21.Lardy J A, Johnson D, McMurray W C. Arch Biochem Biophys. 1958;78:587–597. doi: 10.1016/0003-9861(58)90383-7. [DOI] [PubMed] [Google Scholar]
- 22.David J R, Butterworth A E, Remold H G, David P H, Houba V, Sturrock R F. J Immunol. 1977;118:2221–2229. [PubMed] [Google Scholar]
- 23.Sher R, Wadee A, Joffe M. Clin Exp Immunol. 1983;51:525–534. [PMC free article] [PubMed] [Google Scholar]
- 24.Bernardi P. Biochim Biophys Acta. 1996;1275:5–9. doi: 10.1016/0005-2728(96)00041-2. [DOI] [PubMed] [Google Scholar]
- 25.Kroemer G, Zamzami N, Susin S A. Immunol Today. 1997;18:44–51. doi: 10.1016/s0167-5699(97)80014-x. [DOI] [PubMed] [Google Scholar]
- 26.Susin S A, Zamzami N, Kroemer G. Biochim Biophys Acta. 1998;1366:151–165. doi: 10.1016/s0005-2728(98)00110-8. [DOI] [PubMed] [Google Scholar]
- 27.Li P, Nijhawan D, Budihardjo I, Srinivasula S M, Ahmad M, Alnemri E S, Wang X. Cell. 1997;91:479–489. doi: 10.1016/s0092-8674(00)80434-1. [DOI] [PubMed] [Google Scholar]
- 28.Zou H, Henzel W J, Liu X, Lutschg A, Wang X. Cell. 1997;90:405–413. doi: 10.1016/s0092-8674(00)80501-2. [DOI] [PubMed] [Google Scholar]


