Abstract
It is widely assumed that the human brain contains genetically identical cells through which post-genomic mechanisms contribute to its enormous diversity and complexity. The relatively recent identification of neural cells throughout the neuraxis showing somatically generated mosaic aneuploidy indicates that the vertebrate brain can be genomically heterogeneous (Rehen et al., 2001; Rehen et al., 2005; Westra et al., 2008; Yurov et al., 2007). The extent of human neural aneuploidy is currently unknown because of technically limited sample sizes, but is reported to be small (Iourov et al., 2006). During efforts to interrogate larger cell populations using DNA content analyses, a surprising result was obtained: human frontal cortex brain cells were found to display “DNA content variation (DCV)” characterized by an increased range of DNA content both in cell populations and within single cells. On average, DNA content increased by ~250 megabases often representing a substantial fraction of cells within a given sample. DCV within individual human brains showed regional variation, with increased prevalence in the frontal cortex and less variation in the cerebellum. Further, DCV varied between individual brains. These results identify DCV as a new feature of the human brain, encompassing and further extending genomic alterations produced by aneuploidy, which may contribute to neural diversity in normal and pathophysiological states, altered functions of normal and disease-linked genes, and differences amongst individuals.
Keywords: aneuploidy, copy number variation, neural diversity, DNA, neuron, glia
Introduction
The brain and virtually all somatic cells have been generally assumed to contain identical amounts of genomic DNA. The major exception to this assumption are lymphocytes that produce immunoglobulins or T cell receptors, in part, through DNA recombination processes (Schatz and Spanopoulou, 2005). The notion that somatic alterations in DNA sequence could also contribute to the complexity of the brain can be traced to theoretical explanations of immunoglobulin diversity by Dreyer and Bennett (Dreyer and Bennett, 1965), who proposed the existence of somatic DNA rearrangement in the immune system or more specifically, what is now known as V(D)J recombination (Schatz and Spanopoulou, 2005). This proposal led to further speculation by Dreyer, Gray, and Hood that a similar kind of mechanism might occur within the brain, based in part upon the microscopic appearance of regenerating goldfish nerves from the retina into the optic tectum (Dreyer et al., 1967). In the ensuing decades, plausibly rearranged genomic DNA loci have been examined, including those consisting of many homologous genes such as the protocadherins (reviewed in (Chun, 1999)) and olfactory receptors (reviewed in (Chun, 2004)); however none have thus far shown evidence for DNA rearrangements. The absence of identified loci contrasts with the documented gene expression in the brain of multiple genes that are involved in immunological V(D)J recombination, and include RAG1 (Chun et al., 1991) as well as the non-homologous end-joining (NHEJ) proteins Ku70, Ku80, XRCC4, and Lig4, the latter three of which were shown to disrupt normal brain development when genetically deleted (Chun and Schatz, 1999; Gu et al., 2000; Sekiguchi et al., 1999). The functions of these proteins in the brain remain unclear, but data exist to support DNA functions distinct from NHEJ (Sekiguchi et al., 2001).
Despite the failure to find bona fide DNA rearrangements in neural cells of the brain, the effects of NHEJ gene deletion on brain development suggest that other DNA alterations could be occurring. In particular, loss of NHEJ proteins like Ku80 has been associated with aneuploidy (Difilippantonio et al., 2000), which is the gain and/or loss of chromosomes to produce deviation from haploid multiples (Kingsbury et al., 2006). An extensive assessment of this possibility identified a surprisingly high degree of neural aneuploidy during mouse cerebral cortical development as demonstrated by both chromosome counts as well as spectral karyotyping of mitotic neuroprogenitors. Consistent with these results, postmitotic neurons, as identified by fluorescence in situ hybridization (FISH) of selected chromosomal loci, could also be aneuploid (Rehen et al., 2001). During development, aneuploidy can be produced by known chromosomal segregation mechanisms (Yang et al., 2003), generating an apparently random assortment of aneuploidies that are predominantly losses (hypoploidy) along with rarer gains (hyperploidy) (Kingsbury et al., 2005; McConnell et al., 2004; Rajendran et al., 2007; Rehen et al., 2001; Westra et al., 2008; Yang et al., 2003). The functions of normally occurring neural aneuploidy are still being determined. However, it is associated with apparently physiological functions, with neurons integrated into neural circuitry (Kingsbury et al., 2005), and has also been shown to alter gene expression compared to non-aneuploid cells of the same kind (Kaushal et al., 2003).
Neural aneuploidy occurs to a similar extent in both neurons and glia (Rehen et al., 2005), is found phylogenetically from fish through humans (Kingsbury et al., 2006; Peterson et al., 2008; Rajendran et al., 2007; Rehen et al., 2001; Rehen et al., 2005; Yurov et al., 2005), and is present throughout the neuraxis, with no obviously distinguishable neuroanatomical patterns (Rehen et al., 2001; Rehen et al., 2005; Westra et al., 2008). Aneuploidy represents the first, proven form of DNA sequence alteration(s) present in normal neural cells, while making it likely that other phenomena associated with “genomic instability” could also be present. The creation of complex mosaics of intermixed aneuploid and euploid cells have implications for normal brain development, function, and disease (Iourov et al., 2009; Kingsbury et al., 2006).
A caveat in assessing aneuploidy for non-mitotic or postmitotic cells is the technical inability to interrogate the entire genome – i.e., all chromosomes – within single cells since there are no visible chromosomes present. Thus, formally, all studies utilizing FISH with sub-genomic probes on cells without visible chromosomes leave open a range of alternative explanations for observed fluorescent signals, both legitimate and artifactual. Further complicating analyses of neural aneuploidy by FISH is its labor-intensive nature that allows only a tiny sampling of the total number of cells within the brain to be assessed. To overcome these hybridization-based limitations, we have optimized DNA flow cytometry, particularly via use of isolated cell nuclei rather than whole cells, to assess the overall level of DNA content amongst cells of the brain. Here we report the methodologies, necessary controls, and results that demonstrate a new feature of human brain neurons, which while encompassing aneuploidy, identifies distinct populations with increased range and/or amounts of DNA: we refer to this general property as “DNA content variation (DCV).”
Materials and Methods
Human tissue samples
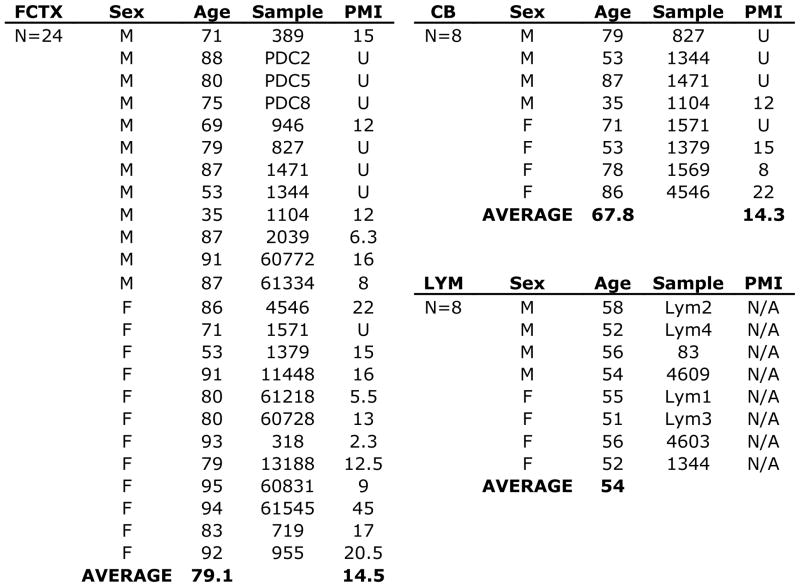
All human protocols were approved by the Human Subjects Committee at The Scripps Research Institute and conform to National Institutes of Health guidelines. Fresh frozen post-mortem human brain tissue from non-diseased control individuals was obtained from the Institute for Brain Aging and Dementia Tissue Repository (University of California, Irvine), the NICHD Brain and Tissue Bank for Developmental Disorders at the University of Maryland, Dr. Jeanne Loring at The Scripps Research Institute (TSRI), and the UK Parkinson’s Disease Brain Bank (Fig. 1). Human peripheral blood was obtained from healthy donors (aged 50–60 years) at The Scripps Research Institute Normal Blood Donor Services.
Figure 1. Human tissues used in this study.
Post-mortem human brain samples from frontal cortex (FCTX) and cerebellum (CB), as well as peripheral blood samples from non-diseased, consenting donors listed by sex (Male, M or Female, F), age, sample identifier, and postmortem interval (PMI). Tissues were obtained from the NICHD Brain and Tissue Bank for Developmental Disorders at the University of Maryland, Baltimore, MD (NICHD contract no. N01-HD-4-3368 and N01-HD-4-3383). The role of the NICHD Brain and Tissue Bank is to distribute tissue, and therefore, cannot endorse the studies performed or the interpretation of results. Additional samples were obtained from Dr. Jeanne Loring at The Scripps Research Institute (TSRI) and the UK Parkinson’s Disease Brain Bank. Human peripheral blood was obtained from the Normal Blood Donor Services at TSRI.
Post-mortem human brain samples from frontal cortex (FCTX) and cerebellum (CB), as well as peripheral blood samples from non-diseased, consenting donors listed by sex (Male, M or Female, F), age, sample identifier, and postmortem interval (PMI). Tissues were obtained from the NICHD Brain and Tissue Bank for Developmental Disorders at the University of Maryland, Baltimore, MD (NICHD contract no. N01-HD-4-3368 and N01-HD-4-3383). The role of the NICHD Brain and Tissue Bank is to distribute tissue, and therefore, cannot endorse the studies performed or the interpretation of results. Additional samples were obtained from Dr. Jeanne Loring at The Scripps Research Institute (TSRI) and the UK Parkinson’s Disease Brain Bank. Human peripheral blood was obtained from the Normal Blood Donor Servicesat TSRI.
Flow cytometry (FCM) and fluorescence-activated cell sorting (FACS)
FCM and FACS were performed at The Scripps Research Institute Flow Cytometry Core Facility with a Becton Dickinson LSRII and FACS-Aria, respectively. For DNA FCM, results were replicated using three different LSRII machines. In addition, FCM results were verified and reproduced by independent researchers. Human brain nuclei were isolated as described previously (Westra et al., 2008), and fixed in ice-cold 70% ethanol for a minimum of overnight prior to FCM. Before FCM analysis, nuclei were filtered through 40 μm nylon mesh, washed in Ca2+ and Mg2+ free PBS supplemented with 2 mM EGTA (PBSE) and resuspended in PBSE with 50 mg/mL propidium iodide (Sigma), 50 μg/mL RNaseA (Sigma), and chicken erythrocyte nuclei or CEN (Biosure). Samples were incubated at room temperature for a minimum of 90 minutes prior to analysis. For FACS, nuclei were sorted into NeuN+ and NeuN- nuclear fractions as described previously (Westra et al., 2008). For DNA content FACS, nuclei were labeled with a NeuN (1:100 dilution) primary antibody (Chemicon, cat# MAB377) and an Alexa Fluor 488 goat anti-mouse IgG secondary antibody (1:250 dilution, cat# A1100-1) from Invitrogen. The NeuN primary antibody used in this study is well characterized (Desilva et al., 2007; Lind et al., 2005), and was raised in mice against purified cell nuclei from mouse brain and reacts with most neuronal cell types throughout the nervous system of mice including cerebellum, cerebral cortex, hippocampus, thalamus, spinal cord, and neurons in the peripheral nervous system. The immunohistochemical staining is primarily in the nucleus of neurons, with light cytoplasmic staining. The few cell types not reactive with MAB377 include Purkinje and mitral cells. In immunoblotting of brain tissue from mice, this antibody recognized 2–3 bands in the 46–48 kDa range and possibly another band at approximately 66 kDa (manufacturer’s data). Immunohistochemical quality control experiments with the NeuN antibody revealed intense nuclear staining in sections of mouse brain, while staining was absent in HEK293 cell cultures. Nuclei were stained with the DNA-binding dye DRAQ5 (Biostatus) for assessment of DNA content in NeuN labeled nuclei. DRAQ5 exhibits high affinity and selective DNA binding and has not been shown to exhibit appreciable non-specific binding (e.g., to RNA). Experimentally, DRAQ5 has been used to detect nuclear boundaries with high sensitivity, measure DNA content in leukocytes, and detect nuclear reorganization events (but is less sensitive than PI in detecting apoptotic nuclei by flow cytometry). As controls for flow cytometry, positive and negative selection gates were set up using samples stained with secondary antibody alone, as well as DNA dye alone.
Fluorescent in situ hybridization (FISH)
For quantitative FISH, we used a fluorescein labeled PNA probe (5′-Flu-ATTCGTTGGAAACGGGA-3′) according to previous reports (Chen et al., 1999; Taneja et al., 2001). Briefly, sorted nuclei were dropped onto glass slides and hybridized for 1 hour at 37°C with PNA. Slides were washed in 2X SSC/50% formamide, 4X SSC/0.1% Tween-20, and 2X SSC for 2 minutes each at 45°C and the nuclei were counterstained with DAPI. Fluorescence images were obtained using a Deltavision deconvolution system attached to an Olympus IX70 microscope (Applied Precision, Issaquah, WA). A series of Z-stacks at 0.5 μm intervals were taken through 5 μm of individual nuclei. The deconvolved image was projected into a single file and analyzed using MetaMorph quantitation software. A minimum of 30 NeuN labeled and NeuN unlabeled nuclei from FACS were scored for PNA fluorescence integral intensity in 4 cortical brain samples. Images were saved in TIFF format, composed in Adobe Photoshop CS 8.0, and adjusted for brightness and contrast.
Southern blotting
Genomic DNA was isolated from human post-mortem brain tissue and lymphocytes using the DNEasy Tissue Kit (Qiagen). For genomic samples, DNA was quantitated by reading the absorbance at 260 nm in a UV-1201 spectrophotometer (Shimadzu). 250 ng of genomic DNA was blotted onto a Nytran SPC nylon transfer membrane (Whatman) and UV-cross-linked for 2 minutes in a UV Stratalinker 2400 (Stratagene) prior to probing the membrane. Membranes were hybridized with 32P-labeled DNA probes generated by random priming. PCR primers used to generate the LINE1 probe spanning ~650 bp (containing portions of ORF1 and ORF2) of the consensus human LINE1 sequence were 5′-TCAGGAAATACAGAGAACGCC-3′ and 5′-TGACTCCTTATCCAATTTGCC-3′. Primers used to design the ALU probe spanning ~230 bp of the consensus human ALU sequence were 5′-GTGGCTCACGCCTGTAATC-3′ and 5′-GATCTCGGCTCACTGCAAC-3′. Purified cDNA for APP and GPR84 were used as probe sequences. Probes for Southern blotting were labeled by random priming using the Prime-It II Random Primer labeling kit (Stratagene). Signal intensity was determined by exposing 32P-hybridized membranes to a phosphor screen with subsequent scanning using the Typhoon 8600 imager (Molecular Dynamics).
Quantitative PCR
Real-time qPCR was used to quantify gene copy number from human brain and lymphocyte genomic DNA. The primer sets for LPA4 consisted of LPAF (5′-CACAGAAATCATGGATGGAAGG-3′) and LPAR (5′-CTGGGTCTGAGGCTTGAATTTG 3′) and the primer set for SRY consisted of SRYF (5′-TTTCGAACTCTGGCACCTTTC-3′) and SRYR (5′-CTGTTTTCTCCCGTTTCACAC-3′). Primers were synthesized by Integrated DNA Technologies. qPCR was performed on a Rotor-Gene RG-3000 72-well thermocycler (Corbett Research) using SYBR Green JumpStart Taq ReadyMix (Sigma). All reactions were performed in triplicate. Standard curves for quantifying gene copy number were determined using purified plasmid DNA (pGemT) containing a single copy of the gene of interest. For copy number quantitation, serial dilutions of plasmid DNA were used to construct standard curves for LPA4 (R2 = 0.9961) and SRY (R2 = 0.9972). DNA concentrations were converted to gene copy number by calculating the weight (in g/mol) of the plasmid and insert used for generating the standard curves, and converting this into copy number (g/molecule) using Avogadro’s number (mol/molecule).
Statistical analysis
For DNA content FCM, DNA indices were determined as described in the Results section. P values (for DNA indices, CV and SKW values of cortical and cerebellar populations) were determined using an unpaired, two-tailed t-test. For QPCR analysis, copy numbers were determined using the standard curve method. For NeuN FACS and PNA FISH experiments, P values were determined using an unpaired, two-tailed t-test. Differences between groups were considered statistically significant when P < 0.05.
Results
To assess DNA content from cells of the human brain, a modified protocol for measuring DNA content using Flow Cytometry (FCM) and Fluorescence Activated Cell Sorting (FACS) was developed that relied on isolation of intact cellular nuclei to eliminate difficulties associated with the brain’s interconnected cells (Levitt et al., 1997). Control procedures and experiments were pursued to eliminate trivial explanations or artifactual data and included consideration of nuclear RNA/RNase treatments, varying nuclei density, autofluorescence, discrimination of intentionally mixed nuclei populations, internal DNA standards, propidium iodide concentrations and staining protocols, and reproduction of the results with a chemically and mechanistically distinct DNA binding dye, DRAQ5 (Smith et al., 2000). DRAQ5 is a UV-excitable, membrane permeable dye that binds stoichiometrically to DNA and has been used to detect DNA content in leukocytes by FCM (Swerts et al., 2007; Yuan et al., 2004). Nuclear DNA content of isolated, fixed human lymphocyte nuclei (LYM, N=8) stained with propidium iodide (Crissman and Steinkamp, 1973) recapitulated whole-cell FCM (data not shown), and this preparation served as a euploid, internal reference sample along with a second standard, chicken erythrocyte nuclei (CEN) (Vindelov et al., 1983b). These standards were compared to large cohorts (minimum of 10,000 nuclei per sample) of non-diseased human brain cell nuclei from the cerebellum (CB, N=8) and frontal cortex (FCTX, N=24) of different individuals controlled for age and sex (Fig. 1). The total number of nuclei assessed in this study represents several orders of magnitude greater coverage than any previously published study assessing genomic variation in the CNS.
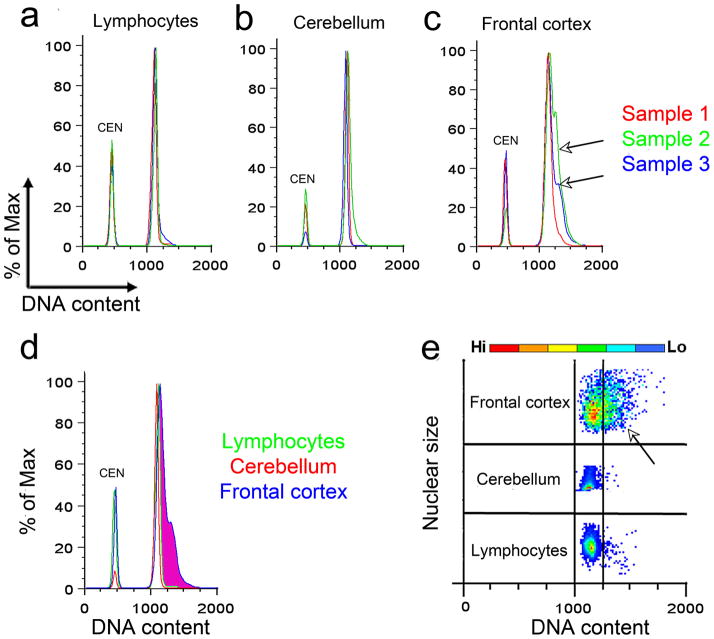
As anticipated, lymphocyte and cerebellar samples showed nearly identical, superimposable DNA content histograms with smooth, sharp peaks and thin bases (Fig. 2a and b). Surprisingly, and in marked contrast, DNA content histograms from frontal cortical cell nuclei of different individuals (Fig. 2c) deviated in shapes, peaks, and base widths. These differences were apparent in histogram overlays comparing frontal cortical nuclei to lymphocyte nuclei (Fig. 2d). Moreover, cerebellar DNA content histograms, from the same brain as the examined frontal cortex, were themselves distinct, resembling lymphocyte histograms. Cortical histograms typically showed peaks with additional right-shoulders and widened bases, indicative of increased DCV. A top-down orthogonal view of the histograms (Fig. 2e) provides similar perspectives (as in Fig. 2d).
Figure 2. DNA content analysis of non-diseased human nuclei by flow cytometry.
a-c: Representative DNA content histograms from three samples of human lymphocyte (a), cerebellar (b), and human frontal cortical (c) nuclei (red, blue, and green are separate individuals for lymphocytes, cortex, and cerebellum) stained with propidium iodide (PI) and analyzed by FCM. Chicken erythrocyte nuclei (CEN) were included as an internal reference standard and control. Human lymphocytes and cerebellar samples demonstrated homogeneous and qualitatively indistinguishable histograms, while cortical samples displayed heterogeneous histograms with broad right-hand shoulders (lower black arrow, blue cortical histogram in c) and right-hand sub peaks (upper black arrow, green cortical histogram in c). d: Overlay of one representative lymphocyte (green), cerebellar (red), and cortical (blue) histogram identifies an area of increased DNA content uniquely within the cortical sample (magenta). While lymphocytes and cerebellar nuclei histograms were indistinguishable, cortical nuclei always contained populations with increased DNA content and more complex DNA histogram shapes. e: Orthogonal view of the DNA content histograms in which DNA content is plotted against nuclear size identifies the prevalence of nuclei having a given DNA content (prevalence is plotted using a color code where red signifies a large number of nuclei (Hi) and blue signifies a lesser number of nuclei (Lo)) along with scatter. Each scatter plot is only valid for the assessed sample. Vertical black bars serve as local reference lines encompassing expected DNA content for normal cells, beyond which nuclei with increased DNA content can be seen most prominently in the cortical sample (black arrow).
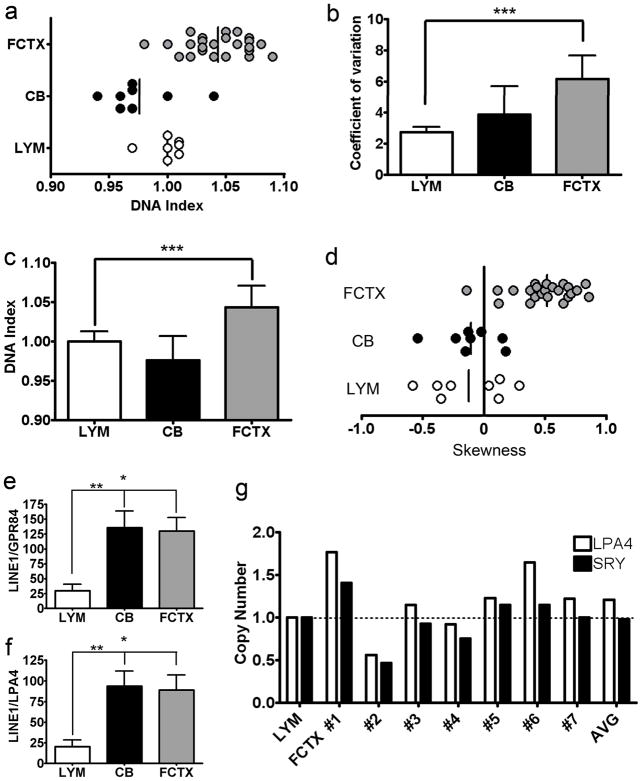
The DNA index (DI) (Darzynkiewicz and Huang, 2004) of each sample was calculated, defined as the ratio of the brain G0/G1 peak to that of the lymphocyte G0/G1 peak, normalized to an internal control (CEN). The G0/G1 peak is the main peak (Fig. 3c, g, and k) containing cells (or nuclei) in the G0/G1 phase of the cell cycle. The average DI of human cortical cell nuclei was always higher than either lymphocyte or cerebellar samples (1.04 in cortical nuclei compared to 0.98 and 1.0 for cerebellar and lymphocyte samples, respectively, P = 0.002 for FCTX vs. LYM and < 0.0001 for FCTX vs. CB) (Fig. 4a and c). Cortical samples also exhibited greater coefficients of variation (CV; Fig. 4b). Deviation of each DNA content histogram from a Gaussian distribution was calculated as “skewness (SKW)” defined as the [(meanDNA content − modeDNA content)/standard deviation for each sample] (Aldhous et al., 1994). While lymphocyte and cerebellar samples contained near-zero or negative SKW values, cortical samples showed predominantly positive SKW values indicating increased DNA content (Fig. 4d). The average increase in DNA content between the frontal cortex and lymphocytes was ~4% (with a range of −2 to 9%) of an approximately 6000 Mb, 2N diploid genome, or ~250 Mb. By comparison, a 3N signal would have produced a 50% increase in DNA content – an additional 3000 Mb – which was never observed, while 4N peaks of 100% increase were also observed, consistent with the known presence of mitotic, non-neuronal brain cells. Hypothesized genomic origins of the increased cortical DNA were assessed by Southern blotting of L1 (LINE1) repeat sequences, relative to two single copy genes, GPR84 on chromosome 12 and LPAR4 on the X chromosome (Venter et al., 2001). L1 repeats are interspersed throughout the genome (Kazazian and Goodier, 2002). Therefore, genomic origins of DCV would be expected to maintain relative L1 copy number representation rather than reducing it by dilution with non-L1-containing DNA as would occur with viral or mitochondrial sources that do not contain L1 repeat elements. Using this approach, a consistent level of repeat sequence representation was observed for L1 in cortical samples, arguing against massive, non-genomic contributions to DCV. Interestingly, the representation of L1 sequences in cerebellar samples was indistinguishable from frontal cortical samples, both of which were significantly greater than lymphocyte samples, despite similar global levels of DNA content present in cerebellar vs. lymphocyte samples as identified by FCM (Fig. 4e and f). These data further suggested qualitative differences in DCV for lymphocytes as compared to neural nuclei, based upon relative L1 representation. Quantitative PCR (QPCR) analysis further revealed increased single-copy gene signals within cortical samples relative to lymphocytes (Fig. 4g), supporting sub-genomic increases of DNA loci relative to single-copy genes (shown for the genes LPAR4 and SRY from male samples). Of note, there was no appreciable correlation between age and DI in our samples, analyzed within tissue regions, or all together (Fig. 5).
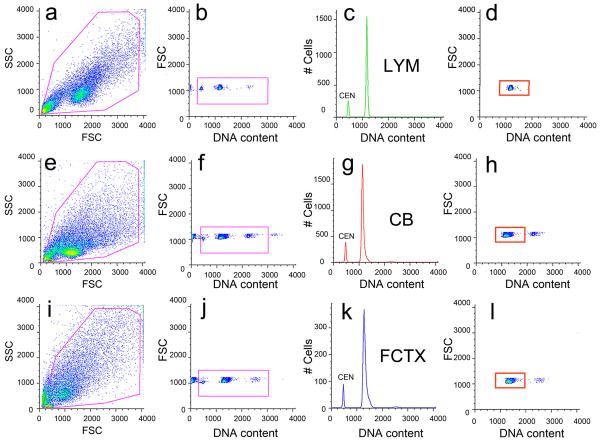
Figure 3. Electronic gating protocol and DNA index calculation for human nuclear samples stained with propidium iodide and analyzed by flow cytometry.
Human lymphocyte (a–d, LYM), cerebellar (e–h, CB), and frontal cortical (i–l, FCTX) nuclei were isolated, stained with propidium iodide and treated with RNaseA for a minimum of 90 minutes prior to analysis by FCM. Chicken erythrocyte nuclei (CEN) were included as internal controls to eliminate calibration errors. All nuclei (a,e,i) were gated (magenta boxes throughout figure) on forward scatter (FSC), a measure of nuclear size, and side scatter (Brasseur et al.), a measure of nuclear granularity, to remove nuclei doublets. DNA content was assessed using propidium iodide stained nuclei (b,f,j) to generate DNA content histograms (c,g,k) and orthogonal, top-down histogram views (d,h,l), which plotted nuclear size against DNA content in a pseudo-colored dot plot (blue shades represent few events and red shades indicate the majority of events). Representative gating protocols analyzing lymphocytes (a–d) were repeated for cerebellar (e–h) and cortical (i–l) samples. Mean DNA content values for a ‘diploid’ histogram were obtained from the gate delineated by the orange rectangle in d, h, and l in which only the lymphocyte DNA content is shown. In order to determine DNA index values for each sample, this mean DNA content value was compared to an average of the sex-matched lymphocyte samples to obtain a ratio. For example, if the mean value of male brain sample #1 was 1213 and the mean value for male lymphocytes was 1166, the DNA index for brain sample #1 would be 1213/1166 = 1.04.
Figure 4. Quantitative analysis of DNA content in non-diseased human nuclei.
a: Individual DNA indices for human lymphocyte (LYM), cortical (FCTX), and cerebellar (CB) nuclei samples. The DNA index was determined by comparing the mean DNA content value for brain nuclei to the average of the sex-matched lymphocyte samples to obtain a ratio. b: Higher coefficient of variation (CV) values were seen in human cortical samples (6.18 mean, 3.43-9.90 range) compared to cerebellar (3.86 mean, 2.20-6.69 range), and lymphocyte (2.73 mean, 2.20-3.25 range) samples (P < 0.0001). c: Average DI for each sample group (1.0 for lymphocytes, 0.98 for cerebellum, and 1.04 for frontal cortex). The cortical group had a higher mean DI than both lymphocyte and cerebellar sample groups (P = 0.0002). d: Human cortical samples show increased skewness (SKW) values (0.516 mean) compared to lymphocyte (−0.125 mean) and cerebellar samples (−0.106 mean) (P < 0.0001). SKW values were determined by using the formula SKW = mean DNA content mode DNA content/ standard deviation for the ‘diploid’ peak of each sample. Individual cortical samples with high SKW values displayed prominent right histogram shoulders (Fig. 2c). While lymphocytes and cerebella SKW values were near 0 or negative, 23/24 cortical samples had a positive SKW value. e, f: Comparative autoradiography of genomic Southern blots from different, human nuclear populations. Human cortical (N=20) and cerebellar (N=8) genomic DNA samples probed with an L1 repeat element produced a respective 4.4 (P < 0.05) and 4.6-fold (P < 0.01) increase in the ratio of L1 repeat sequences compared to single copy gene (GPR84, Chr. 12) probing of the same DNA samples, contrasting with human lymphocyte DNA (N=7). A similar result was obtained using a different single copy gene (LPAR4, X chromosome). The similar cerebellar and cortical ratios supported a genomic origin for cortical DCV. g: quantitative PCR (QPCR) analysis of sex chromosome loci from human lymphocyte, cerebellar, and cortical genomic DNA. The relative gene copy number of LPAR4 and SRY (on the Y chromosome) was determined from male lymphocytes (set to a value of 1.0 as a reference) and cortices (FCTX #1-7). Relative gene copy numbers of LPAR4 and SRY ranged from 0.47 (SRY in Sample #2) to 1.77 (LPAR4 in Sample #1) in cortical samples, with the average SRY copy number being 0.98, compared to the LPAR4 copy number of 1.25. For panels a–g: * P < 0.05, ** P < 0.01, *** P < 0.001.
Figure 5. The effect of age on the DNA index of human brain samples.
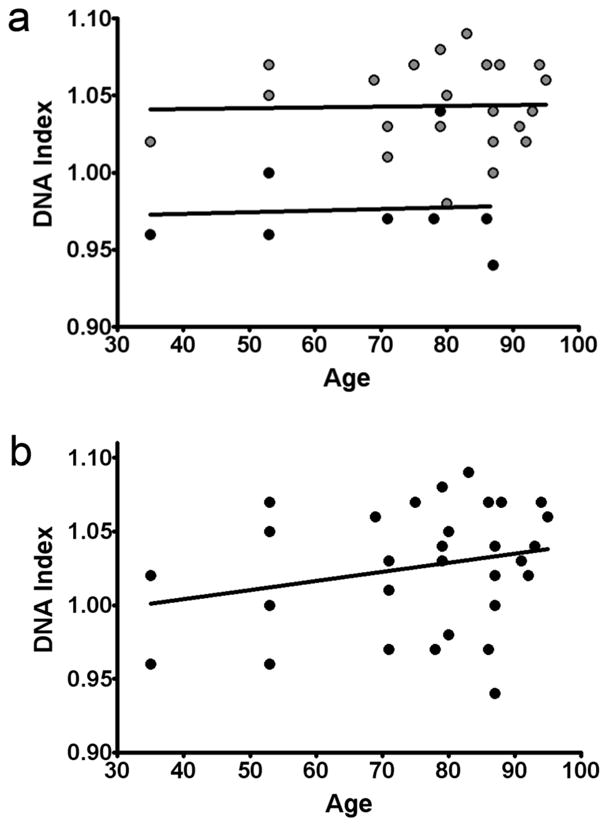
a: DNA indices of nuclear samples from human frontal cortex (FCTX, grey dots) and cerebellum (CB, black dots) plotted against age. Linear regression analysis (black lines) revealed no correlation between age and DNA index in the frontal cortex (P = 0.8964 for a non-zero slope) or cerebellum (P = 0.8872 for a non-zero slope). b: DNA index of nuclear samples from human frontal cortex and cerebellum (black dots) plotted against age (the samples shown in b are the same samples as in a, but analyzed as a single group). Linear regression analysis (black line) revealed no correlation between age and DNA index when cortical and cerebellar samples were analyzed as a group (P = 0.1701 for a non-zero slope).
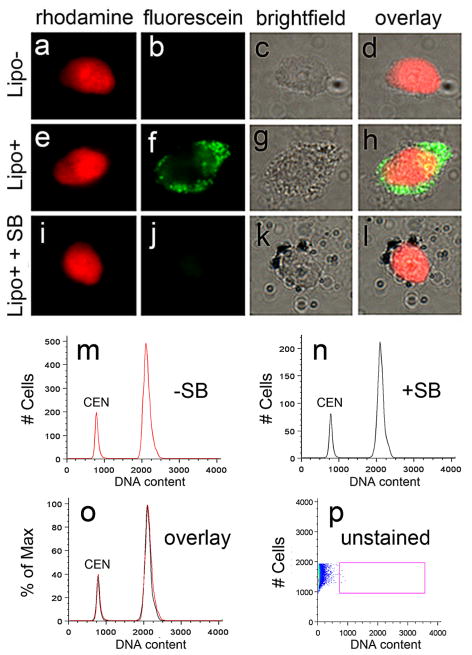
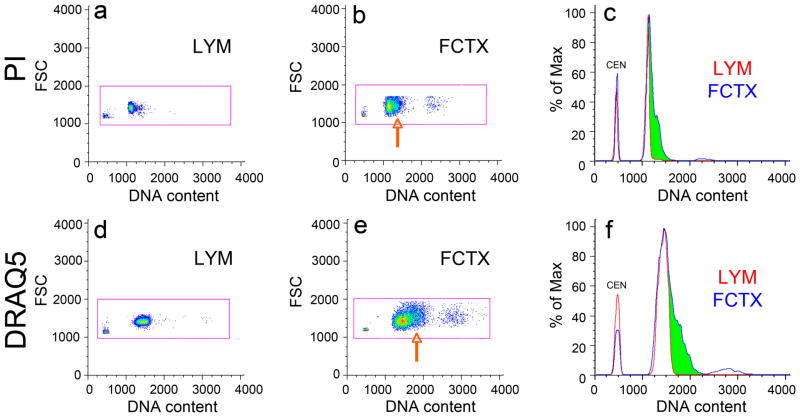
One possible artifact that could contaminate data collected by FCM/FACS is autofluorescence, particularly in analyzing aged neurons within which lipofuscin is known to accumulate. Lipofuscin is a broad-spectrum autofluorescent pigment seen in both rhodamine and fluorescein channels that accumulates, particularly at the nuclear periphery in some aging neurons (Riga and Riga, 1995). This possible contribution of lipofuscin to FCM/FACS signals was assessed (Fig. 6). No relevant signal from unstained nuclei (Fig. 6p, unstained) was observed in the PI (or DRAQ5, data not shown) channel, demonstrating that the presence of lipofuscin does not contribute to fluorescence signals detecting DNA content in human brain nuclei. A related control examined the effect of different DNA binding dyes on DNA content (Fig. 7) by comparing propidium iodide to the DNA minor groove binding dye DRAQ5 (Smith et al., 2000). Labeling nuclei with both dyes produced similar right-hand shoulders in the frontal cortical samples while appropriately labeling internal controls. The identification of cortical DCV with DRAQ5 also further ruled-out any contribution of lipofuscin autofluorescence to DNA content signals, since lipofuscin is minimally fluorescent in the far-red spectra (633 nm) that was used to excite DRAQ5 (Dowson, 1982).
Figure 6. The effect of lipofuscin autofluorescence on human brain DNA content histograms.
Lipofuscin is a broad-spectrum autofluorescent pigment seen in both rhodamine and fluorescein microscope channels that accumulates at the nuclear periphery in some aging neurons and might contribute autofluorescent signals in DNA content flow cytometry experiments (Riga and Riga, 1995). This possibility was assessed on nuclei with low lipofuscin (a–d, Lipo-) vs. high lipofuscin (e–h, Lipo+) pigment levels, stained with PI (red); Lipo+ nuclei were visible in a fluorescein channel (green). Autofluorescence from lipofuscin can be minimized with the addition of the lipophilic dye, Sudan Black (i–l, SB), which preferentially binds to lipofuscin granules (black particles in k and l) (Schnell et al., 1999) and quenches the autofluorescent signal, and then is visualized by brightfield microscopy. SB staining was used in initial experiments; however further analyses demonstrated that it was not necessary (m–o), wherein the addition of SB to human brain nuclei prior to FCM did not significantly alter DNA content histograms (SB- (red histogram), SB+ (black histogram), and overlay). Importantly, when unstained isolated nuclei were analyzed by FCM, no signal from lipofucsin alone (p, unstained) was observed in the PI (or DRAQ5, data not shown) channel indicating that the presence of lipofuscin does not contribute to fluorescence signals in DNA content FCM of human brain nuclei. Scale bar = 5 μm in a–l.
Figure 7. The effect of distinct DNA binding dyes on DNA content histograms.
Isolated human lymphocyte and cortical nuclei spiked with chicken erythrocyte nuclei (CEN) and stained with the DNA intercalating dye propidium iodide (PI, a–c) or the DNA minor groove binding dye, DRAQ5 (d–f) (Smith et al., 2000), were analyzed by FCM. A similar right-hand shoulder in the frontal cortical sample was seen using both dyes in either an orthogonal, top-down view (orange arrowheads in b and e) or a histogram view (green shading in c and f). Similar results were seen with all other paired samples examined, indicating that similar DCV patterns are seen with distinct DNA binding dyes having different DNA binding characteristics. The identification of cortical DCV with DRAQ5 also further ruled-out any contribution of lipofuscin autofluorescence to DNA content signals, since lipofuscin is minimally fluorescent in the far-red spectra (633 nm) used to excite DRAQ5 (Dowson, 1982).
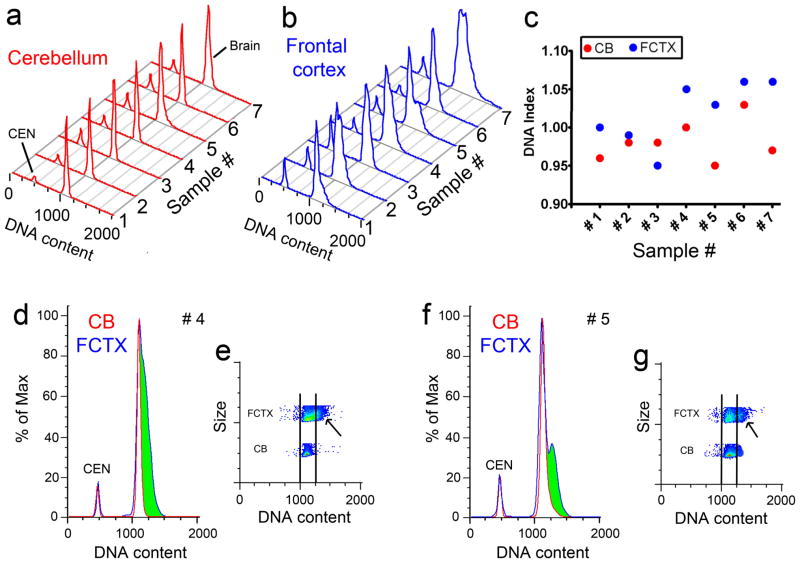
A striking difference was identified in comparing DNA content histograms between different brain regions of the same individual (Fig. 8a and b). DNA content was analyzed pairwise in seven individuals for cortical vs. cerebellar samples. All samples were run blind to identity. Each resultant DNA content histogram was quantitatively distinct, most notably within cortical samples, with distinguishable histogram shapes that further underscored differences between cortex and cerebellum; 6 of 7 samples showed clearly increased cortical DNA (Fig. 8c) as marked by a broad, right-hand domain (green shading in samples #4 and #5 in Fig. 8d and f) consisting of nuclei with higher DNA content. These data demonstrated that DCV can vary between neuroanatomically and neuroembryologically different regions of the same brain.
Figure 8. DNA content analysis of cerebellar and cortical nuclei from the same individuals.
Pairwise analysis of DNA content histograms in the same individuals (Samples #1-7, each sample represents a unique individual) from the cerebellum (a: CB, red) vs. frontal cortex (b: FCTX, blue), with CEN included as an internal control. FCM histograms from the cerebellum and cortex of the same individual were non-identical, as shown by broader and more complex peaks in cortical samples. c: In 6 of 7 individuals, the cortical DNA index (red filled circles) was higher than the cerebellar DNA index (blue filled circles). In d–g, examples of non-identity between DNA content histograms from cerebellar (CB, red) and cortical (FCTX, blue) nuclei for individuals #4 (d–e) and #5 (f–g). The cortical sample from individual #4 had a broad peak, with nuclei showing increased DNA content (green shading in d), while the cortical sample in individual #5 showed a prominent sub-peak of nuclei with increased DNA content (green shading in f). An orthogonal view of DNA content plotted against nuclear size as a pseudo-color plot (red represents high nuclei numbers and blue represents low nuclei numbers; see Fig. 2) is shown for cerebellar and cortical samples #4 (e) and #5 (g) with black lines included as DNA content references. In this view, the green right-hand shoulder/sub-populations seen in the classical histogram view are clearly discernable in the cortical samples (black arrows in e and g).
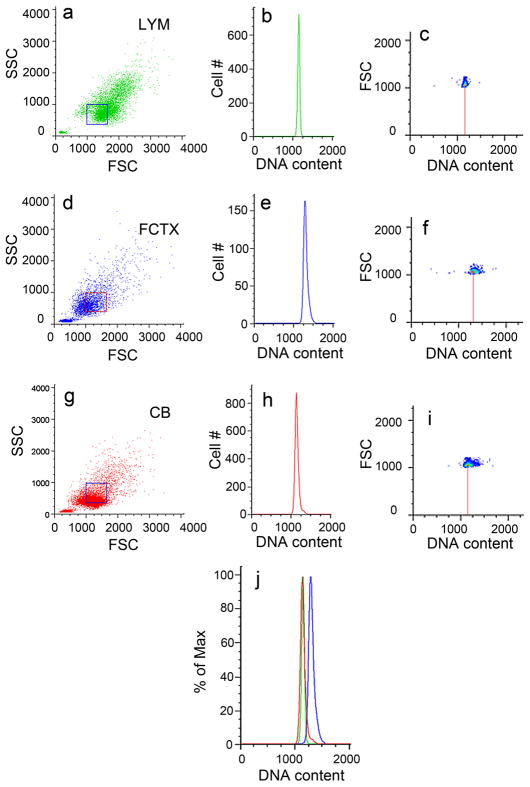
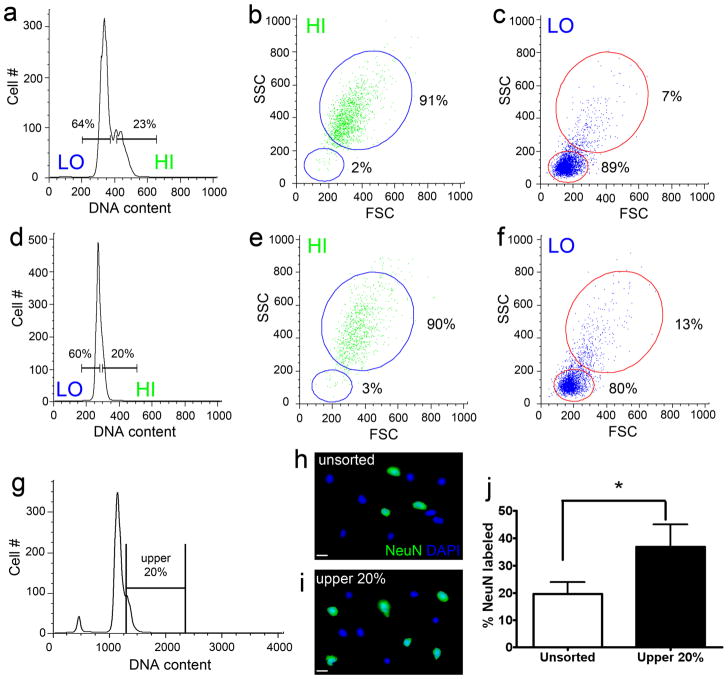
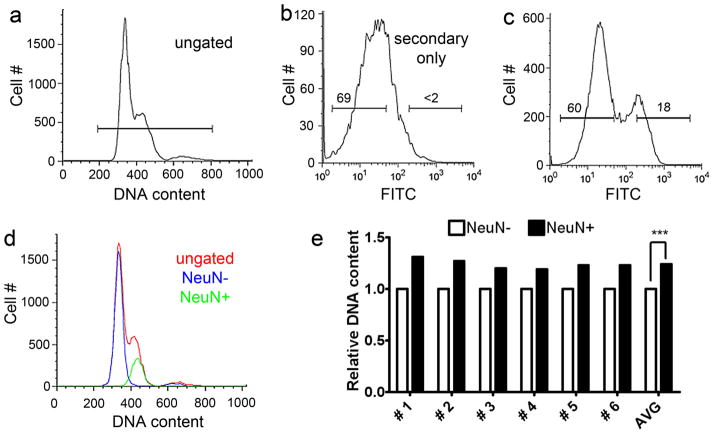
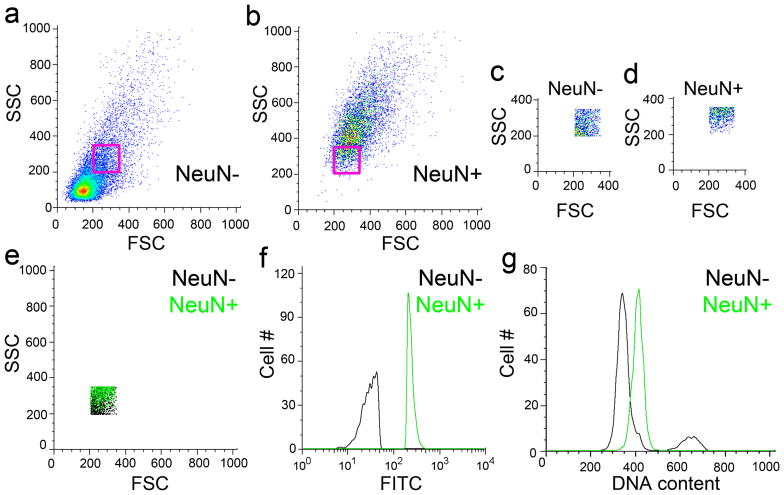
Neurons are postmitotic and phenotypically distinct from glial/other non-neuronal cells in the brain. Initial studies using backgating analysis to determine the size of nuclei within the cortical histogram shoulders indicated that nuclei with increased DNA content were generally larger (Fig. 10), yet controls for nuclear size using intermixed large and small nuclei derived from whole human blood (Fig. 9) and a DNA content comparison of comparably sized human cortical, cerebellar, and lymphocyte nuclei (Fig. 10) demonstrated that DNA content was independent of nuclear size. These results suggested that neurons, known to have larger nuclei amongst cortical cells (Dombrowski et al., 2001; Knusel et al., 1973), might be enriched in populations with increased DNA content. To determine whether DCV differed in this postmitotic population, FCM and NeuN (a neuron-specific nuclear antigen) immunolabeling were combined to analyze neurons. NeuN+ nuclei were found about twice as often in populations of nuclei sorted from the right shoulders of histograms as compared to unsorted nuclei (Fig. 11). FACS of NeuN+ nuclei further identified an increased DI of NeuN+ relative to NeuN- nuclei in all samples analyzed (Fig. 12) (Mullen et al., 1992). In general, neuronal nuclei tended to be larger than non-neuronal nuclei. However, even when taking nuclear size into account by analyzing NeuN+ and NeuN- nuclei with similar dimensions, the DI of NeuN+ nuclei was still higher than NeuN- nuclei (Fig. 13).
Figure 10. DNA content analysis of similarly sized nuclei from different brain regions and lymphocytes by FCM.
Backgated fractions of similarly sized (boxed regions) human nuclei from lymphocytes (green, a–c), frontal cortex (blue, d–f), and cerebellum (red, g–i) stained with propidium iodide and analyzed by FCM. Backgates were drawn from dot plots of nuclear size (FSC) and granularity (Brasseur et al.) in a, d, and g. Lymphocytes and cerebellar nuclei show overlapping DNA content histograms, while similarly sized cortical nuclei show increased DNA content in the orthogonal, top-down views (red vertical line from population mode in c, f, and i) and overlay view (j). These data indicate that nuclear size does not affect DCV.
Figure 9. DNA content of leukocyte populations with different physical characteristics.
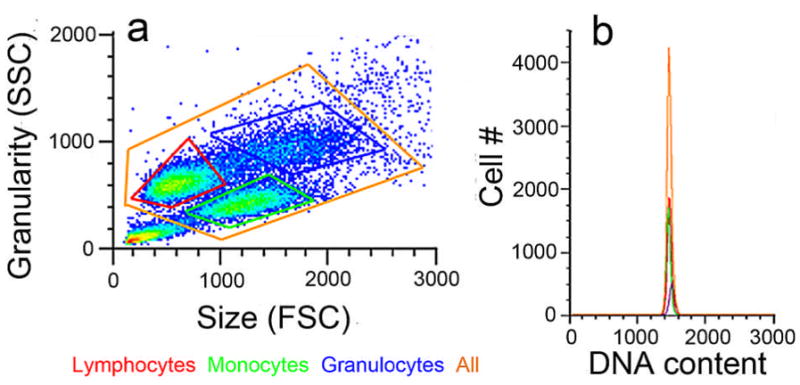
Human leukocytes gated into different populations (a) based on size and granularity (lymphocytes, red; monocytes, green; granulocytes, blue; and all nuclei, orange) show overlapping DNA content histograms (b). These results indicate that nuclear size is independent of DNA content values.
Figure 11. Backgating analysis and immunolabeling of human cortical nuclei.
Histograms with a prominent DCV shoulder (a) or no-shoulder (d) from human cortical nuclei stained with propidium iodide were backgated on the basis of DNA content fluorescence into lower 60% (LO) and upper 20% (HI) fractions. HI and LO fractions were then analyzed for physical nuclear characteristics (plotted as nuclear size (FSC) against nuclear granularity (SSC) (Brasseur et al.)). Backgating analysis of these populations revealed that HI nuclei (b and e) were generally larger and more granular than LO nuclei (c and f) in histograms with shoulders and normal histograms (91% large/high granularity nuclei and 2% small nuclei/low granularity in HI (b) vs. 7% large/high granularity nuclei and 89% small/low granularity nuclei in low (c) for the histogram with a shoulder). Percentages refer to the percent of the backgated nuclei that fall within the large or small nuclear populations. (g) FACS was used to isolate the upper 20% of the nuclei based on DNA content from propidium iodide stained cortical nuclei. (h-i) FACS isolated nuclei were then immunolabeled for the neuronal marker, NeuN (green). The percentage of NeuN immunolabeled nuclei in the upper 20% was 1.9 fold that of the percentage of unsorted nuclei (j: N = 4, P = 0.0101). These results indicate that at the upper end of the DNA content histograms in cortical samples, there are more neurons, which tend to be large and granular. Scale bar = 10 μm in h–i.
Figure 12. DNA content analysis of NeuN immunolabeled nuclei from the non-diseased frontal cortex.
a–c: Human brain nuclei were isolated from post-mortem samples, immunolabeled for NeuN and stained with the non-spectrally overlapping DNA dye, DRAQ5. All DRAQ5 positive nuclei (a) were gated on NeuN immunoreactivity (c) and analyzed for DNA content. Gates (horizontal lines in the top 2 histograms) for the NeuN+ and NeuN- populations were determined using nuclei exposed to the secondary antibody alone (b, full gating parameters are shown in Fig. 3). Numbers above the gates represent the percentage of nuclei falling within the gate. NeuN positive nuclei (green histogram in d) had higher DNA contents than NeuN negative nuclei (blue histogram in d), however both histograms fell within the ungated DRAQ5+ population (red histogram in d). Note: A representative example is shown in a–d, N = 6 samples analyzed in total. Quantitative analysis (e) of the DNA content of NeuN+ nuclei compared to NeuN- nuclei for the 6 samples analyzed (NeuN- samples set to 1.0 as a reference), revealed a ~33% increase in DRAQ5 intensity in NeuN+ nuclei (black bars), with every sample showing increased DNA content in neuronal nuclei relative to non-neuronal nuclei (white bars).
Figure 13. Nuclear size and DNA content in NeuN-labeled cortical nuclei.
Nuclear fractions of similar size (magenta boxes in a and b) of NeuN negative (a magnified view of the nuclear fraction within the magenta box is shown in c and d for NeuN negative and NeuN positive nuclei, respectively) and NeuN positive (e-g) DRAQ5-stained human cortical nuclei analyzed for NeuN labeling (f) and DNA content (g). Similarly sized nuclei from a and b maintained separation of the NeuN label (FITC in f), while NeuN positive nuclei (green histogram in g) contained more DNA than similarly sized NeuN negative nuclei (black histogram in g). These data argue that even in a population of similarly sized nuclei, neurons contain more genomic DNA than non-neuronal nuclei.
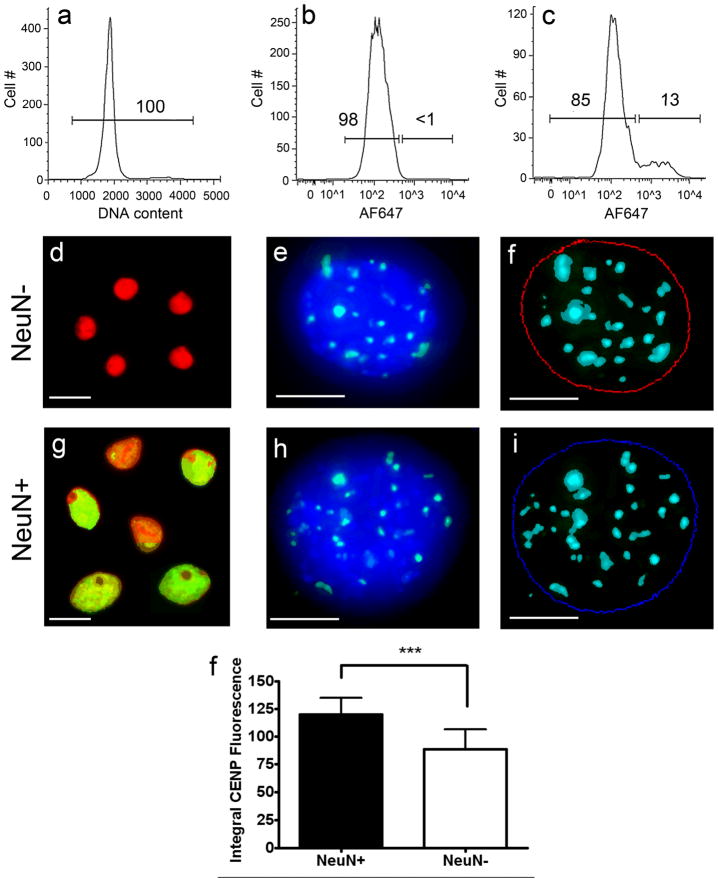
To further assess a genomic origin for DCV, quantitative fluorescence of fluorescently labeled peptide nucleic acid (PNA) probes against human centromere repeats (CENP-B box) that are structural DNA sequences on chromosomes (Masumoto et al., 2004) was employed. NeuN+ nuclei showed higher levels of CENP-B fluorescence than non-neuronal nuclei (average of 25%, N = 4), supporting increased prevalence of chromosomal organization elements, consistent with increased, genomic DNA content (Fig. 14). These data indicated that, on average, human neurons have more genomic DNA than non-neuronal cells.
Figure 14. Peptide nucleic acid (PNA) FISH analysis of FACS sorted nuclei.
Human cortical nuclei were stained with the DNA dye, propidium iodide (PI), and immunolabeled with the neuronal marker NeuN prior to PNA FISH. NeuN was detected using an Alexa Fluor 647 (AF647) labeled secondary antibody. Using FACS, all PI stained nuclei (a) were sorted into NeuN positive and NeuN negative populations (c) based on the NeuN secondary antibody-alone control (b). Numbers shown on the plots refer to the percent of the nuclei that fall within the gated populations. Purified neuronal (g–i) and non-neuronal (d–f) nuclear populations were subjected to FISH using CENP-B box sequence specific peptide nucleic acid (PNA) probes (green signals in e and h). Z-stack images of each nucleus were acquired using deconvolution microscopy (McNally et al., 1999) and the resulting images were projected to form a pseudo-three dimensional image (e and h). Thresholds for DAPI fluorescence and PNA probe fluorescence were set using MetaMorph analysis software to quantitate integral PNA fluorescence within the DAPI borders of each nucleus (blue and red circles in f and i). A minimum of 30 nuclei were analyzed for NeuN positive and NeuN negative fractions for each of 4 samples. NeuN positive nuclei had a ~36% increase in CENP-B fluorescence relative to NeuN negative nuclei (j, P < 0.0001). These results provide further evidence that the additional DNA seen in neuronal nuclei relative to non-neuronal nuclei by DNA content FCM/FACS, Southern blotting, and QPCR is genomic in origin. Scale bars = 10 μm in d, g and in 5 μm in e, f, h, i. A magenta green version of this figure has been posted as a supplementary file.
Discussion
This study identifies a new feature of the human brain: cells with DNA content variation (DCV). It exists on a large scale and manifests most prominently as increased DNA content and range in neurons compared to non-neuronal cells, with greater DCV in cells from the frontal cerebral cortex compared to the cerebellum of the same brain. It also appears to be distinct amongst individuals. The utilized methodologies to determine DCV are well established and in current use to assay DNA content in a wide range of cell lines and types, and were here optimized for the adult human brain. Classical FCM/FACS for DNA content requires single-cell suspensions (Nunez, 2001); however the adult brain does not lend itself to such suspension, reflecting in part its high degree of complex interconnectivities that have prevented prior, extensive DNA content analyses of intact brain cells by FCM or FACS. The use of isolated cell nuclei as well as the use of chemically distinct DNA dyes (PI and DRAQ5) produces the same general results arguing in toto against non-DNA content explanations for DCV. Critically, the multiple controls used here that include lymphocytes and CEN, are consistent with the prior literature on DNA content analyses, demonstrating that DNA content was indeed detected with the same fidelity as in previous studies (Bergers et al., 1996; Bruner et al., 1993; Danova et al., 1987; Darzynkiewicz and Huang, 2004; Laerum and Farsund, 1981; Muehlbauer and Schuler, 2005; Vindelov et al., 1983a). Moreover, assessments of repeat element hybridization, QPCR analyses and CENP-B fluorescence, each independent of FCM/FACS, are consistent with genomic origins of increased DCV.
Historically, studies using less sensitive techniques have reported polyploidy in Purkinje neurons (Lapham, 1968), although modern techniques have not substantiated these early reports (Del Monte, 2006). The sub-genomic increase in DNA content, averaging ~250 Mb observed here in the frontal cortex, have not been previously reported and are inconsistent with polyploid DNA content. The origin of the additional DNA in cortical nuclei appears to be genomic; while we cannot eliminate all non-genomic sources such as unidentified DNA viruses, the high viral copy numbers needed to account for ~250 Mb that affects large populations of normal cells make this mechanism seem unlikely. In a similar vein, active L1 retrotransposition has been reported in rat neuroblasts (Muotri et al., 2005) and human neural progenitor cells (Coufal et al., 2009) which could theoretically increase DCV. However, active L1 retrotransposition has not thus far been shown to occur in human postmitotic neurons, while the small size of an active retrotransposon (~6 Kb), similar to a retroviral provirus, would require an additional 40,000+ copies/neuron to produce a 250 Mb DNA content increase. It is notable that different levels of L1 elements have been reported amongst tissues of the same individual, including increased representation in frontal cortex compared to the cerebellum (Coufal et al., 2009), consistent with a previous report of a similar LINE-like element that showed increased brain representation over other tissues (Yokota et al., 1989), and having an unclear relationship to active retrotransposition. While the formal relationship between DCV and possibly active retrotransposition of L1 remains uncertain, the L1 levels determined here (Fig. 4e and f) were not distinguishable between frontal cortex and cerebellum, despite their marked differences in DCV, which argues against L1 elements as a primary source of increased DCV in the frontal cortex.
Prior studies on the ploidy of mouse lymphocytes indicated that this population has ~10% of the aneuploidy observed in neural progenitor cells (Rehen et al., 2001), suggesting a distinction between these mitotic cell types in their ability to tolerate genomic variation involving chromosomal gains and/or losses. A related cell lineage effect may in part explain the DCV differences observed here between human peripheral blood lymphocytes and postmitotic neurons from the cerebral cortex. In view of the DCV similarities between human lymphocytes and cerebellar neurons, this difference is not likely to reflect the postmitotic state; however postmitotic cortical neurons may be able to tolerate and presumably utilize DCV throughout the life of the cell compared to mitotic lymphocytes or the neuroembryologically distinct neurons of the cerebellum.
There have been previous, controversial reports of cell cycle reactivation with DNA synthesis in neurons of adult mammals in both normal and diseased settings (Gould et al., 1999; Yang et al., 2001); however our data do not support classical cell cycle mediated events (Storchova and Pellman, 2004) in view of the ~4% (250 Mb) average increase in DNA content seen in frontal cortical neurons. Furthermore, studies measuring radioactive carbon in neuronal cells from post-mortem brain samples of individuals exposed during neurogenesis to atomic bomb testing did not detect an appreciable amount of de novo DNA synthesis in neurons (Bhardwaj et al., 2006; Spalding et al., 2005). However, it is notable that the frontal cortex was not examined in these studies, while the possibility of sub-genomic DNA synthesis might further be below detectable limits of such approaches. Postnatal nucleotide incorporation has been reported in the primate frontal cortex and is formally consistent with sub-genomic, de novo DNA synthesis in neurons that might be distinct from neurogenesis (Gould et al., 1999; Rakic, 2002). This possibility requires further assessment.
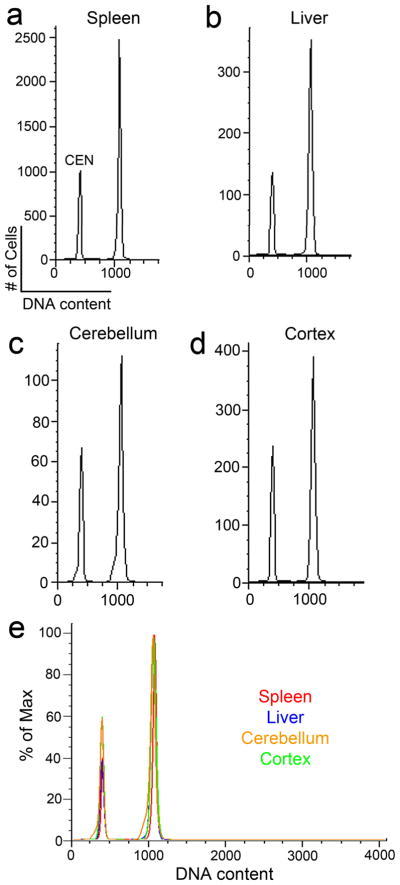
Aneuploidy, defined as a chromosome complement that deviates from haploid multiples (Rajagopalan and Lengauer, 2004), can be produced during neurogenesis and is prevalent in the vertebrate brain where it might theoretically account for major DCV forms. Indeed, this is likely to be an important subset of DCV, since it exists throughout the neuraxis (Rehen et al., 2001; Westra et al., 2008). However, aneuploidy is unlikely to account for the major DCV differences producing increased DNA content observed in the human frontal cortex since hypoploidy – chromosome and thus DNA loss – is the most common form of demonstrated neural aneuploidy (Rehen et al., 2001; Yang et al., 2003; Yurov et al., 2007) which contrasts with the observed average increase in DNA content in the frontal cortex. As notable is the existence of aneuploidy throughout the neuraxis in both neurons and glia that contrasts with the increased representation of DCV in neurons. Moreover, neural aneuploidy has been documented in all examined vertebrates, whereas the extent of DCV in mouse tissues is not of the same magnitude as detected by the same methodologies used to identify human DCV (Fig. 15). Therefore, the combination of increased DNA content, species variability, neuronal enrichment, and neuroanatomical variation does not support neural aneuploidy as a primary mechanism for the increased DCV observed here in the human frontal cortex.
Figure 15. DNA content analysis of murine tissues by FCM.
Individual DNA content histograms from a representative sample of murine spleen (a), liver (b), cerebellar (c), and frontal cortical (d) nuclei (from the same animal) were stained with propidium iodide and treated with RNaseA prior to FCM. Nuclei were isolated and prepared in a manner similar to the analysis of human nuclei, including the addition of control chicken erythrocyte nuclei (CEN). The color-coded overlay of individual histograms in (a-d) are shown in (e), (red = spleen, blue = liver, orange = cerebellum, and green = cortex). Of note is the relative homogeneity in DNA content from the murine brain compared to the DCV found in the human brain.
Possible DCV functions include contributions to neural diversity and brain function by altering gene availability for transcriptional events or microRNAs (Guarnieri and DiLeone, 2008; Rehen et al., 2001; Torres et al., 2007). We speculate that DCV within single brains may also contribute to sporadic disease processes that preferentially affect distinct brain regions, as observed in Alzheimer’s disease, where neurodegeneration predominantly affects the hippocampus and entorhinal/frontal cortices, with relative sparing of the cerebellum (Goedert and Spillantini, 2006). It is also possible that DCV may represent cells with disease latency or potentiality that is manifested only after other conditions – e.g., injury, stress, distinct disease insults, aging – initiate or promote detectable disease through DCV elements. Alternatively, DCV might represent a reactive response to disease processes towards counteracting insults, although its prevalence in apparently normal brains might require redefining what is normal. These non-mutually exclusive possibilities remain to be experimentally assessed.
A full characterization of DCV requires further study, and thus far appears to be most notable as a gain of genomic DNA in human frontal neurons based upon the maintained representation of LINE and ALU sequences, as well as centromere signals in DCV samples, which are all indicative of genomic DNA. We speculate that this increased DNA content reflects a combination of both large-scale genome amplification – e.g., equivalent to many megabases of contiguous DNA sequence that could be duplicated one or more times – as well as more localized amplifications as seen in copy number variations (CNVs) (Freeman et al., 2006). Altered functions of mutant and wild-type genes linked to brain disease might occur in cells with differing degrees of DCV, where it could also produce alterations akin to CNVs (Sebat et al., 2004), yet doing so in a localized, somatic manner, particularly within single cells, distinct from germline or zygotic mechanisms. CNVs could well be represented within DCV, yet would also differ compared to current CNV models. These differences could include: 1) CNVs that would not be present in all somatic cells vs. the current understanding of CNVs (Freeman et al., 2006), 2) mosaic cell populations that would consist of intermixed CNV and non-CNV or variable CNV-containing cells, 3) lineage specific (e.g., neuronal vs. glial) CNVs, and 4) region-specific CNVs (e.g., cortex vs. cerebellum). Whether CNVs are indeed present within cells possessing DCV requires further analyses that must also involve next-generation DNA sequencing at a single-cell level. Additionally, as a subgenomic, DNA altering phenomenon, it would not be surprising to find related alterations within DCV sequences – rearrangements, deletions, de novo sequences – that could emerge from further analyses. Thus, future DCV studies analyzing DNA sequences, neuroanatomical distributions, lineage relationships, and functions may provide new insights into brain diseases – particularly sporadic forms – as well as neural and behavioral diversity within and amongst individuals.
Supplementary Material
Acknowledgments
We thank Alex Ilic, Quyen Nguyen, and Cody Fine at The Scripps Research Institute Flow Cytometry Core for help with FCM and FACS. J.W. was supported by the Neuroplasticity of Aging Fellowship, D.B. was supported by a University of California San Diego Department of Pharmacology Training Grant, S.P. was supported by an American Parkinson’s Disease Association Fellowship, and Y.Y. was supported by an NSF Fellowship. J.C. received support from the National Institute of Metal Health (MH076145). We thank Kristin Baldwin and Christine Westra for helpful discussions and Danielle Letourneau for editorial assistance.
J.W. was supported by the Neuroplasticity of Aging Fellowship, D.B. was supported by the University of California San Diego Department of Pharmacology Training Grant, S.P. was supported by an American Parkinson’s Disease Association Fellowship, and Y.Y. was supported by an NSF Fellowship. J.C. received support from the National Institute of Metal Health (MH076145).
Footnotes
Author Contributions. J.W. performed the flow cytometry, FISH, and assisted in the slot blot analyses. R.R. performed the QPCR and slot blot analyses. D.B. assisted with the slot blot analyses. Y.Y. assisted with the flow cytometry, S.P. assisted with flow cytometry and FISH analyses. S.B. assisted with the immunolabeling. J.C. oversaw the experiments and J.W. and J.C. wrote the manuscript.
Contributor Information
Jurjen W. Westra, Biomedical Sciences Program, School of Medicine, University of California, San Diego, CA
Richard R. Rivera, Helen L. Dorris Child and Adolescent Neuropsychiatric Disorder Institute, The Scripps Research Institute, La Jolla, CA
Diane M. Bushman, Biomedical Sciences Program, School of Medicine, University of California, San Diego, CA
Yun C. Yung, Biomedical Sciences Program, School of Medicine, University of California, San Diego, CA
Suzanne E. Peterson, Helen L. Dorris Child and Adolescent Neuropsychiatric Disorder Institute, The Scripps Research Institute, La Jolla, CA
Serena Barral, Helen L. Dorris Child and Adolescent Neuropsychiatric Disorder Institute, The Scripps Research Institute, La Jolla, CA.
Jerold Chun, Helen L. Dorris Child and Adolescent Neuropsychiatric Disorder Institute, The Scripps Research Institute, La Jolla, CA.
References
- Aldhous MC, Raab GM, Doherty KV, Mok JY, Bird AG, Froebel KS. Age-related ranges of memory, activation, and cytotoxic markers on CD4 and CD8 cells in children. Journal of clinical immunology. 1994;14(5):289–298. doi: 10.1007/BF01540982. [DOI] [PubMed] [Google Scholar]
- Bergers E, van Diest PJ, Baak JP. Tumour heterogeneity of DNA cell cycle variables in breast cancer measured by flow cytometry. Journal of clinical pathology. 1996;49(11):931–937. doi: 10.1136/jcp.49.11.931. [DOI] [PMC free article] [PubMed] [Google Scholar]
- Bhardwaj RD, Curtis MA, Spalding KL, Buchholz BA, Fink D, Bjork-Eriksson T, Nordborg C, Gage FH, Druid H, Eriksson PS, Frisen J. Neocortical neurogenesis in humans is restricted to development. Proceedings of the National Academy of Sciences of the United States of America. 2006;103(33):12564–12568. doi: 10.1073/pnas.0605177103. [DOI] [PMC free article] [PubMed] [Google Scholar]
- Brasseur R, de Kruijff B, Ruysschaert JM. Mode of organization of lipid aggregates: a conformational analysis. Biosci Rep. 1984;4(3):259–267. doi: 10.1007/BF01119662. [DOI] [PubMed] [Google Scholar]
- Bruner JM, Langford LA, Fuller GN. Neuropathology, cell biology, and newer diagnostic methods. Current opinion in oncology. 1993;5(3):441–449. doi: 10.1097/00001622-199305000-00002. [DOI] [PubMed] [Google Scholar]
- Chen C, Hong YK, Ontiveros SD, Egholm M, Strauss WM. Single base discrimination of CENP-B repeats on mouse and human Chromosomes with PNA-FISH. Mamm Genome. 1999;10(1):13–18. doi: 10.1007/s003359900934. [DOI] [PubMed] [Google Scholar]
- Chun J. Developmental neurobiology: a genetic Cheshire cat? Current Biology. 1999;9(17):R651–654. doi: 10.1016/s0960-9822(99)80415-1. [DOI] [PubMed] [Google Scholar]
- Chun J. Choices, choices, choices. Nat Neurosci. 2004;7(4):323–325. doi: 10.1038/nn0404-323. [DOI] [PubMed] [Google Scholar]
- Chun J, Schatz DG. Rearranging views on neurogenesis: neuronal death in the absence of DNA end-joining proteins. Neuron. 1999;22(1):7–10. doi: 10.1016/s0896-6273(00)80671-6. [DOI] [PubMed] [Google Scholar]
- Chun JJ, Schatz DG, Oettinger MA, Jaenisch R, Baltimore D. The recombination activating gene-1 (RAG-1) transcript is present in the murine central nervous system. Cell. 1991;64(1):189–200. doi: 10.1016/0092-8674(91)90220-s. [DOI] [PubMed] [Google Scholar]
- Coufal NG, Garcia-Perez JL, Peng GE, Yeo GW, Mu Y, Lovci MT, Morell M, O’Shea KS, Moran JV, Gage FH. L1 retrotransposition in human neural progenitor cells. Nature. 2009;460(7259):1127–1131. doi: 10.1038/nature08248. [DOI] [PMC free article] [PubMed] [Google Scholar]
- Crissman HA, Steinkamp JA. Rapid, simultaneous measurement of DNA, protein, and cell volume in single cells from large mammalian cell populations. The Journal of cell biology. 1973;59(3):766–771. doi: 10.1083/jcb.59.3.766. [DOI] [PMC free article] [PubMed] [Google Scholar]
- Danova M, Riccardi A, Mazzini G, Ucci G, Gaetani P, Silvani V, Knerich R, Butti G, Ascari E. Ploidy and proliferative activity of human brain tumors. A flow cytofluorometric study. Oncology. 1987;44(2):102–107. doi: 10.1159/000226455. [DOI] [PubMed] [Google Scholar]
- Darzynkiewicz Z, Huang X. Analysis of cellular DNA content by flow cytometry. In: John E, Coligan [, et al., editors. Current protocols in immunology. Unit 5. Chapter 5. 2004. p. 7. [DOI] [PubMed] [Google Scholar]
- Del Monte U. The puzzle of ploidy of Purkinje neurons. Cerebellum (London, England) 2006;5(1):23–26. doi: 10.1080/14734220500435894. [DOI] [PubMed] [Google Scholar]
- Desilva TM, Kinney HC, Borenstein NS, Trachtenberg FL, Irwin N, Volpe JJ, Rosenberg PA. The glutamate transporter EAAT2 is transiently expressed in developing human cerebral white matter. The Journal of comparative neurology. 2007;501(6):879–890. doi: 10.1002/cne.21289. [DOI] [PMC free article] [PubMed] [Google Scholar]
- Difilippantonio MJ, Zhu J, Chen HT, Meffre E, Nussenzweig MC, Max EE, Ried T, Nussenzweig A. DNA repair protein Ku80 suppresses chromosomal aberrations and malignant transformation. Nature. 2000;404(6777):510–514. doi: 10.1038/35006670. [DOI] [PMC free article] [PubMed] [Google Scholar]
- Dombrowski SM, Hilgetag CC, Barbas H. Quantitative architecture distinguishes prefrontal cortical systems in the rhesus monkey. Cereb Cortex. 2001;11(10):975–988. doi: 10.1093/cercor/11.10.975. [DOI] [PubMed] [Google Scholar]
- Dowson JH. The evaluation of autofluorescence emission spectra derived from neuronal lipopigment. Journal of microscopy. 1982;128(Pt 3):261–270. doi: 10.1111/j.1365-2818.1982.tb04628.x. [DOI] [PubMed] [Google Scholar]
- Dreyer WJ, Bennett JC. The molecular basis of antibody formation: a paradox. Proc Natl Acad Sci U S A. 1965;54(3):864–869. doi: 10.1073/pnas.54.3.864. [DOI] [PMC free article] [PubMed] [Google Scholar]
- Dreyer WJ, Gray WR, Hood L. The genetic, molecular and cellular basis of antibody formation: some facts and a unifying hypothesis. Cold Spring Harbor Symp Quant Biol. 1967;32:353–367. [Google Scholar]
- Freeman JL, Perry GH, Feuk L, Redon R, McCarroll SA, Altshuler DM, Aburatani H, Jones KW, Tyler-Smith C, Hurles ME, Carter NP, Scherer SW, Lee C. Copy number variation: new insights in genome diversity. Genome research. 2006;16(8):949–961. doi: 10.1101/gr.3677206. [DOI] [PubMed] [Google Scholar]
- Goedert M, Spillantini MG. A century of Alzheimer’s disease. Science (New York, NY. 2006;314(5800):777–781. doi: 10.1126/science.1132814. [DOI] [PubMed] [Google Scholar]
- Gould E, Reeves AJ, Graziano MS, Gross CG. Neurogenesis in the neocortex of adult primates. Science (New York, NY. 1999;286(5439):548–552. doi: 10.1126/science.286.5439.548. [DOI] [PubMed] [Google Scholar]
- Gu Y, Sekiguchi J, Gao Y, Dikkes P, Frank K, Ferguson D, Hasty P, Chun J, Alt FW. Defective embryonic neurogenesis in Ku-deficient but not DNA-dependent protein kinase catalytic subunit-deficient mice. Proceedings of the National Academy of Sciences of the United States of America. 2000;97(6):2668–2673. doi: 10.1073/pnas.97.6.2668. [DOI] [PMC free article] [PubMed] [Google Scholar]
- Guarnieri DJ, DiLeone RJ. MicroRNAs: a new class of gene regulators. Annals of medicine. 2008;40(3):197–208. doi: 10.1080/07853890701771823. [DOI] [PubMed] [Google Scholar]
- Iourov IY, Vorsanova SG, Liehr T, Yurov YB. Aneuploidy in the normal, Alzheimer’s disease and ataxia-telangiectasia brain: differential expression and pathological meaning. Neurobiol Dis. 2009;34(2):212–220. doi: 10.1016/j.nbd.2009.01.003. [DOI] [PubMed] [Google Scholar]
- Iourov IY, Vorsanova SG, Yurov YB. Chromosomal variation in mammalian neuronal cells: known facts and attractive hypotheses. International review of cytology. 2006;249:143–191. doi: 10.1016/S0074-7696(06)49003-3. [DOI] [PubMed] [Google Scholar]
- Kaushal D, Contos JJ, Treuner K, Yang AH, Kingsbury MA, Rehen SK, McConnell MJ, Okabe M, Barlow C, Chun J. Alteration of gene expression by chromosome loss in the postnatal mouse brain. J Neurosci. 2003;23(13):5599–5606. doi: 10.1523/JNEUROSCI.23-13-05599.2003. [DOI] [PMC free article] [PubMed] [Google Scholar]
- Kazazian HH, Jr, Goodier JL. LINE drive. retrotransposition and genome instability. Cell. 2002;110(3):277–280. doi: 10.1016/s0092-8674(02)00868-1. [DOI] [PubMed] [Google Scholar]
- Kingsbury MA, Friedman B, McConnell MJ, Rehen SK, Yang AH, Kaushal D, Chun J. Aneuploid neurons are functionally active and integrated into brain circuitry. Proc Natl Acad Sci U S A. 2005;102(17):6143–6147. doi: 10.1073/pnas.0408171102. [DOI] [PMC free article] [PubMed] [Google Scholar]
- Kingsbury MA, Yung YC, Peterson SE, Westra JW, Chun J. Aneuploidy in the normal and diseased brain. Cell Mol Life Sci. 2006;63(22):2626–2641. doi: 10.1007/s00018-006-6169-5. [DOI] [PMC free article] [PubMed] [Google Scholar]
- Knusel A, Lehner B, Kuenzle CC, Kistler GS. Isolation of neuronal nuclei from rat brain cortex. The Journal of cell biology. 1973;59(3):762–765. doi: 10.1083/jcb.59.3.762. [DOI] [PMC free article] [PubMed] [Google Scholar]
- Laerum OD, Farsund T. Clinical application of flow cytometry: a review. Cytometry. 1981;2(1):1–13. doi: 10.1002/cyto.990020102. [DOI] [PubMed] [Google Scholar]
- Lapham LW. Tetraploid DNA content of Purkinje neurons of human cerebellar cortex. Science. 1968;159(812):310–312. doi: 10.1126/science.159.3812.310. [DOI] [PubMed] [Google Scholar]
- Levitt P, Barbe MF, Eagleson KL. Patterning and specification of the cerebral cortex. Annual review of neuroscience. 1997;20:1–24. doi: 10.1146/annurev.neuro.20.1.1. [DOI] [PubMed] [Google Scholar]
- Lind D, Franken S, Kappler J, Jankowski J, Schilling K. Characterization of the neuronal marker NeuN as a multiply phosphorylated antigen with discrete subcellular localization. Journal of neuroscience research. 2005;79(3):295–302. doi: 10.1002/jnr.20354. [DOI] [PubMed] [Google Scholar]
- Masumoto H, Nakano M, Ohzeki J. The role of CENP-B and alpha-satellite DNA: de novo assembly and epigenetic maintenance of human centromeres. Chromosome Res. 2004;12(6):543–556. doi: 10.1023/B:CHRO.0000036593.72788.99. [DOI] [PubMed] [Google Scholar]
- McConnell MJ, Kaushal D, Yang AH, Kingsbury MA, Rehen SK, Treuner K, Helton R, Annas EG, Chun J, Barlow C. Failed clearance of aneuploid embryonic neural progenitor cells leads to excess aneuploidy in the Atm-deficient but not the Trp53-deficient adult cerebral cortex. J Neurosci. 2004;24(37):8090–8096. doi: 10.1523/JNEUROSCI.2263-04.2004. [DOI] [PMC free article] [PubMed] [Google Scholar]
- McNally JG, Karpova T, Cooper J, Conchello JA. Three-dimensional imaging by deconvolution microscopy. Methods (San Diego, Calif. 1999;19(3):373–385. doi: 10.1006/meth.1999.0873. [DOI] [PubMed] [Google Scholar]
- Muehlbauer PA, Schuler MJ. Detection of numerical chromosomal aberrations by flow cytometry: a novel process for identifying aneugenic agents. Mutation research. 2005;585(1–2):156–169. doi: 10.1016/j.mrgentox.2005.05.002. [DOI] [PubMed] [Google Scholar]
- Mullen RJ, Buck CR, Smith AM. NeuN, a neuronal specific nuclear protein in vertebrates. Development (Cambridge, England) 1992;116(1):201–211. doi: 10.1242/dev.116.1.201. [DOI] [PubMed] [Google Scholar]
- Muller JM, Metzger E, Greschik H, Bosserhoff AK, Mercep L, Buettner R, Schule R. The transcriptional coactivator FHL2 transmits Rho signals from the cell membrane into the nucleus. Embo J. 2002;21(4):736–748. doi: 10.1093/emboj/21.4.736. [DOI] [PMC free article] [PubMed] [Google Scholar]
- Muotri AR, Chu VT, Marchetto MC, Deng W, Moran JV, Gage FH. Somatic mosaicism in neuronal precursor cells mediated by L1 retrotransposition. Nature. 2005;435(7044):903–910. doi: 10.1038/nature03663. [DOI] [PubMed] [Google Scholar]
- Nunez R. DNA measurement and cell cycle analysis by flow cytometry. Current issues in molecular biology. 2001;3(3):67–70. [PubMed] [Google Scholar]
- Peterson SE, Westra JW, Paczkowski CM, Chun J. Chromosomal mosaicism in neural stem cells. Methods in molecular biology (Clifton, NJ. 2008;438:197–204. doi: 10.1007/978-1-59745-133-8_16. [DOI] [PubMed] [Google Scholar]
- Rajagopalan H, Lengauer C. Aneuploidy and cancer. Nature. 2004;432(7015):338–341. doi: 10.1038/nature03099. [DOI] [PubMed] [Google Scholar]
- Rajendran RS, Zupanc MM, Losche A, Westra J, Chun J, Zupanc GK. Numerical chromosome variation and mitotic segregation defects in the adult brain of teleost fish. Developmental neurobiology. 2007;67(10):1334–1347. doi: 10.1002/dneu.20365. [DOI] [PubMed] [Google Scholar]
- Rakic P. Neurogenesis in adult primate neocortex: an evaluation of the evidence. Nat Rev Neurosci. 2002;3(1):65–71. doi: 10.1038/nrn700. [DOI] [PubMed] [Google Scholar]
- Rehen SK, McConnell MJ, Kaushal D, Kingsbury MA, Yang AH, Chun J. Chromosomal variation in neurons of the developing and adult mammalian nervous system. Proceedings of the National Academy of Sciences of the United States of America. 2001;98(23):13361–13366. doi: 10.1073/pnas.231487398. [DOI] [PMC free article] [PubMed] [Google Scholar]
- Rehen SK, Yung YC, McCreight MP, Kaushal D, Yang AH, Almeida BS, Kingsbury MA, Cabral KM, McConnell MJ, Anliker B, Fontanoz M, Chun J. Constitutional aneuploidy in the normal human brain. J Neurosci. 2005;25(9):2176–2180. doi: 10.1523/JNEUROSCI.4560-04.2005. [DOI] [PMC free article] [PubMed] [Google Scholar]
- Riga D, Riga S. Lipofuscin and ceroid pigments in aging and brain pathology. A review. I. Biochemical and morphological properties. Rom J Neurol Psychiatry. 1995;33(2):121–136. [PubMed] [Google Scholar]
- Schatz DG, Spanopoulou E. Biochemistry of V(D)J recombination. Curr Top Microbiol Immunol. 2005;290:49–85. doi: 10.1007/3-540-26363-2_4. [DOI] [PubMed] [Google Scholar]
- Schnell SA, Staines WA, Wessendorf MW. Reduction of lipofuscin-like autofluorescence in fluorescently labeled tissue. J Histochem Cytochem. 1999;47(6):719–730. doi: 10.1177/002215549904700601. [DOI] [PubMed] [Google Scholar]
- Sebat J, Lakshmi B, Troge J, Alexander J, Young J, Lundin P, Maner S, Massa H, Walker M, Chi M, Navin N, Lucito R, Healy J, Hicks J, Ye K, Reiner A, Gilliam TC, Trask B, Patterson N, Zetterberg A, Wigler M. Large-scale copy number polymorphism in the human genome. Science (New York, NY. 2004;305(5683):525–528. doi: 10.1126/science.1098918. [DOI] [PubMed] [Google Scholar]
- Sekiguchi J, Ferguson DO, Chen HT, Yang EM, Earle J, Frank K, Whitlow S, Gu Y, Xu Y, Nussenzweig A, Alt FW. Genetic interactions between ATM and the nonhomologous end-joining factors in genomic stability and development. Proceedings of the National Academy of Sciences of the United States of America. 2001;98(6):3243–3248. doi: 10.1073/pnas.051632098. [DOI] [PMC free article] [PubMed] [Google Scholar]
- Sekiguchi JM, Gao Y, Gu Y, Frank K, Sun Y, Chaudhuri J, Zhu C, Cheng HL, Manis J, Ferguson D, Davidson L, Greenberg ME, Alt FW. Nonhomologous end-joining proteins are required for V(D)J recombination, normal growth, and neurogenesis. Cold Spring Harbor symposia on quantitative biology. 1999;64:169–181. doi: 10.1101/sqb.1999.64.169. [DOI] [PubMed] [Google Scholar]
- Smith PJ, Blunt N, Wiltshire M, Hoy T, Teesdale-Spittle P, Craven MR, Watson JV, Amos WB, Errington RJ, Patterson LH. Characteristics of a novel deep red/infrared fluorescent cell-permeant DNA probe, DRAQ5, in intact human cells analyzed by flow cytometry, confocal and multiphoton microscopy. Cytometry. 2000;40(4):280–291. doi: 10.1002/1097-0320(20000801)40:4<280::aid-cyto4>3.0.co;2-7. [DOI] [PubMed] [Google Scholar]
- Spalding KL, Bhardwaj RD, Buchholz BA, Druid H, Frisen J. Retrospective birth dating of cells in humans. Cell. 2005;122(1):133–143. doi: 10.1016/j.cell.2005.04.028. [DOI] [PubMed] [Google Scholar]
- Storchova Z, Pellman D. From polyploidy to aneuploidy, genome instability and cancer. Nature reviews. 2004;5(1):45–54. doi: 10.1038/nrm1276. [DOI] [PubMed] [Google Scholar]
- Swerts K, Van Roy N, Benoit Y, Laureys G, Philippe J. DRAQ5: improved flow cytometric DNA content analysis and minimal residual disease detection in childhood malignancies. Clinica chimica acta; international journal of clinical chemistry. 2007;379(1–2):154–157. doi: 10.1016/j.cca.2006.12.008. [DOI] [PubMed] [Google Scholar]
- Taneja KL, Chavez EA, Coull J, Lansdorp PM. Multicolor fluorescence in situ hybridization with peptide nucleic acid probes for enumeration of specific chromosomes in human cells. Genes, chromosomes & cancer. 2001;30(1):57–63. doi: 10.1002/1098-2264(2000)9999:9999<::aid-gcc1054>3.0.co;2-m. [DOI] [PubMed] [Google Scholar]
- Torres EM, Sokolsky T, Tucker CM, Chan LY, Boselli M, Dunham MJ, Amon A. Effects of aneuploidy on cellular physiology and cell division in haploid yeast. Science (New York, NY. 2007;317(5840):916–924. doi: 10.1126/science.1142210. [DOI] [PubMed] [Google Scholar]
- Venter JC, Adams MD, Myers EW, Li PW, Mural RJ, Sutton GG, Smith HO, Yandell M, Evans CA, Holt RA, Gocayne JD, Amanatides P, Ballew RM, Huson DH, Wortman JR, Zhang Q, Kodira CD, Zheng XH, Chen L, Skupski M, Subramanian G, Thomas PD, Zhang J, Gabor Miklos GL, Nelson C, Broder S, Clark AG, Nadeau J, McKusick VA, Zinder N, Levine AJ, Roberts RJ, Simon M, Slayman C, Hunkapiller M, Bolanos R, Delcher A, Dew I, Fasulo D, Flanigan M, Florea L, Halpern A, Hannenhalli S, Kravitz S, Levy S, Mobarry C, Reinert K, Remington K, Abu-Threideh J, Beasley E, Biddick K, Bonazzi V, Brandon R, Cargill M, Chandramouliswaran I, Charlab R, Chaturvedi K, Deng Z, Di Francesco V, Dunn P, Eilbeck K, Evangelista C, Gabrielian AE, Gan W, Ge W, Gong F, Gu Z, Guan P, Heiman TJ, Higgins ME, Ji RR, Ke Z, Ketchum KA, Lai Z, Lei Y, Li Z, Li J, Liang Y, Lin X, Lu F, Merkulov GV, Milshina N, Moore HM, Naik AK, Narayan VA, Neelam B, Nusskern D, Rusch DB, Salzberg S, Shao W, Shue B, Sun J, Wang Z, Wang A, Wang X, Wang J, Wei M, Wides R, Xiao C, Yan C, Yao A, Ye J, Zhan M, Zhang W, Zhang H, Zhao Q, Zheng L, Zhong F, Zhong W, Zhu S, Zhao S, Gilbert D, Baumhueter S, Spier G, Carter C, Cravchik A, Woodage T, Ali F, An H, Awe A, Baldwin D, Baden H, Barnstead M, Barrow I, Beeson K, Busam D, Carver A, Center A, Cheng ML, Curry L, Danaher S, Davenport L, Desilets R, Dietz S, Dodson K, Doup L, Ferriera S, Garg N, Gluecksmann A, Hart B, Haynes J, Haynes C, Heiner C, Hladun S, Hostin D, Houck J, Howland T, Ibegwam C, Johnson J, Kalush F, Kline L, Koduru S, Love A, Mann F, May D, McCawley S, McIntosh T, McMullen I, Moy M, Moy L, Murphy B, Nelson K, Pfannkoch C, Pratts E, Puri V, Qureshi H, Reardon M, Rodriguez R, Rogers YH, Romblad D, Ruhfel B, Scott R, Sitter C, Smallwood M, Stewart E, Strong R, Suh E, Thomas R, Tint NN, Tse S, Vech C, Wang G, Wetter J, Williams S, Williams M, Windsor S, Winn-Deen E, Wolfe K, Zaveri J, Zaveri K, Abril JF, Guigo R, Campbell MJ, Sjolander KV, Karlak B, Kejariwal A, Mi H, Lazareva B, Hatton T, Narechania A, Diemer K, Muruganujan A, Guo N, Sato S, Bafna V, Istrail S, Lippert R, Schwartz R, Walenz B, Yooseph S, Allen D, Basu A, Baxendale J, Blick L, Caminha M, Carnes-Stine J, Caulk P, Chiang YH, Coyne M, Dahlke C, Mays A, Dombroski M, Donnelly M, Ely D, Esparham S, Fosler C, Gire H, Glanowski S, Glasser K, Glodek A, Gorokhov M, Graham K, Gropman B, Harris M, Heil J, Henderson S, Hoover J, Jennings D, Jordan C, Jordan J, Kasha J, Kagan L, Kraft C, Levitsky A, Lewis M, Liu X, Lopez J, Ma D, Majoros W, McDaniel J, Murphy S, Newman M, Nguyen T, Nguyen N, Nodell M, Pan S, Peck J, Peterson M, Rowe W, Sanders R, Scott J, Simpson M, Smith T, Sprague A, Stockwell T, Turner R, Venter E, Wang M, Wen M, Wu D, Wu M, Xia A, Zandieh A, Zhu X. The sequence of the human genome. Science. 2001;291(5507):1304–1351. doi: 10.1126/science.1058040. [DOI] [PubMed] [Google Scholar]
- Vindelov LL, Christensen IJ, Jensen G, Nissen NI. Limits of detection of nuclear DNA abnormalities by flow cytometric DNA analysis. Results obtained by a set of methods for sample-storage, staining and internal standardization. Cytometry. 1983a;3(5):332–339. doi: 10.1002/cyto.990030505. [DOI] [PubMed] [Google Scholar]
- Vindelov LL, Christensen IJ, Nissen NI. Standardization of high-resolution flow cytometric DNA analysis by the simultaneous use of chicken and trout red blood cells as internal reference standards. Cytometry. 1983b;3(5):328–331. doi: 10.1002/cyto.990030504. [DOI] [PubMed] [Google Scholar]
- Westra JW, Peterson SE, Yung YC, Mutoh T, Barral S, Chun J. Aneuploid mosaicism in the developing and adult cerebellar cortex. The Journal of comparative neurology. 2008;507(6):1944–1951. doi: 10.1002/cne.21648. [DOI] [PubMed] [Google Scholar]
- Yang AH, Kaushal D, Rehen SK, Kriedt K, Kingsbury MA, McConnell MJ, Chun J. Chromosome segregation defects contribute to aneuploidy in normal neural progenitor cells. J Neurosci. 2003;23(32):10454–10462. doi: 10.1523/JNEUROSCI.23-32-10454.2003. [DOI] [PMC free article] [PubMed] [Google Scholar]
- Yang Y, Geldmacher DS, Herrup K. DNA replication precedes neuronal cell death in Alzheimer’s disease. J Neurosci. 2001;21(8):2661–2668. doi: 10.1523/JNEUROSCI.21-08-02661.2001. [DOI] [PMC free article] [PubMed] [Google Scholar]
- Yokota H, Iwasaki T, Takahashi M, Oishi M. A tissue-specific change in repetitive DNA in rats. Proceedings of the National Academy of Sciences of the United States of America. 1989;86(23):9233–9237. doi: 10.1073/pnas.86.23.9233. [DOI] [PMC free article] [PubMed] [Google Scholar]
- Yuan CM, Douglas-Nikitin VK, Ahrens KP, Luchetta GR, Braylan RC, Yang L. DRAQ5-based DNA content analysis of hematolymphoid cell subpopulations discriminated by surface antigens and light scatter properties. Cytometry B Clin Cytom. 2004;58(1):47–52. doi: 10.1002/cyto.b.20000. [DOI] [PubMed] [Google Scholar]
- Yurov YB, Iourov IY, Monakhov VV, Soloviev IV, Vostrikov VM, Vorsanova SG. The variation of aneuploidy frequency in the developing and adult human brain revealed by an interphase FISH study. J Histochem Cytochem. 2005;53(3):385–390. doi: 10.1369/jhc.4A6430.2005. [DOI] [PubMed] [Google Scholar]
- Yurov YB, Iourov IY, Vorsanova SG, Liehr T, Kolotii AD, Kutsev SI, Pellestor F, Beresheva AK, Demidova IA, Kravets VS, Monakhov VV, Soloviev IV. Aneuploidy and confined chromosomal mosaicism in the developing human brain. PLoS ONE. 2007;2(6):e558. doi: 10.1371/journal.pone.0000558. [DOI] [PMC free article] [PubMed] [Google Scholar]
Associated Data
This section collects any data citations, data availability statements, or supplementary materials included in this article.


