

Abstract
In the current work, we investigated the in-vitro biochemical mechanism of caffeic acid phenylethyl ester (CAPE) toxicity and eight hydroxycinnamic/caffeic acid derivatives in-vitro, using tyrosinase enzyme as a molecular target in human SK-MEL-28 melanoma cells. Enzymatic reaction models using tyrosinase/O2 and HRP/H2O2 were used to delineate the role of one- and two-electron oxidation. Ascorbic acid (AA), NADH and GSH depletion were used as markers of quinone formation and oxidative stress in CAPE induced toxicity in melanoma cells. Ethylenediamine, an o-quinone trap, prevented the formation of o-quinone and oxidations of AA and NADH mediated by tyrosinase bioactivation of CAPE. The IC50 of CAPE towards SK-MEL-28 melanoma cells was 15μM. Dicoumarol, a diaphorase inhibitor, and 1-bromoheptane, a GSH depleting agent, increased CAPE’s toxicity towards SK-MEL-28 cells indicating quinone formation played an important role in CAPE induced cell toxicity. Cyclosporin-A and trifluoperazine, inhibitors of the mitochondrial membrane permeability transition pore (PTP), prevented CAPE toxicity towards melanoma cells. We further investigated the role of tyrosinase in CAPE toxicity in the presence of a shRNA plasmid, targeting tyrosinase mRNA. Results from tyrosinase shRNA experiments showed that CAPE led to negligible anti-proliferative effect, apoptotic cell death and ROS formation in shRNA plasmid treated cells. Furthermore, it was also found that CAPE selectively caused escalation in the ROS formation and intracellular GSH (ICG) depletion in melanocytic human SK-MEL-28 cells which express functional tyrosinase. In contrast, CAPE did not lead to ROS formation and ICG depletion in amelanotic C32 melanoma cells, which do not express functional tyrosinase. These findings suggest that tyrosinase plays a major role in CAPE’s selective toxicity towards melanocytic melanoma cell lines. Our findings suggest that the mechanisms of CAPE toxicity in SK-MEL-28 melanoma cells mediated by tyrosinase bioactivation of CAPE included quinone formation, ROS formation, intracellular GSH depletion and induced mitochondrial toxicity.
Keywords: Caffeic acid, melanoma, SK-MEL-28, cancer, quinone, GSH, CAPE
1. Introduction
Melanoma is a cancer that arises from melanocytes specialized pigmented cells that are found predominantly in the skin [1]. It is one of the most aggressive skin cancers with relatively high propensity for metastasis [2]. Human epidemiological studies have revealed a significant increase in the incidence of melanoma in Western populations; the number of cases worldwide has doubled in the past 20 years [1]. Treatment options for metastatic melanoma continue to evolve on several frontiers. Dacarbazine (DTIC), currently the only US Food and Drug Administration approved chemotherapy for treatment of metastatic disease, has to date resulted in little or no impact on survival, even when assessed in combination with therapeutics with diverse mechanisms of action [3]. Novel chemotherapeutic agents for the treatment of patients with disseminated malignant melanoma are urgently needed.
Naturally occurring hydroxycinnamic acid derivatives are reported to have anticancer, anti-inflammatory, antibacterial and antioxidant properties [4, 5]. Their natural origin and ubiquitous occurrence has prompted strong interest in the use of hydroxycinnamic/caffeic acids as antioxidants [4]. Caffeic Acid Phenylethyl Ester (CAPE), isolated from propolis, a honeybee hive product has been attributed a broad spectrum of activities including antibiotic, anti-inflammatory and tumor growth arrest [5, 6]. Grunberger et al reported CAPE to have significant cytotoxic effect against various tumor cell lines [7, 8]. Zheng et al observed that CAPE (IC50 7 μM) caused inhibition of proliferation of SV40 transformed keratinocytes at 48 h [4]. A study by Lee et al showed that CAPE (IC50 75 μM) demonstrated significant cytotoxicity in oral cancer cells at 48 h [9]. Another study by Chen et al indicated that CAPE (IC50 2.5 μM) was found to arrest the growth of human leukemia HL-60 cells at 48 h [10]. Fisher et al have demonstrated that CAPE caused a concentration dependent growth suppressive effect on human colon adenocarcinoma, glioblastoma and melanoma cells, while it was ineffective in altering the proliferative ability of normal human skin fibroblasts [7, 11]. However, none of these studies investigated the biochemical mechanism of CAPE toxicity involving tyrosinase in melanoma cell lines. Recently we also investigated the effect of CAPE as anti-melanoma agent in skin tumor model of melanoma in C57BL/6 and found it to be efficacious against in-vivo tumor model in mice [12].
Tyrosinase, an abundant enzyme found in melanoma, is an ideal molecular target for the development of anti-melanoma drugs. In a study of tyrosinase activity, 46–95 units of tyrosinase per mg of skin were found in the normal region of skin and 17,000 to 19,500 units of tyrosinase per mg of the metastatic melanoma were found in the same patient [13]. Using tyrosinase as a molecular target in this work, we investigated the enzymatic oxidation and the biochemical toxicity of CAPE and eight hydroxycinnamic/caffeic acid derivatives in human melanoma cell lines. We hypothesized that bioactivation of CAPE to its corresponding quinone metabolite by tyrosinase, a molecular target for development of cancer therapeutics, would lead to selective and desirable melanoma cell death. Cell viability assays were performed to assess the cytotoxicity and anti proliferative effects of CAPE towards melanoma cells. A number of biochemical modulators were used to elucidate the mechanism of CAPE induced toxicity in SK-MEL-28 human melanoma cells. The implications of intracellular GSH depletion, oxidative stress in mitochondria and a drop in mitochondrial membrane potential were also investigated in SK-MEL-28 melanoma cells. The role of tyrosinase in CAPE toxicity, apoptotic cell death and ROS formation in SK-MEL-28 melanoma cells in the presence of a short hairpin RNA (shRNA) plasmid, silencing tyrosinase mRNA were also studied.
2. Materials and methods
2.1 Materials
All materials, solvents and reagents used in this work were analytical grade with the highest degree of purity and were purchased either from Sigma-Aldrich, St. Louis, MO or Fisher-Scientific, Pittsburgh, PA. Mushroom tyrosinase was used throughout this study as purified human tyrosinase is unavailable commercially. Because the compounds were dissolved in DMSO, the final concentration of DMSO was 0.1 % and 1 % v/v in cell culture media of the cells treated with drugs. Therefore, the media for control cells contained 0.1 % and 1 % v/v DMSO in the experiment. Phosphate buffered saline (PBS) was used as a vehicle to dissolve ascorbic acid (AA) and GSH. Stock solutions of horseradish peroxidase (HRP) were made in Tris buffer without DETAPAC pH 7.4.
The SureSilencing shRNA plasmid (Cat. No. KH01771N; Neomycin resistance) for human tyrosinase was obtained from SuperArray Bioscience Corporation, Frederick, MD. The anti-tyrosinase monoclonal antibody (232 μg/μl) (Cat. No. 05-647) was obtained from Upstate Innovative Cell Signaling Solutions, Lake Placid, NY.
4-Hydroxyanisole (4-HA) [14] and t-butylcatechol [15] were used as positive controls in enzymatic and cell culture experiments (data not shown).
2.2 UV-VIS spectroscopy of enzyme mediated oxidation of CAPE
A UV-VIS spectroscopy method [14, 16] was used to elucidate the progression of CAPE oxidation by tyrosinase/O2 and HRP/H2O2. The spectra of a solution containing CAPE (100 μM) and tyrosinase (10 U/mL) or HRP (2 μM)/H2O2 (100 μM) was recorded every two minutes in the absence and presence of GSH (200 μM) using a GBC UV-Visible spectral spectrophotometer, GBC Scientific, Victoria, Australia. The spectra of the mixture were obtained when GSH was added to the solution either before or after the addition of tyrosinase or HRP/H2O2. Similarly, the effects of ascorbic acid (AA) (100 μM) and NADH (200 μM) were also investigated. The control spectrum was that of the CAPE (100 μM) in phosphate buffer 0.1 M (pH 7.4) containing diethylenetriaminepentaacetic acid (DETAPAC) (1 mM). The effect of ethylenediamine (1 mM), an o-quinone trap [17, 18], on the oxidation product of CAPE in the presence of tyrosinase/O2 was also investigated. Similar studies were performed on 4-HA and 4-t-butylchatechol as positive controls.
2.3 Rate of AA and NADH oxidation
A previously described method [14, 16] was used to measure the rate of ascorbic acid (AA) and NADH oxidation mediated by metabolism of CAPE by tyrosinase/O2 and HRP/H2O2, respectively. Briefly, tyrosinase (5 U/mL) was added to a mixture of CAPE (100 μM) in the presence and absence of GSH (200 μM), and AA (50 μM) in phosphate buffer (0.1 M, pH 7.4, DETAPAC 1 mM) [14]. A concentration of CAPE (100 μM) and tyrosinase (5 U/mL) was used with NADH (200 μM). The depletion of AA and NADH were monitored at 266 nm and 340 nm respectively. The effect of ethylenediamine (1 mM), an o-quinone trap [17, 18], on the oxidation rate of AA and NADH was also investigated. Similar studies were performed on 4-HA and 4-t-butylchatechol as positive controls. The oxidation rate was calculated using the following formula:
A similar formula was used to calculate the rate of NADH oxidation. A similar approach was used to measure the rate of AA and NADH oxidation by HRP (2 μM)/H2O2 (100 μM). The experiment was performed in three replicates.
2.4 Tyrosinase mediated GSH depletion assay
A previously described method [14, 16] using Ellman’s reagent (DTNB) [19] was employed to measure the extent of GSH depletion as a result of the enzymatic oxidation of the phenolic agent by tyrosinase/O2. Briefly, tyrosinase (10 μL; 2500 U/mL) was added to a mixture of phenolic agent (100 μM) and GSH (200 μM) in a final volume of 1 mL phosphate buffer (0.1 M, pH 7.4, containing 1 mM DETAPAC). The mixture was incubated in a 37 °C water bath. 250 μL aliquots were taken at 30, 60, and 120 min, respectively, and added to trichloroacetic acid (25 μL; 30 % w/v), vortexed and left at room temperature for 5 min. A 100 μL aliquot was then added to a mixture of Ellman’s reagent 5, 5′-dithiobis-(2-nitrobenzoic acid) (DTNB) [19] (25 μL; 2 mg/mL) and Tris/HCl buffer (875 μL; 0.1 M, pH 8.9). The control spectrum was that containing Ellman’s reagent (DTNB) (25 μL; 2 mg/mL) and Tris/HCl buffer (975 μL; 0.1 M, pH 8.9). The absorbance of the solution was observed at 412 nm [20] on a GBC spectral spectrophotometer, GBC Scientific, Victoria, Australia. GSH depletion was used as an indicator of the enzymatic oxidation of cinnamic acid and its analogs by tyrosinase/O2. The experiment was performed in three replicates.
2.5 Animal housing and protocol
Adult male Sprague-Dawley rats, 250–300 g, were obtained from Charles River Laboratories, Wilmington, MS, fed ad libitum, and acclimatized for 1 week on clay chip bedding in a room with a 12 h light photo cycle, an environmental temperature of 21-23 °C and 50-60 % relative humidity. The animal protocols for rat liver microsomal preparation were reviewed and approved by Institutional Animal Care and Use Committee at Texas Tech University Health Sciences Center, Amarillo, TX.
2.6 Rat liver microsomal preparation
The CYP2E1 induced microsomes were prepared from rats treated (i.p.) with inducing agent pyrazole (200 mg/kg/day) for two consecutive days before sacrificing the rats on the third day [20-22]. CYP2E1 induced microsomes were used because our previous study showed that 4-hydroxyanisole (4-HA) was more cytotoxic towards CYP2E1 induced isolated rat hepatocytes in comparison with normal rat hepatocytes [23]. The rats were anesthetized by sodium pentobarbital (60 mg/kg) before surgery in order to prepare the animal for liver removal. Hepatic microsomes were prepared by differential centrifugation as described previously [21]. Microsomal protein content was determined using the Bio-Rad protein assay kit (Cat. No. 500-0006, Hercules, CA) for protein quantitation [23]. The experiment was performed in three replicates.
2.7 Metabolism of cinnamic acid and its analogs by rat liver microsomal preparation
A previously described method using Ellman’s reagent (DTNB) [24] was employed to measure the extent of GSH depletion as a result of the enzymatic oxidation of cinnamic acid analogs by rat liver P450 microsomal preparation/NADPH/O2 system. GSH depletion was used to measure the extent of the cinnamic acid and its analogs metabolism by rat liver P450 microsomal preparation/NADPH/O2 system [20]. The amount of unreacted GSH was determined colorimetrically using Ellman’s reagent (DTNB) [19]. Incubation mixtures contained in a final volume of 1 mL phosphate buffer (0.1 M, pH 7.4, DETAPAC 1 mM), 2 mg/mL rat liver microsomes, 200 μM GSH, 1 mM NADPH, and 100 μM cinnamic acid or its analogs. The mixtures were gently mixed at 37 °C from which 250 μL aliquots were taken at different time points into eppendorf tubes containing 25 μL trichloroacetic acid (30 % w/v). Following protein precipitation and centrifugation for 5 min, the GSH levels of a 100 μL aliquot of the supernatant was determined as described above in section 2.4. The experiment was performed in three replicates.
2.8 Cell lines and culture conditions
The human SK-MEL-28 (Cat. No. HTB-72), SK-MEL-5 (ATCC® No. HTB-70), SK-MEL-24 (ATCC® No. HTB-71), C32 (ATCC® No. CRL-1585), MeWo (ATCC® No. HTB-65), B16-F0 (ATCC® No. CRL-6322), and B16-F10 (ATCC® No. CRL-6475) melanoma cell lines, non melanoma human Saos-2 (Cat. No. HTB-85), SW-620 (Cat. No. CCL-227), and PC-3 (Cat. No. CRL-1435) cell lines were obtained from American Type Culture Collection (ATCC®), Manassas, VA. Modified Eagle Medium Alpha (MEM) (1×) (Cat. no. 32571-036), Leibovitz’s L-15 Medium (Cat. no. 30-2008), fetal bovine serum (FBS) (Cat. No. 10082-139), and penicillin-streptomycin (10,000 units/mL; Cat. No. 15140-122) were purchased from American Type Culture Collection (ATCC®), Manassas, VA. Dulbecco’s Modified Eagle Medium (DMEM) (Cat. No. 11965-092) and Versene (1×, 0.2 g EDTA 4 Na/L in phosphate-buffered saline) (1:5000 Cat. No. 15040-066) were purchased from Invitrogen, Grand Island, NY. RPMI medium 1640 (1×) (Cat. no. 11875-119) was obtained from Invitrogen Corporation, Grand Island, NY.
2.9 Cell culture
SK-MEL-28, SK-MEL-5, Me Wo, B16-F0, B16-F10, SK-MEL-24, C32, SW-620, Saos-2 and PC-3 cells were grown as described previously [14, 16] and counted using the trypan blue exclusion method for determining viability [25]. Briefly, human SK-MEL-28 melanoma cells contained in frozen vials were washed twice with MEM Alpha media before culturing the cells in 10 mL media supplemented with (10%) fetal bovine serum (FBS) and streptomycin/penicillin (100 U/mL), in a T-25 flask. The cultures were kept at 37 °C under a 5 % CO2 atmosphere in a TS Auto flow CO2 Water-Jacketed Incubator (Forma Scientific, Marietta, OH, USA). Trypsin-EDTA solution (2-5 mL) was used to detach cells. The detached cells were rinsed with ~10 mL of pre-warmed sterile PBS at 37 °C to dilute trypsin. The mixture was transferred into a 50 mL tube. The flask was additionally rinsed with sterile PBS and the contents were added to the rest of the cells collected. The cells were spun down at 800 rpm (Beckman GPR Centrifuge, Fullerton, CA, USA) for 3-5 min. Pelletted cells were re-suspended in MEM Alpha media supplemented with (10%) FBS and streptomycin/penicillin (100 U/mL) followed by culturing the cell suspension into one T-75 flask containing 33 mL media [14, 16]. A similar approach was used to culture SK-MEL-5, SK-MEL-24, C32, MeWo, B16-F0, B16-F10, prostate PC-3, osteosarcoma Saos-2 and colorectal adenocarcinoma SW-620 cells.
2.10 Cell viability assay
The cell viability assay was performed using yellow tetrazolium dye (3-(4, 5-dimethylthiazolyl-2)-2, 5-diphenyl tetrazolium bromide) (MTT) [14, 16, 26]. All the cells were seeded at 40,000 cells/well except SK-MEL-5 cells, which were seeded at 4,000 cells/well in 24-well plates. The cells were grown in 400 μL fresh media (supplemented by 10% FBS). MEM Alpha media was used to culture human SK-MEL-28 cells, SK-MEL-5, MeWo, and C32 cells. B16-F0 and B16-F10 cells were cultured using DMEM media (GIBCO catalog No. 11965). The Saos-2 cells were cultured using McCoy’s 5A Medium (ATCC® Number: 30-2007) while the SW-620 cells were cultured in Leibovitz’s L-15 Medium (ATCC® Number: 30-2008). The PC-3 cells were cultured using RPMI media (Gibco Cat No. 11875-093).
The seeded cells were allowed 24 h for cell adhesion and environmental adaptation. Subsequently, the cells were treated with an additional 600 μL respective media containing various concentrations of cinnamic acid or its analogs for 48 h. The medium was removed and the wells were washed twice using respective media before adding 160 μL of 2 mg/mL yellow tetrazolium dye (3-(4, 5-dimethylthiazolyl-2)-2, 5-diphenyl tetrazolium bromide) (MTT) [26]. The plates were returned to the incubator for a period of 4 h. The residual MTT solution was removed from the wells and then 800 μL of DMSO was added to each well. The plates were stored at room temperature in a dark place for an additional 2 h before reading them at 570 nm using SPECTRAFluor Plus plate reader (Tecan Inc, Santa Margarita, CA). Results from three independent experiments in triplicate were averaged and presented. An analysis of variance (ANOVA) was carried out to compare the percentage of surviving cells for each compound at various concentrations followed by Bonferoni’s post t-test.
2.11 IC50 (48 h) calculation in SK-MEL-28 cells
The required concentration (IC50 in μM) of the cinnamic derivatives that can lead to a 50 % decrease in cell viability 48 h after incubation was calculated from the logarithmic regression equation derived from graphing the viability of the cells at 48 h versus the concentration of the tested agent. Results from three independent experiments in triplicate were averaged and presented.
2.12 MTT assay using biochemical modulators in SK-MEL-28 melanoma cells
1-Bromoheptane (BH) (75 μM), dicoumarol (DC) (10 μM), cyclosporin-A (CS) (15 μM), and trifluoperazine (TF) (15 μM) were used as biochemical modulators to assess the mechanism of CAPE toxicity in SK-MEL-28 melanoma cells. DMSO was used as a vehicle to dissolve BH, DC, CS and TF. DMSO (1 %) was therefore included in control experiments. Results from three independent experiments in triplicate were averaged and presented. An analysis of variance (ANOVA) was carried out to compare the percentage of surviving cells for each compound at various concentrations followed by Bonferoni’s post t-test.
2.13 Reactive oxygen species (H2O2) formation
Reactive oxygen species (ROS) formation was determined using 2′,7′-dichlorofluorescein diacetate as described previously [27]. Melanocytic SK-MEL-28 and amelanotic C32 cells were seeded at 40,000 cells per well in 96-well black microplates (Cat. No. 3603, Corning Incorporated, Corning NY). The cells were incubated at 37 °C for 24 h to allow for cell adhesion and environmental adaptation. The media was removed followed by addition of 100 μL of 2′, 7′-dichlorofluorescein diacetate [27]. Various concentrations of CAPE (7.5-150 μM) were added to the wells. Immediately upon addition, the plates were read at λem = 535 nm using λex = 485 by a SPECTRAFluor Plus plate reader (Tecan Inc, Santa Margarita, CA). Using the above method, dicoumarol (10 μM), a diaphorase inhibitor [28], 1-bromoheptane (75 μM), a GSH depleting agent [29], cyclosporin A (15 μM) and trifluoperazine (15 μM), inhibitors of the mitochondrial permeability transition pore (PTP) [30], were used as biochemical modulators to assess their effects on CAPE induced ROS formation in melanocytic SK-MEL-28 melanoma cells. Results from six replicates were averaged and presented.
2.14. Mitochondrial membrane potential
To investigate the biochemical mechanism of CAPE toxicity in SK-MEL-28 cells, mitochondrial membrane potential was determined in the presence and absence of modulators using Tetramethyl Rhodamine Methyl Ester (TMRM) florescent dye [31]. Briefly, SK-MEL-28 cells were seeded at 160,000 cells/well in 6 well plates in MEM media and allowed to attach overnight. After seeding, cyclosporin-A (CS) (15 μM) and ethylenediamine (EDA) (1 mM) were added to the respective wells 24 h prior to the addition of CAPE. Desired concentrations (15-50 μM) of CAPE were added to the 6 well plates. Equal volume of DMSO was added to control wells so that final concentration of DMSO was 1%. 20 μl (50 nM) TMRM (Invitrogen A/S, Catalog No. T668, Taastrup, Denmark) was added [31] 48 h after incubation. After mixing, the samples were incubated for 30 min at 37 ° C in the dark. Then cells were detached using versene solution (300–350 μL) (Cat. No. 15040, GIBCO, Carlsbad, CA). The detached cells were rinsed with ~500 μL of pre-warmed sterile phosphate buffered saline (PBS) at 37 °C. The mixture was transferred into a 1.5 mL eppendorf tube. The wells were additionally rinsed with sterile PBS and the contents were added to the rest of the cells collected. The cells were spun down at 1200 rpm (Beckman GPR Centrifuge, Fullerton, CA) for 3–5 min. Pelletted cells were re-suspended in 500 μl of PBS. The stained cells were analyzed using flow cytometer (Accuri C6 flow cytometer,, Ann Arbor, MI). 10,000 events were acquired and corrected for debris and aggregate population. Arithmetic mean values of fluorescence signal in arbitrary units were determined for each sample in triplicates.
2.15. Apoptosis assay
Apoptotic cells were identified by FITC-conjugated annexin V and propidium iodide using annexin V-FITC apoptosis assay kit [34] (Cat. No. PF032 EMD Biosciences, Gibbstown, NJ). Briefly, SK-MEL-28 cells were seeded at 160,000 cells/well in 6-well plates in MEM media and allowed to attach overnight. After seeding, the cells were transfected with the shRNA3 clone for 24 h. The untreated controls, transfected cells along with the non specific shRNA (negative control) transfected cells were treated with the desired concentration (15 μM) of CAPE. Equal volume of DMSO was added to controls so that final concentration of DMSO was 1%. 48 h after incubation, cells were detached using versene solution (300–350 μL) (Cat. No. 15040, GIBCO, Carlsbad, CA). The detached cells were rinsed with ~500 μL of pre-warmed sterile phosphate buffered saline (PBS) at 37 °C. The mixture was transferred into a 1.5 mL eppendorf tube. The wells were additionally rinsed with sterile PBS and the contents were added to the rest of the cells collected. The cells were spun down at 1200 rpm (Beckman GPR Centrifuge, Fullerton, CA) for 3–5 min. Pelletted cells were incubated with 5 μl of annexin FITC and 5 μl of propidium iodide in 100 μl of binding buffer for 15 min. Flow cytometry analysis was performed immediately after staining according to the manufacturer’s protocol. The stained cells were analyzed using a BD FACSCaliber flow cytometer (BD Biosciences, Franklin Lakes, NJ). 10,000 events were acquired and corrected for debris and aggregate population. Cells that were annexin (−) and PI (−) were considered viable cells. Cells that were annexin (+), PI (−) and annexin (+) and PI (+) were considered apoptotic cells. Cells that were annexin (−) and PI (−) were considered necrotic cells. The experiments were performed in triplicates.
2.16 Intracellular GSH measurement
Determination of intracellular GSH was based on a modified recycling method [16, 33, 35, 36]. In this reaction, GSH reacts with DTNB to form the disulfide GS-TNB and the yellow colored compound 5-thio-nitrobenzoic acid (TNB) was measured [16]. Briefly, human melanocytic SK-MEL-28 and amelanotic C32 melanoma cells were obtained from exponentially growing 90-95% confluent cultures and seeded at 1 million cells/mL in MEM Alpha media containing 10 % FBS in 24-well plates. The cells were incubated at 37 °C for 3 h to allow for cell adhesion and environmental adaptation. Subsequently, the cells were treated with an additional 1 mL MEM Alpha media containing various concentrations of CAPE (15 μM-200 μM) for 1, 2 and 3 h respectively. For each time point, the medium was removed, 100 μL trypsin-EDTA solution was added to dislodge the cells, followed by addition of 100 μL 3 % sulphosalicylic acid (SSA) to lyse the cells. The cells were monitored under the microscope in order to ensure all cells were detached and in suspension. The cells were then centrifuged at 14,000 rpm (4 °C) for 10 min. The supernatant was diluted 10-fold with phosphate buffer (100 mM containing EDTA 1 mM) pH 7.4. An aliquot of 50 μL was added to respective wells in a 96-well plate. 100 μL of master mix (NADPH 0.3 mM, DTNB 0.225 mM, GSSG reductase 1.6 Units/mL in phosphate buffer 100 mM containing EDTA 1 mM, pH 7.4) was added to each well. Immediately upon addition of the master mix, color development was recorded at 405 nm at 9 time intervals of 30 sec for 4 min using a Wallac 1420 microplate reader (Turku, Finland) equipped with kinetic analysis software [16]. Results from three experiments were averaged and presented.
2.17 Tyrosinase expression in melanoma and non melanoma cell lines
The expression of tyrosinase protein in melanocytic SK-MEL-28, SK-MEL-5, Me Wo, B16-F0 and B16-F10 cells and amelanotic C32, SK-MEL-24 cells and non melanoma SW-620, Saos-2, PC-3 cells was studied using standard western blotting procedures [33]. Cells obtained from exponentially growing 90-95 % confluent cultures were trypsinized, pelleted and washed twice with cold PBS. They were suspended in 50 mM Tris/HCl buffer (pH 8.0) containing 1 % glycerol, 1 mM EDTA, 0.5 mM phenylmethylsulfonyl fluoride (PMSF) and 2 mM benzamidine, and sonicated (Fisher sonic dismembrator, Model 100, Waltham, MA) and centrifuged (Eppendorf centrifuge, Westbury, NY) to prepare cell-free extracts. Equal amount of protein (50 μg) in different treatments were electrophoresed on 12 % SDS-polyacrylamide gels followed by transfer to Immobilon membranes (Immobilon-FL transfer membranes, Cat. No. IPFL00010, pore size 0.45 μm, Millipore, Bedford, CA). The blots were stained with 0.2 % Ponceau-S to ensure equal protein loading. The membranes were then blocked with 5 % non-fat dry milk in Tris-buffered saline (pH 8.0) containing 0.1 % Tween-20 for 2 h. Tyrosinase protein levels were detected by western blotting with a specific anti-tyrosinase monoclonal antibody (2 μg/ml) (Upstate Innovative Cell Signaling Solutions, Lake Placid, NY). Antigen-antibody complexes were visualized by enhanced chemiluminescence (Thermo Pierce, Rockford, IL). Band intensities were quantitated using the Quantity One Imaging System and Software (Biorad, Hercules, CA). The blots were reprobed with human anti-actin antibody (Millipore, Temecula, CA) for normalization.
2.18 shRNA transfection of SK-MEL-28 cells
Tyrosinase-proficient SK-MEL-28 cells (2 × 10⁶) were transfected with the 1 μg plasmid DNAs (of all shRNA clones) for 48 h using the FuGENE6 reagent (Roche Diagnostics Corporation, Indianapolis, IN) as previously described [32, 33, 35]. shRNA3, which was most efficient in curtailing tyrosinase expression was chosen for drug sensitivity experiments.
For cell viability assay using MTT assay, SK-MEL-28 cells were seeded at 160,000 cells/well in 6-well plates. 24 h after seeding, the cells were transfected with the shRNA clone as previously described [32, 33, 35].. 24 h later, the untreated controls and the transfected cells along with the non specific shRNA (negative control) transfected cells were treated with CAPE (15 μM) and incubated further for 48 h. Cell viability was assayed by MTT assay [26] by the procedure detailed above. Results from three experiments were averaged and presented.
Similar seeding procedures to those in 2.13 and 2.15 were used to investigate the role of shRNA tyrosinase silencing on ROS formation and apoptosis in SK-MEL-28 cells.
2.19 Partition coefficient and distribution coefficient
The lipid solubility for the tested compounds was estimated using partition coefficient values calculated by the LogP program available at www.logp.com. The following formula: log D=log P + log [1/(1+10E(pH-pKa)] was used to determine the LogD value (partition coefficient at pH 7.4). The degree of water solubility was estimated using the LogW values calculated by LogP program. LogW is the logarithm measure of the compounds in mole that is dissolved in a liter of water.
2.20 Statistical Analysis
Results from three to six replicate experiments have been reported as mean ± SD. An analysis of variance (ANOVA) was carried out to compare the percentage of surviving cells for each compound at various concentrations followed by Bonferoni’s post t-test.
3. Results
3.1 UV-VIS spectroscopy of tyrosinase/O2 mediated enzymatic oxidation of CAPE
The progression of CAPE’s oxidation by tyrosinase/O2 oxidizing system was monitored using a UV-VIS spectroscopy method. Addition of tyrosinase to CAPE solution led to a decrease in the absorbance of the CAPE peak at 326 nm. In addition, new peaks were formed over a range of 320-400 nm, indicating that new oxidation products with different absorption characteristics were formed (Fig. 1). The addition of ethylenediamine, an o-quinone trap, prevented the characteristics peaks at 320-400 nm. Moreover, GSH addition at the beginning of the oxidation reaction prevented the formation of the characteristic peaks at 320-400 nm. Ascorbic Acid (AA) and NADH demonstrate distinctive peaks at 266 nm and 340 nm, respectively. Upon the addition of tyrosinase to the reaction mixture containing CAPE, the absorbance of 266 nm and 340 nm peaks significantly diminished, indicating oxidation of AA and NADH, respectively (Fig. 1). However, the addition of GSH at the beginning of the reaction significantly prevented AA and NADH oxidations. These findings indicate that tyrosinase oxidized CAPE through two-electron oxidation to quinone [37], which in turn oxidized AA and NADH. The spectrum of CAPE alone was stable in the solution during the experiment indicating that it did not undergo auto-oxidation.
Figure 1. UV-Vis overlay scans for CAPE oxidation by tyrosinase/O2 at pH 7.4.
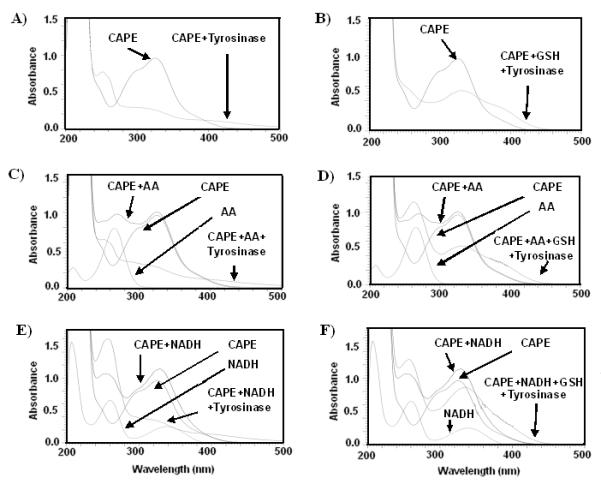
(A) Addition of tyrosinase enzyme to the reaction mixture containing CAPE resulted in the formation of the characteristic spectra at 320-400 nm. (B) Addition of GSH prior to tyrosinase did not result in the formation of the characteristic peaks. Ascorbic Acid (AA) and NADH demonstrate distinctive peaks at 266 nm and 340 nm, respectively. (C-E) Upon the addition of tyrosinase to the reaction mixture containing CAPE, the absorbance of 266 nm and 340 nm peaks significantly diminished, indicating oxidation of AA and NADH, respectively.
3.2 UV-VIS spectroscopy of HRP/H2O2 mediated enzymatic oxidation of CAPE
The progression of CAPE’s oxidation by HRP/H2O2 oxidizing system was monitored using a UV-VIS spectroscopy method. Addition of HRP/H2O2 led to a decrease in the peak absorbance of CAPE at 326 nm, and the formation of new peaks over the range of 240-350 nm, indicating that new oxidation products with different absorption characteristics were formed (Fig. 2). Addition of GSH at the beginning of the oxidation reaction did not result in the formation of the characteristic spectra at 240-350 nm. AA and NADH demonstrate distinctive peaks at 266 nm and 340 nm, respectively. Upon the addition of HRP/H2O2 to the reaction mixture containing CAPE, the absorbance of 266 nm and 340 nm peaks diminished significantly, indicating oxidation of AA and NADH, respectively (Fig. 2). Addition of GSH at the beginning of the oxidation reaction did not result in a significant decrease in the absorbance of 266 nm and 340 nm peaks, respectively. These results indicate that CAPE was oxidized by HRP/H2O2 through one-electron oxidation to a semiquinone [38], which in turn oxidized AA and NADH. The spectrum of CAPE alone was stable in the solution during the experiment indicating that it did not undergo auto-oxidation.
Figure 2. UV-Vis overlay scans for CAPE oxidation by HRP/H2O2 at pH 7.4.
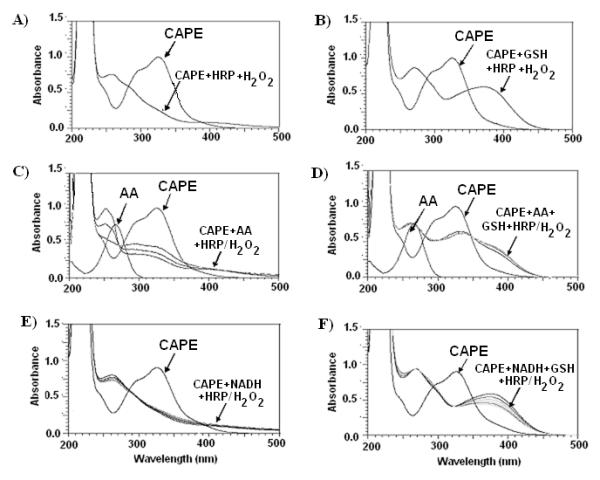
(A) Addition of HRP/H2O2 to the reaction mixture containing CAPE resulted in the formation of the characteristic spectra at 240-350 nm. (B) Addition of GSH prior to HRP/H2O2 addition did not result in the formation of the characteristic peaks. Ascorbic Acid (AA) and NADH demonstrate distinctive peaks at 266 nm and 340 nm, respectively. (C-E) Upon the addition of HRP/H2O2 to the reaction mixture containing CAPE, the absorbance of 266 nm and 340 nm peaks diminished significantly, indicating oxidation of AA and NADH, respectively.
3.3 The rate of AA and NADH oxidation
The extent of AA, NADH and GSH depletion were used to measure the extent of CAPE oxidation by tyrosinase/O2 and HRP/H2O2 (Fig. 3) [14]. The orders of biochemical depletion by tyrosinase and HRP/H2O2 were AA> NADH >GSH and AA, NADH>GSH, respectively. GSH was effective in preventing AA and NADH depletion in tyrosinase/O2/CAPE and HRP/H2O2/CAPE kinetic reaction. The rates of AA and NADH oxidation by the tyrosinase/O2 metabolizing system were 70 and 10 nM (AA and NADH depletion)/CAPE (μM)/tyrosinase (U/mL)/min, respectively. The rates of AA and NADH oxidation in the presence of GSH were significantly reduced to 0.2 nM and 0.08 nM GSH depletion/CAPE (μM)/tyrosinase (U/mL)/min, respectively, by tyrosinase/O2 oxidizing system. Moreover, the addition of ethylenediamine, an o-quinone trap, significantly prevented NADH and AA oxidation mediated by tyrosinase bioactivation of CAPE.
Figure 3. Kinetic scans for CAPE oxidation by tyrosinase/O2 and HRP/H2O2.
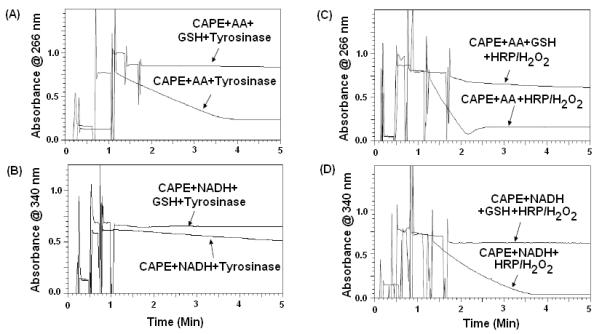
AA and NADH oxidations were monitored at 266 and 340 nm, respectively. (A-B) The rate and extent of AA and NADH oxidation as a result of CAPE metabolism by tyrosinase/O2 at pH 7.4. (C-D) The rate and extent of AA and NADH oxidation as a result of CAPE metabolism by HRP/H2O2 at pH 7.4. Addition of GSH prior to tyrosinase or HRP/H2O2 completely prevented AA and NADH oxidation. GSH diminished the rate of AA and NADH oxidations by CAPE/tyrosinase/O2 or HRP/H2O2 oxidizing system.
The rates of AA and NADH oxidation by the HRP/H2O2 oxidizing system were 804 and 867 μM (AA and NADH depletion)/CAPE (μM)/HRP (μM)/min, respectively, whereas the rates of AA and NADH oxidation in the presence of GSH were significantly reduced to 10 μM and 5 μM GSH depletion/CAPE (μM)/HRP (μM)/min, respectively. Hence, the rate of AA and NADH oxidation by the HRP/H2O2 (one-electron oxidation) was found to be significantly higher in comparison to the tyrosinase/O2 oxidizing system (two-electron oxidation).
3.4 Enzymatic oxidation of cinnamic acid and its analogs by tyrosinase/O2
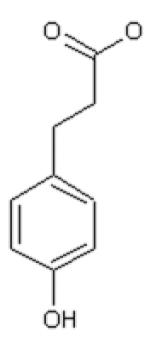
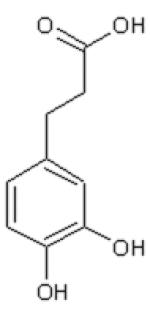
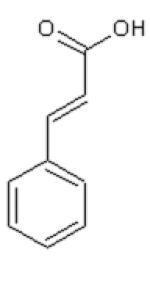
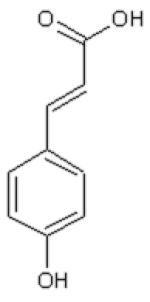
Dihydrocinnamic acid (DHCinA), 4-hydroxypropionic acid (4-HPP), dihydrocaffeic acid (DHCA), cinnamic acid (CinA), 4-hydroxycinnamic acid (4-HCA), caffeic acid (CA), ferulic acid (FA), chlorogenic acid (CGA) and CAPE demonstrated 32±3 %, 42±2 %, 200±4 %, 40±7 %, 16±3 %, 200±6 %, 46±2 %, 200±5 % and 82±6 % GSH depletion, respectively, by the tyrosinase/O2 metabolizing system. For instance, on a molar basis, 0.8 mole GSH was depleted per mole of CAPE when CAPE was metabolized by the tyrosinase/O2 oxidizing system after 2 h incubation (Table 1). The amount of GSH depletion over the indicated incubation times was used to estimate the GSH depletion rate. Negligible GSH depletion occurred in the absence of the enzyme (data not shown).
Table 1. Summary results for cinnamic acid analogs.
Cytotoxicity of phenolic compounds indicated as IC50 (48 h) towards SK-MEL-28 melanoma cells and LD50 (2 h) in isolated rat hepatocytes [48]. The results for the metabolism of phenolic compounds by rat liver microsomal preparations and tyrosinase also included. The Log P values were estimated using the LogP program available at www.logp.com. Distribution coefficient value at pH 7.4 was calculated from log D=log P + log [1/(1+10E(pH-pKa)]. IC50 (48 h) is the inhibitory concentration leading to 50 % cell viability as determined by MTT assay at 48 h incubation time. LD50 (2 h) is the lethal concentration leading to 50 % cell death as determined by trypan blue exclusion assay at 2 h incubation time.
 |
 |
 |
 |
 |
 |
 |
 |
 |
|
|---|---|---|---|---|---|---|---|---|---|
| DHCinA | 4-HPP | DHCA | CinA | 4-HCA | CA | FA | CGA | CAPE | |
| LD50 (day 2) SK-MEL-28 | 5 mM | 1.5 mM | 2.2 mM | 2.8 mM | 4.4 mM | 2.3 mM | 2 mM | >5 mM | 15 μM |
| LD50 (2 h) rat hepatocytes | -- | -- | 6 mM | -- | -- | 10 mM | 25 mM | 23 mM | -- |
| Microsomes GSH depletion (2 h) | 64±3% | 56±4% | 88±5% | 110±7% | 92±5% | 128±6% | 146±7% | 120±4% | 46±7% |
| Tyrosinase GSH depletion (2 h) | 32±3% | 42±2% | 200±4% | 40±7% | 16±3% | 200±6% | 46±2% | 200±5% | 82±6% |
| LogP value | 1.60 | 1.08 | −0.06 | 2.31 | 1.85 | 1.01 | 1.92 | −0.19 | 2.86 |
| LogW value | −1.56 | −1.44 | −1.30 | −2.04 | −1.83 | −1.65 | −2.34 | −1.71 | −4.01 |
3.5 Enzymatic oxidation of cinnamic acid and its analogs by rat liver P450 microsomal preparation
DHCinA, 4-HPP, DHCA, CinA, 4-HCA, CA, FA, CGA and CAPE depleted GSH for 64±3 %, 56±4 %, 88±5 %, 110±7 %, 92±5 %, 128±6 %, 146±7 %, 120±4 % and 46±7 %, respectively, at 2 h incubation with CYP2E1 pyrazole induced rat liver microsomes. For instance, on a molar basis, 0.5 mole GSH per one mole of CAPE was depleted when CAPE was oxidized by CYP2E1 pyrazole induced rat liver microsomal preparations after 2 h incubation (Table 1).
3.6 IC50 (48 h) in SK-MEL-28 cells
The IC50 (48 h) concentration was determined by MTT assay [26] as a measure of melanoma cell viability. The required concentration of the compound that can lead to 50 % decrease in melanoma cell viability 48 h after incubation with cells is known as IC50 (48 h). Cinnamic acid and its analogs were tested repeatedly to determine melanoma cell toxicity at 48 h (Table 1). The regression analysis of the toxicity of these compounds at various doses showed concentration- and time-dependent cytotoxicity (data not shown).
3.7 Anti-proliferative assay in melanoma and non melanoma cell lines
When tested at 15 μM concentration, CAPE showed considerable and selective toxicity in human and murine melanocytic B16-F0, B16-F10, SK-MEL-5 and MeWo melanoma cells resulting in 58±6 %, 60±4 %, 57±3 %, and 51±6 % cell viability, respectively (Fig. 4). When tested in amelanotic SK-MEL-24 and C32 cells with CAPE (15 μM) the cell viability were 81±7% and 86±4 % 48 h after incubation, clearly indicating that CAPE was less toxic towards these two cell lines (Fig. 4). CAPE demonstrated negligible toxicity at 15 μM when tested in colorectal adenocarcinoma (SW-620) cells (viability of 89±3 %), osteosarcoma (Saos-2) cells (viability of 90±6 %), and prostate (PC-3) cells (viability of 88±3 %) demonstrating that CAPE was selectively more toxic towards the five melanocytic melanoma cell lines tested in this study (Fig. 4). These findings indicate that CAPE was significantly more toxic towards melanocytic melanoma cell lines that express tyrosinase [39] than non melanoma and amelanotic SK-MEL-24 and C32 melanoma cells, which do not express tyrosinase activity [40].
Figure 4. CAPE toxicity in melanoma and non melanoma cell lines.
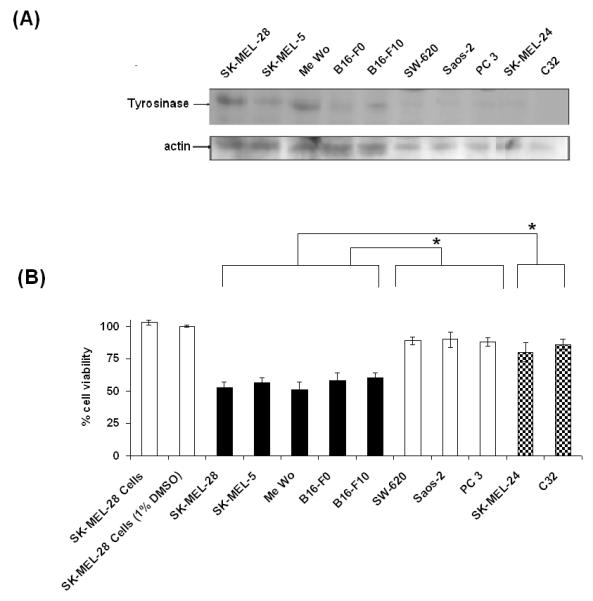
(A) Tyrosinase expression in respective melanoma and non-melanoma cell lines. Tyrosinase protein levels were detected by western blotting with a specific anti-tyrosinase monoclonal antibody. The anti-tyrosinase monoclonal antibody recognizes tyrosinase (80 kDa). (B) CAPE toxicity in melanocytic melanoma SK-MEL-28, SK-MEL-5, Me Wo, B16-F0, B16-F10, non melanoma SW-620, Saos-2, PC 3 and amelanotic melanoma SK-MEL-24 and C32 cell lines. Note that the controls for all the cell lines were performed but not included in this figure. The control in the figure refers to untreated SK-MEL-28 control cells. The viability for the other respective cell lines treated with CAPE is indicated with reference to their respective control cell lines.
3.8 The biochemical mechanism of CAPE toxicity in SK-MEL-28 melanoma cells
To investigate the biochemical mechanism of CAPE toxicity in SK-MEL-28 cells, cell viability was determined in the presence and absence of modulators using MTT assay. The modulators were added to the respective wells 20 min prior to the addition of CAPE. SK-MEL-28 cell viability was determined 48 h after CAPE addition. DC (10 μM), a diaphorase inhibitor [28], and BH (75 μM), an intracellular GSH depleting agent [29], enhanced CAPE toxicity. 48 h after incubation dicoumarol (10 μM) enhanced CAPE (7.5 μM) toxicity by 39 % upon its co-incubation with SK-MEL-28 cells (*p<0.05) (Fig. 5A). BH (75 μM) increased CAPE (7.5 μM) toxicity for 26 % at 48 h incubation (Fig. 5A) (*p<0.05). CS, an inhibitor of the PTP in mitochondria [30], prevented CAPE induced cell toxicity in SK-MEL-28 cells. 48±7 % viability was observed when CS was co-incubated with CAPE as compared to 23±2 % viability when CAPE (30 μM) was incubated alone (Fig. 5B). A significant protective effect was observed for TF. Co-incubation of TF (15 μM), a PTP inhibitor [30], with CAPE (30 μM) increased viability from 23±2 % to 57±3 % at 48 h incubation with SK-MEL-28 cells (Fig. 5B). The modulators alone had no significant toxicity effect when incubated with the cells.
Figure 5. Toxicity of CAPE in the presence of various biochemical modulators (48 h).
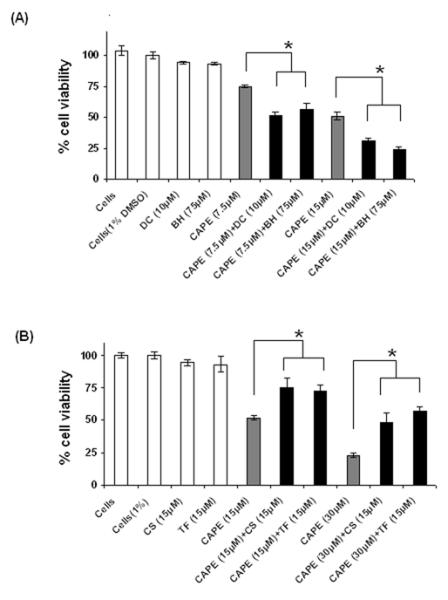
(A) BH and DC significantly increased CAPE toxicity (*p<0.05); (B) CS and TF significantly reduced CAPE toxicity (*p<0.05) in SK-MEL-28 cells. Cyclosporin A (CS), Trifluoperazine (TF), inhibitors of PTP in mitochondria.
3.9 CAPE toxicity results in tyrosinase shRNA transfected cells
Using MTT anti-proliferative assay, CAPE (15 μM) toxicity in SK-MEL-28 cells was investigated in tyrosinase shRNA transfected cells. A non-specific shRNA (NS-shRNA) plasmid was used as control. Transfection with the shRNA clone 3 curtailed tyrosinase expression by 50 % as measured by the densitometric analysis of bands obtained in the western blot using Quantity One software (Biorad, Hercules, CA). shRNA 3 resulted in a significant and reproducible reduction of CAPE toxicity. The percentage of cell viability as determined by the MTT assay were 43±6 % for untransfected cells compared to the 87±5 % in tyrosinase shRNA transfected cells (Fig. 6). No increase in SK-MEL-28 cell viability was observed in wells treated with the tyrosinase non specific shRNA plasmid (NS-shRNA), thereby suggesting that CAPE induced melanoma cell toxicity was primarily due to tyrosinase-mediated activation of CAPE.
Figure 6. CAPE toxicity in the presence and absence of tyrosinase shRNA silencing plasmid.
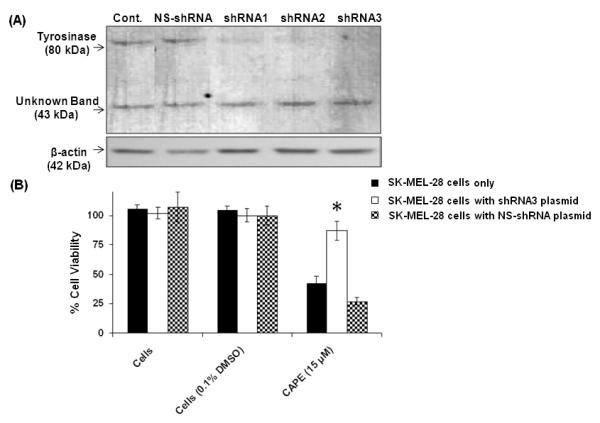
(A) Tyrosinase protein levels were detected by western blotting with a specific anti-tyrosinase monoclonal antibody. The anti-tyrosinase monoclonal antibody recognizes tyrosinase (80 kDa). Transfection with shRNA3 clone curtailed tyrosinase expression for 50 %. (B) CAPE (15 μM) did not cause significant toxicity (*p<0.05) in SK-MEL-28 cells silenced with shRNA plasmid directed against tyrosinase.
3.10 Reactive oxygen species (H2O2) formation
Our results indicate that CAPE at concentrations ranging from 15-300 μM at various time points showed a concentration- and time-dependent escalation in ROS formation in melanocytic SK-MEL-28 melanoma cells (Fig 7A) whereas no significant ROS was formed in amelanotic C32 melanoma cells (Fig 7B). Tyrosinase shRNA transfection in SK-MEL-28 cells significantly prevented CAPE (15-300 μM) induced ROS formation (Fig. 7C). A scrambled, non-specific shRNA (NS-shRNA) plasmid was used as control, which did not have a protective effect against CAPE induced ROS formation. Transfection with the shRNA clone 3 curtailed tyrosinase expression by 50 % as measured by the densitometric analysis of bands obtained in the western blot using Quantity One software (Biorad, Hercules, CA).
Figure 7. ROS formation in human melanocytic SK-MEL-28 and amelanotic C32 melanoma cells.
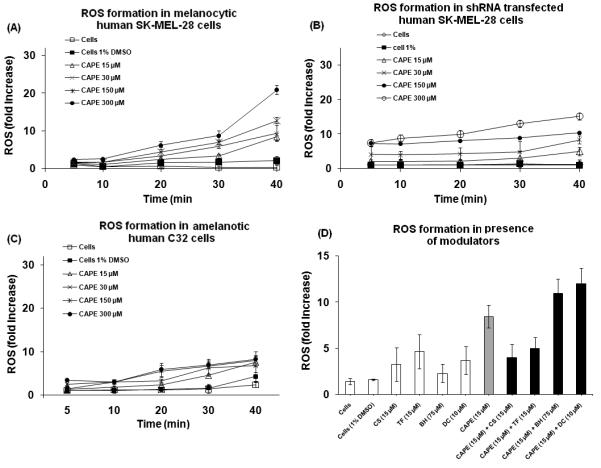
(A) CAPE (15-300 μM) led to a time- and concentration-dependent escalation in ROS formation in human melanocytic SK-MEL-28 cells. (B) CAPE (15-300 μM) led to significantly less (*p<0.05) ROS formation in amelanotic C32 melanoma cells. (C) CAPE caused significantly less ROS formation (*p<0.05) in SK-MEL-28 cells transfected with tyrosinase shRNA plasmid. (D) ROS formation in the presence of modulators in SK-MEL-28 cells (*significantly different p<0.05).
Co-incubation of CAPE with CS (15 μM), an inhibitor of the PTP [30], led to a statistically significant decrease in ROS formation from 8±1 fold to 4±1 fold (Fig. 7D). Similar results were observed in the presence of TF, a PTP inhibitor [30]. Co-incubation of TF (15 μM) with CAPE (15 μM) led to a statistically significant decline in ROS formation at 40 min from 8±1 fold to 5±1 fold (Fig. 7D). DC (10 μM), a diaphorase inhibitor [28], increased CAPE induced ROS formation from 8±1 fold to 12±2 fold (Fig. 7D). BH (75 μM), a GSH depleting agent [29], increased CAPE induced ROS formation from 8±1 fold to 11±2 fold (Fig.7D). The modulators had no significant effect when incubated alone with the cells. These findings suggest that mitochondria were a major source of ROS formation as a result of CAPE induced toxicity in melanoma cells.
3.11 Mitochondrial membrane potential
CAPE (15-50 μM) showed concentration- and time-dependent decrease in mitochondrial membrane potential (Fig. 8A). Both CS, an inhibitor of the PTP [30], and ethylenediamine, an o-quinone trap [17, 18], protected against the effect of CAPE on mitochondrial membrane potential significantly. For instance, CAPE (15 and 30 μM) decreased the mitochondrial membrane potential by 17±1 % and 20±2 %, respectively, whereas in the presence of CS and ethylenediamine the decrease in mitochondrial membrane potential were 8±1 % and 12±1 % for CS, respectively, and 4±1 % and 10±1 % for ethylenediamine, respectively (Fig. 8B).
Figure 8. Mitochondrial membrane potential.

(A) Concentration- and time-dependent decrease in mitochondrial membrane potential. (B) The protective effect of cyclosporin-A (CS), a PTP inhibitor, and ethylenediamine, an o-quinone trap, on mitochondrial membrane potential.
3.12. Apoptosis assay
SK-MEL-28 melanoma cells incubated with CAPE (15 μM) demonstrated 12.5±0.7% apoptotic cell death (2.5 fold increase) in comparison to untreated control cells (Fig. 9), whereas tyrosinase shRNA transfection in SK-MEL-28 cells significantly prevented CAPE induced apoptotic cell death. A non-specific shRNA (NS-shRNA) plasmid was also used as control, which did not have a protective effect against CAPE induced apoptotic cell death.
Figure 9. CAPE induced apoptotic cell death in presence and absence of tyrosinase shRNA.
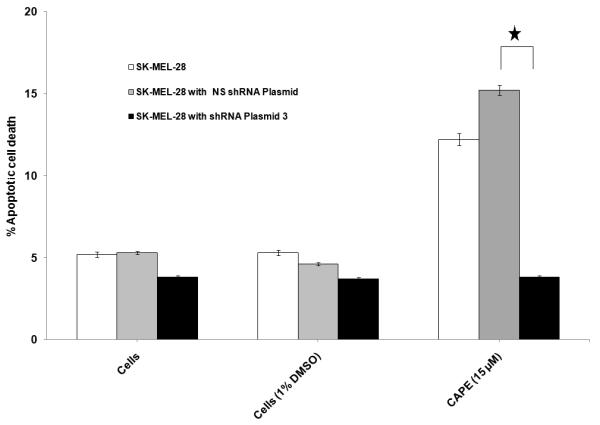
Transfection of SK-MEL-28 cells with tyrosinase shRNA significantly prevented CAPE induced apoptotic cell death.
3.13 Intracellular GSH measurement
The effect of CAPE on intracellular GSH depletion were also investigated in human melanocytic SK-MEL-28 cells, which express functional tyrosinase [39] and amelanotic C32 melanoma cells, which do not express functional tyrosinase [40]. Our findings indicate that CAPE (15 μM, 50 μM, 100 μM and 200 μM) depleted 11±4 %, 19±2 %, 26±1 % and 54±1 % of intracellular GSH at 2 h after incubation with SK-MEL-28 cells, respectively (Fig. 10), whereas it depleted 3±2 %, 10±2 %, 13±3 %, and 24±2 % of intracellular GSH at 2 h after incubation with human amelanotic C32 cells, respectively (Fig. 10), indicating that melanocytic SK-MEL-28 melanoma cells were more susceptible to CAPE than amelanotic C32 melanoma cells. As shown in Fig. 10, CAPE (15 μM, 50 μM, 100 μM and 200 μM) showed time dependency with respect to depletion in intracellular GSH after 1, 2 and 3 h incubation with SK-MEL-28 melanoma cells. In addition, the cell viability was determined by the trypan blue assay to confirm that cells were viable and that the observed intracellular GSH depletion was not due to a decrease in viability.
Figure 10. Selective intracellular GSH depletion in human melanocytic SK-MEL-28 and amelanotic C32 melanoma cells.
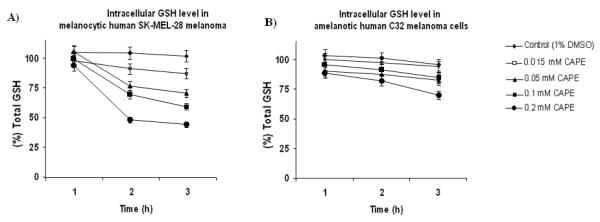
(A) Intracellular GSH depletion by CAPE in human melanocytic SK-MEL-28 melanoma cells, and (B) Intracellular GSH level in human amelanotic C32 melanoma cells. CAPE (15 μM-200 μM) showed concentration- and time-dependent intracellular GSH depletion in melanocytic human SK-MEL-28 cells but not in amelanotic C32 melanoma cells.
3.14 Partition coefficient and distribution coefficient
The LogP and LogW values of the tested compounds were summarized in Table 1. For instance the LogP values for caffeic acid and CAPE were estimated to be 1.01 and 2.86, respectively. The pKa value of the carboxylic moiety for caffeic acid is 4.62, which indicates that caffeic acid is ionized more than 99 % at physiological pH of 7.4 whereas CAPE is not significantly ionized at pH 7.4. Using the formula LogD=LogP + Log [1/(1+10E(pH-pKa)], the LogD value (partition coefficient at pH 7.4) was determined for caffeic acid to be (−1.77) whereas LogD (partition coefficient at pH 7.4) for CAPE remains the same because CAPE is an ester of caffeic acid and lacks the carboxylic moiety and therefore is unable of undergoing a significant ionization at pH 7.4. Evaluation of the antilog LogD values at pH 7.4 indicates that CAPE is 40,000 fold more lipid soluble than caffeic acid at pH of 7.4. The LogD physico-chemical property may therefore partially explain the reason behind the greater toxicity of CAPE over caffeic acid.
The LogW values of caffeic acid and CAPE are estimated to be −1.65 and −4.01, respectively, corresponding to a water solubility of 4.5 mM and 100 μM, respectively, indicating that caffeic acid is 45 fold more water soluble than CAPE.
4. Discussion
Melanin production is principally responsible for skin color and plays a significant role in protecting the skin from UV light [41]. Tyrosinase (polyphenol oxidase), a copper-containing monooxygenase, is unique to the melanocytes and is the key enzyme involved in melanogenesis [41]. The presence of tyrosinase in human melanomas has led to a rational approach in the development of drugs targeted towards this disease [16, 20, 41]. In our studies, we used tyrosinase as a molecular target to develop anti-melanoma drugs that could be bioactivated intracellularly to selectively target the malignant cells, while sparing normal tissues devoid of the enzyme.
Phenolic compounds are known to show potent antioxidant activity [42]. Their antioxidant properties can be exploited to cause inhibition of melanogenesis and thus an anti melanoma effect. Naturally occurring hydroxycinnamic acid derivatives are reported to have anticancer, anti-inflammatory, antibacterial and antioxidant properties [4, 5]. A study by Liu et al that investigated the role of cinnamic acid in various human tumor cell lines concluded that it reduced invasive capacity and modulated the expression of genes involved in metastasis [43]. A study by Grunberger reports a dramatic inhibitory effect of CAPE on incorporation of [3H] thymidine into the DNA of human melanoma cell lines [8]. Interestingly the study also showed human tumor cell lines exhibited a significantly greater sensitivity to the action of CAPE than normal cell lines [8]. Recently we also reported the anti-melanoma effect of CAPE in in-vivo subcutaneous tumor model of melanoma in C57BL/6 mice [12]. However none of these studies investigated cinnamic acid derivatives for their potential in anti-melanoma therapy. Moreover, these studies did not investigate the role of tyrosinase in the biochemical mechanism of toxicity in SK-MEL-28 melanoma cells.
We thus investigated in this report the quantitative structure activity relationship (QSTR) of tyrosinase dependant cytotoxicity of a series of cinnamic acid derivatives including CAPE in SK-MEL-28 melanoma cells. Dihydrocinnamic acid (DHCinA), 4-hydroxypropionic acid (4-HPP), dihydrocaffeic acid (DHCA), 4-hydroxycinnamic acid (4-HCA), caffeic acid (CA), ferulic acid (FA), chlorogenic acid (CGA) and CAPE are all analogs of cinnamic acid with various modifications on the ring and side chain (Table 1). Our findings indicated that no correlation was observed between the presence of a double bond on the side chain, or between presence or absence of hydroxy groups on the aromatic ring and toxicity in SK-MEL-28 melanoma cells. In addition, based on reported LD50 (2 h) [48], the cinnamic analogs are not toxic towards isolated rat hepatocytes. This is because they contain a carboxylic group that is highly ionizable at pH 7.4; hence, unable to cross biological membrane effectively at pH 7.4. Moreover, the cinnamic analogs are several folds (3-12 folds) less toxic to isolated rat hepatocytes than SK-MEL-28 melanoma cells (Table 1).
Based on the IC50 (48 h) in human SK-MEL-28 melanoma cells, CAPE demonstrated 153-fold greater toxicity than caffeic acid. This observation could partially be explained by greater distribution coefficient value of CAPE at pH 7.4. The comparison of the antilog LogD values at pH 7.4 indicates that CAPE is 40,000 fold more lipid soluble than caffeic acid and therefore it can partition more readily than caffeic acid into lipid phase; pass through cell membrane and enter melanoma cells where it can be metabolized by tyrosinase to an o-quinone. In addition, using LogW value, the water solubility of CAPE is estimated to be 100 μM which makes the CAPE IC50 (48 h) concentration of 15 μM readily achievable without a major solubility problems.
In-vitro enzyme assays performed using tyrosinase enzyme and CYP2E1 induced rat liver microsomes showed CAPE was significantly oxidized by tyrosinase enzyme to give o-quinone while it underwent significantly less oxidation by the CYP2E1 induced rat liver microsomal preparation. In order to investigate the mechanism and toxicity in human SK-MEL-28 cells, CAPE oxidation was monitored by UV-VIS spectroscopy using the tyrosinase/O2 enzyme system. CAPE has a characteristic absorbance at 326 nm. Our UV-Vis spectra studies for CAPE oxidation monitored in the presence of tyrosinase/O2 demonstrate the development of new peaks (320-400 nm). The new peaks were not formed when GSH was added prior to tyrosinase addition suggesting possible GSH conjugate formation with o-quinone. Tandem mass spectroscopy (LC/MS/MS) of the sample demonstrated that CAPE formed a mono-glutathione conjugate (data not shown). AA and NADH prevented the formation of the new peaks (320-400 nm) by reacting with the quinone formed (Fig. 11), however, as soon as the NADH and AA were depleted the characteristic peaks (32-400 nm) were again formed. Our findings also indicate that GSH was effective in preventing AA and NADH depletion in tyrosinase/O2/CAPE reaction.
Figure 11. Proposed biochemical mechanism of CAPE induced toxicity in melanoma cells.

Caffeic Acid Phenylethyl Ester (CAPE) underwent oxidation by tyrosinase through two-electron oxidation to quinone [37]. CAPE was oxidized by HRP/H2O2 through one-electron oxidation to a semiquinone [38]. CAPE toxicity towards SK-MEL-28 human melanoma cells was significantly enhanced by dicoumarol (DC), a diaphorase inhibitor, and 1-bromoheptane (BH), a GSH depleting agent. Ascorbic acid (AA), nicotinamide adenine dinucleotide (NADH), and glutathione (GSH) were depleted as a result of CAPE oxidation mediated by tyrosinase bioactivation. Ethylenediamine, an o-quinone trap [17, 18], reacts with CAPE o-quinone, preventing NADH and AA oxidation.
We also investigated the biochemical basis of CAPE induced toxicity in human SK-MEL-28 melanoma cells using a number of modulators to enhance and/or prevent CAPE toxicity. Our studies indicate that CAPE toxicity towards SK-MEL-28 human melanoma cells was significantly enhanced by dicoumarol, a NAD(P)H:quinone oxidoreductase inhibitor [28], and 1-bromoheptane, a GSH depletory agent [29]. Ascorbic acid (AA), NADH and GSH are intracellular anti-oxidants. In addition NADH plays a critical role as a cellular energy supply. In addition, using UV-VIS spectroscopy, ethylenediamine, an o-quinone trap, was able to react with o-quinone, and prevent NADH and AA oxidation mediated by tyrosinase bioactivation of CAPE (data not shown). Similar results were observed for 4-hydroxyanisole (4-HA) [14] and 4-t-butylcatechol as positive controls (data not shown). Both 4-HA [14] and 4-t-butylcatechol [15] were reported as substrates for tyrosinase, previously. The events related to AA, NADH, ethylenediamine, and GSH depletion and oxidation, o-quinone formation and GS-conjugate formation are illustrated in Fig. 11.
Moreover, ROS formation was investigated using the 2′, 7′-dichlorofluorescein assay [27] when CAPE was incubated with SK-MEL-28 cells. Our findings suggest that CS and TF, inhibitors of PTP protein in mitochondria [30], prevented CAPE induced toxicity and ROS formation in melanoma cells thus limiting CAPE mediated cell toxicity. These findings also clearly indicate that mitochondria were the major source of ROS formation. Furthermore, CAPE caused a decrease in mitochondrial membrane potential which was prevented by CS, an inhibitor of PTP protein in mitochondria, and ethylenediamine, an o-quinone trap, indicating that CAPE effect is partly due to mitochondrial toxicity.
Our studies with 1-bromoheptane, a GSH depletory agent [29], and dicoumarol, a diaphorase inhibitor [28], indicate a significant increase in ROS formation when co-incubated with CAPE in SK-MEL-28 melanoma cells. Dicoumarol is an inhibitor of diaphorase [28], an enzyme that catalyzes two-electron reduction of quinone to catechol. Cytochrome c reductase belongs to the family of oxidoreductases, specifically those acting on diphenols and related substances as donor with a cytochrome as acceptor [44]. It shuttles electrons from NADPH to cytochrome c and catalyzes the one-electron reduction of many drugs and foreign compounds [38]. It is postulated that the physiological role of the reductase is to balance the reduced/oxidized pyridine nucleotide ratio during growth [38]. Increase in ROS formation when SK-MEL-28 cells were co-incubated in the presence of CAPE and DC could be explained by the fact that dicoumarol mediated inhibition of the two-electron reduction mechanism resulted in shuttling the quinone to one-electron reduction in the presence of cytochrome c reductase leading to the formation of semi-quinone and superoxide, which in turn increased ROS formation significantly. Thus, two-electron reduction mediated by diaphorase primarily serves as a detoxification pathway for cells, whereas one-electron reduction mediated by cytochrome c reductase is primarily responsible for formation of reactive oxygen species and resulting toxicity. We also investigated the rate of AA and NADH depletion to measure the extent of CAPE oxidation by tyrosinase/O2 and HRP/H2O2. Peroxidase catalyzes a one-electron oxidation of catechols [38], whereas tyrosinase oxidizes catechols through a two-electron oxidation mechanism [37]. Our data indicates CAPE was more rapidly oxidized by HRP/H2O2 than tyrosinase/O2, thus suggesting an important role for the semi-quinone pathway in melanoma cell toxicity.
The GSH content of malignant tumors compared to normal tissues has been associated with resistance to chemotherapeutic drugs [45-47]. The resistance in most cases is associated with higher GSH levels within these cancer cells. Thus, approaches to cancer treatment could potentially benefit from a selective GSH-depleting strategy [16, 41, 45]. We studied the implications of intracellular GSH depletion on CAPE cytotoxicity in human SK-MEL-28 cells. Determination of intracellular GSH was based on a modified GSSG reductase recycling method using a new reagent [16]. The method was modified for measurement of intracellular GSH [16]. GSH plays a key role in protecting cells from electrophilic compounds and free radicals generated during cellular metabolism. GSH is used by cells to detoxify reactive intermediates and is critical for elimination of many drugs, including CAPE. Depletion of GSH can lead to tumor cell death in-vitro, especially in melanocytic cells that generate high levels of oxyradicals [47]. Our data indicates that CAPE caused a significant depletion of intracellular GSH after a short incubation time of 1-3 h without a significant change in cell viability thereby concluding that GSH depletion preceded cell toxicity, thus making it vulnerable to drug mediated cell toxicity and leading to desirable melanoma cell death.
In current work, in order to further substantiate the tyrosinase mediated toxicity hypothesis, we investigated drug induced toxicity using tyrosinase shRNA plasmid constructs targeted towards tyrosinase expression in human melanocytic SK-MEL-28 melanoma cells. Our results indicate that CAPE (15 μM) showed significantly less cell toxicity when tyrosinase was silenced by shRNA plasmid, thus providing further evidence that melanoma cytotoxicity was mediated in part by tyrosinase. Tyrosinase shRNA transfection also prevented CAPE induced apoptotic cell death and ROS formation, clearly confirming the central role of tyrosinase in CAPE induced toxicity in SK-MEL-28 cell line.
In order to investigate the role of tyrosinase, the cytotoxicity of CAPE was also investigated in amelanotic C32 and SK-MEL-24 melanoma cell lines, which do not express tyrosinase [40], it was found that CAPE demonstrated significantly less toxicity towards amelanotic C32 and SK-MEL-24 melanoma cell lines than in melanocytic SK-MEL-28 melanoma cells, which express tyrosinase [39]. CAPE also led to significantly less ROS formation and ICG depletion in amelanotic C32 than in melanocytic SK-MEL-28 cells. The biochemical basis of CAPE induced toxicity in human SK-MEL-28 melanoma cells and the roles of GSH/AA/NADH have been summarized in Fig. 11.
In summary, our investigation suggests that reactive intermediate species, intracellular GSH depletion, ROS formation and induced mitochondrial toxicity significantly contributed towards CAPE toxicity in melanoma cells. In this light, our study elucidates the role of tyrosinase in the biochemical mechanism of CAPE induced toxicity in melanoma cell lines. Further investigation into CAPE in-vivo efficacy and toxicity in melanoma tumor bearing mice is currently under investigation in our laboratory.
Acknowledgements
This work was supported partly by a grant from NIH (1R15CA122044-01A1) and the TTUHSC School of Pharmacy.
Financial Support: 1. School of Pharmacy Texas Tech University Health Sciences Center 1406 S Coulter, Amarillo, Texas, 79106, USA.
2. NCI/NIH, 1R15CA122044-01A1
Abbreviations
- (DTIC)
Dacarbazine
- (CAPE)
Caffeic Acid Phenylethyl Ester
- (MEM)
Modified Eagle Medium Alpha
- (FBS)
Fetal Bovine Serum
- (PBS)
Phosphate Buffered Saline
- (DMEM)
Dulbecco’s Modified Eagle Medium
- (MEM)
Minimum Essential Medium
- (ICG)
Intracellular GSH
- (ROS)
Reactive Oxygen Species
- (MTT)
(3-(4, 5-Dimethylthiazolyl-2)-2, 5-diphenyl Tetrazolium Bromide)
- (DETAPAC)
Diethylenetriaminepentaacetic Acid
- (DTNB)
5,5′-Dithiobis-(2-nitrobenzoic acid)
- (AA)
Ascorbic Acid
- (4-HA)
4-Hydroxyanisole
- (TMRM)
Tetramethyl Rhodamine Methyl Ester
- (EDA)
Ethylenediamine
- (SSA)
Sulphosalicylic Acid
- (shRNA)
short hairpin RNA
- (PMSF)
Phenylmethylsulphonyl Fluoride
- (DC)
Dicoumarol
- (BH)
1-Bromoheptane
- (CS)
Cyclosporin-A
- (TF)
Trifluperazine
- (PTP)
Mitochondrial Permeability Transition Pore
- (HRP)
Horseradish Peroxidase
- (QSTR)
Quantitative Structure Activity Relationship
Footnotes
Conflict of interest: The authors state no conflict of interest.
Publisher's Disclaimer: This is a PDF file of an unedited manuscript that has been accepted for publication. As a service to our customers we are providing this early version of the manuscript. The manuscript will undergo copyediting, typesetting, and review of the resulting proof before it is published in its final citable form. Please note that during the production process errors may be discovered which could affect the content, and all legal disclaimers that apply to the journal pertain.
References
- [1].Smit NP, Peters K, Menko W, Westerhof W, Pavel S, Riley PA. Cytotoxicity of a selected series of substituted phenols towards cultured melanoma cells. Melanoma Res. 1992;2:295–304. doi: 10.1097/00008390-199212000-00002. [DOI] [PubMed] [Google Scholar]
- [2].Saleem M, Maddodi N, Zaid M. Abu, Khan N, bin Hafeez B, Asim M, et al. Lupeol inhibits growth of highly aggressive human metastatic melanoma cells in vitro and in vivo by inducing apoptosis. Clin.Cancer Res. 2008;14:2119–2127. doi: 10.1158/1078-0432.CCR-07-4413. [DOI] [PubMed] [Google Scholar]
- [3].Borden EC. Melanoma 2007: current state and preview of the future. Semin.Oncol. 2007;34:449–451. doi: 10.1053/j.seminoncol.2007.09.001. [DOI] [PubMed] [Google Scholar]
- [4].Zheng ZS, Xue GZ, Grunberger D, Prystowsky JH. Caffeic acid phenethyl ester inhibits proliferation of human keratinocytes and interferes with the EGF regulation of ornithine decarboxylase. Oncol.Res. 1995;7:445–452. [PubMed] [Google Scholar]
- [5].Chen JH, Ho C. Antioxidant Activities of Caffeic Acid and Its Related Hydroxycinnamic Acid Compounds. J. Agric. Food Chem. 1997;45:2374. [Google Scholar]
- [6].Nagaoka T, Banskota AH, Tezuka Y, Saiki I, Kadota S. Selective antiproliferative activity of caffeic acid phenethyl ester analogues on highly liver-metastatic murine colon 26-L5 carcinoma cell line. Bioorg. Med. Chem. 2002;10:3351–3359. doi: 10.1016/s0968-0896(02)00138-4. [DOI] [PubMed] [Google Scholar]
- [7].Guarini L, Su ZZ, Zucker S, Lin J, Grunberger D, Fisher PB. Growth inhibition and modulation of antigenic phenotype in human melanoma and glioblastoma multiforme cells by caffeic acid phenethyl ester (CAPE) Cell Mol.Biol. 1992;38:513–527. [PubMed] [Google Scholar]
- [8].Grunberger D, Banerjee R, Eisinger K, Oltz EM, Efros L, Caldwell M, et al. Preferential cytotoxicity on tumor cells by caffeic acid phenethyl ester isolated from propolis. Experientia. 1988;44:230–232. doi: 10.1007/BF01941717. [DOI] [PubMed] [Google Scholar]
- [9].Lee YJ, Liao PH, Chen WK, Yang CY. Preferential cytotoxicity of caffeic acid phenethyl ester analogues on oral cancer cells. Cancer Lett. 2000;153:51–56. doi: 10.1016/s0304-3835(00)00389-x. [DOI] [PubMed] [Google Scholar]
- [10].Chen JH, Shao Y, Huang MT, Chin CK, Ho CT. Inhibitory effect of caffeic acid phenethyl ester on human leukemia HL-60 cells. Cancer Lett. 1996;108:211–214. doi: 10.1016/s0304-3835(96)04425-4. [DOI] [PubMed] [Google Scholar]
- [11].Su ZZ, Grunberger D, Fisher PB. Suppression of adenovirus type 5 E1A-mediated transformation and expression of the transformed phenotype by caffeic acid phenethyl ester (CAPE) Mol.Carcinog. 1991;4:231–242. doi: 10.1002/mc.2940040310. [DOI] [PubMed] [Google Scholar]
- [12].Kudugunti SK, Vad NM, Ekogbo E, Moridani MY. Efficacy of Caffeic Acid Phenethyl Ester (CAPE) in skin B16-F0 melanoma tumor bearing C57BL/6 mice. Invest New Drugs. 2009 Oct 21; doi: 10.1007/s10637-009-9334-5. [Epub ahead of print] [DOI] [PubMed] [Google Scholar]
- [13].Chen YM, Chavin W. Tyrosinase activity in a highly pigmented human melanoma and in negro skin. Proc.Soc.Exp.Biol.Med. 1974;145:695–698. doi: 10.3181/00379727-145-37877. [DOI] [PubMed] [Google Scholar]
- [14].Moridani MY. Biochemical basis of 4-hydroxyanisole induced cell toxicity towards B16-F0 melanoma cells. Cancer Lett. 2006;243:235–245. doi: 10.1016/j.canlet.2005.11.046. [DOI] [PubMed] [Google Scholar]
- [15].Thörneby-Andersson K, Sterner O, Hansson C. Tyrosinase-mediated formation of a reactive quinone from the depigmenting agents, 4-tert-butylphenol and 4-tert-butylcatechol. Pigment Cell Res. 2000;13:33–38. doi: 10.1034/j.1600-0749.2000.130107.x. [DOI] [PubMed] [Google Scholar]
- [16].Vad NM, Yount G, Moore D, Weidanz J, Moridani MY. Biochemical mechanism of acetaminophen (APAP) induced toxicity in melanoma cell lines. J.Pharm.Sci. 2009;98:1409–1425. doi: 10.1002/jps.21505. [DOI] [PMC free article] [PubMed] [Google Scholar]
- [17].Doherty MD, Cohen GM, Gant TW, Naish S, Riley PA. Metabolism of 1-naphthol by tyrosinase. Biochem. Pharmacol. 1985;34:3167–3172. doi: 10.1016/0006-2952(85)90164-9. [DOI] [PubMed] [Google Scholar]
- [18].Moridani MY, Cheon SS, Khan S, O’Brien PJ. Metabolic activation of 4-hydroxyanisole by isolated rat hepatocytes. Drug Metab. Dispos. 2002;30:1063–1069. doi: 10.1124/dmd.30.10.1063. [DOI] [PubMed] [Google Scholar]
- [19].Ellman GL. Tissue sulfhydryl groups. Arch.Biochem.Biophys. 1959;82:70–77. doi: 10.1016/0003-9861(59)90090-6. [DOI] [PubMed] [Google Scholar]
- [20].Moridani MY, Moore M, Bartsch RA, Yang Y, Heibati-Sadati S. Structural toxicity relationship of 4-alkoxyphenols’ cytotoxicity towards murine B16-F0 melanoma cell line. J.Pharm.Pharm.Sci. 2005;8:348–360. [PubMed] [Google Scholar]
- [21].Dallner G. Isolation of microsomal subfractions by use of density gradients. Methods Enzymol. 1978;52:71–82. doi: 10.1016/s0076-6879(78)52007-7. [DOI] [PubMed] [Google Scholar]
- [22].Krikun G, Cederbaum AI. Increased microsomal oxidation of alcohols after pyrazole treatment and its similarities to the induction by ethanol consumption. Biochim.Biophys.Acta. 1984;801:131–137. doi: 10.1016/0304-4165(84)90221-6. [DOI] [PubMed] [Google Scholar]
- [23].Moridani MY, Siraki A, O’Brien PJ. Quantitative structure toxicity relationships for phenols in isolated rat hepatocytes. Chem.Biol.Interact. 2003;145:213–223. doi: 10.1016/s0009-2797(02)00258-2. [DOI] [PubMed] [Google Scholar]
- [24].Gergel D, Cederbaum AI. Interaction of nitric oxide with 2-thio-5-nitrobenzoic acid: implications for the determination of free sulfhydryl groups by Ellman’s reagent. Arch.Biochem.Biophys. 1997;347:282–288. doi: 10.1006/abbi.1997.0352. [DOI] [PubMed] [Google Scholar]
- [25].Moldeus P, Hogberg J, Orrenius S. Isolation and use of liver cells. Methods in Enzymol. 1978;52:60–71. doi: 10.1016/s0076-6879(78)52006-5. [DOI] [PubMed] [Google Scholar]
- [26].Wu X, Zeng H, Zhang X, Zhao Y, Sha H, Ge X, et al. Phosphatase of regenerating liver-3 promotes motility and metastasis of mouse melanoma cells. Am. J. Pathol. 2004;164:2039–2054. doi: 10.1016/S0002-9440(10)63763-7. [DOI] [PMC free article] [PubMed] [Google Scholar]
- [27].Siraki AG, Chan TS, O’Brien PJ. Application of quantitative structure-toxicity relationships for the comparison of the cytotoxicity of 14 p-benzoquinone congeners in primary cultured rat hepatocytes versus PC12 cells. Toxicol.Sci. 2004;81:148–159. doi: 10.1093/toxsci/kfh182. [DOI] [PubMed] [Google Scholar]
- [28].Preusch PC, Siegel D, Gibson NW, Ross D. A note on the inhibition of DT-diaphorase by dicoumarol. Free Radic.Biol.Med. 1991;11:77–80. doi: 10.1016/0891-5849(91)90191-5. [DOI] [PubMed] [Google Scholar]
- [29].Khan S, O’Brien PJ. 1-Bromoalkanes as New Potent Nontoxic Glutathione Depletors in Isolated Rat Hepatocytes. Biochem.Biophys.Res.Commun. 1991;179:436–441. doi: 10.1016/0006-291x(91)91389-t. [DOI] [PubMed] [Google Scholar]
- [30].Broekemeier KM, Pfeiffer DR. Cyclosporin A-sensitive and insensitive mechanisms produce the permeability transition in mitochondria. Biochem.Biophys.Res.Commun. 1989;163:561–566. doi: 10.1016/0006-291x(89)92174-8. [DOI] [PubMed] [Google Scholar]
- [31].Wong A, Cavelier L, Collins-Schramm HE, Seldin MF, McGrogan M, Savontaus ML, Cortopassi GA. Differentiation-specific effects of LHON mutations introduced into neuronal NT2 cells. Hum. Mol. Genet. 2002;11:443–438. doi: 10.1093/hmg/11.4.431. [DOI] [PubMed] [Google Scholar]
- [32].Johansen IE. Intron insertion facilitates amplification of cloned virus cDNA in Escherichia coli while biological activity is reestablished after transcription in vivo. Proc. Natl. Acad. Sci.U.S.A. 1996;93:12400–12405. doi: 10.1073/pnas.93.22.12400. [DOI] [PMC free article] [PubMed] [Google Scholar]
- [33].Vad NM, Kudugunti SK, Graber D, Bailey N, Srivenugopal K, Moridani MY. Efficacy of acetaminophen in skin B16-F0 melanoma tumor-bearing C57BL/6 mice. Int. J. Oncol. 2009;35:193–204. doi: 10.3892/ijo_00000329. [DOI] [PubMed] [Google Scholar]
- [34].Shang XJ, Yao G, Ge JP, Sun Y, Teng WH, Huang YF. Procyanidin Induces Apoptosis and Necrosis of Prostate Cancer Cell Line PC-3 in a Mitochondrion-Dependent Manner. J Androl. 2009;30:122–126. doi: 10.2164/jandrol.108.005629. [DOI] [PubMed] [Google Scholar]
- [35].Vad NM, Kandala PK, Srivastava SK, Moridani MY. Structure-toxicity relationship of phenolic analogs as anti-melanoma agents: An enzyme directed prodrug approach. Chem Biol Interact. 2010;183:462–471. doi: 10.1016/j.cbi.2009.11.020. [DOI] [PMC free article] [PubMed] [Google Scholar]
- [36].Vad NM, Yount G, Moridani MY. Biochemical mechanism of acetylsalicylic acid (Aspirin) selective toxicity toward melanoma cell lines. Melanoma Res. 2008;18:386–399. doi: 10.1097/CMR.0b013e3283107df7. [DOI] [PubMed] [Google Scholar]
- [37].Passi S, Nazzaro-Porro M. Molecular basis of substrate and inhibitory specificity of tyrosinase: phenolic compounds. Br.J.Dermatol. 1981;104:659–665. doi: 10.1111/j.1365-2133.1981.tb00752.x. [DOI] [PubMed] [Google Scholar]
- [38].Nakamura M, Yamazaki I, Kotani T, Ohtaki S. Thyroid peroxidase selects the mechanism of either 1- or 2-electron oxidation of phenols, depending on their substituents. J.Biol.Chem. 1985;260:13546–13552. [PubMed] [Google Scholar]
- [39].Hirosaki K, Yamashita T, Wada I, Jin HY, Jimbow K. Tyrosinase and tyrosinase-related protein 1 require Rab7 for their intracellular transport. J.Invest.Dermatol. 2002;119:475–480. doi: 10.1046/j.1523-1747.2002.01832.x. [DOI] [PubMed] [Google Scholar]
- [40].Kawai S, Yoshinari M, Matsumoto J, Kirinoki M, Aikawa M, Minami M, et al. Plasmodium coatneyi-infected erythrocytes bind to C32 amelanotic melanoma cells under static and flow conditions. J.Vet.Med.Sci. 2003;65:375–380. doi: 10.1292/jvms.65.375. [DOI] [PubMed] [Google Scholar]
- [41].Riley PA, Cooksey CJ, Johnson CI, Land EJ, Latter AM, Ramsden CA. Melanogenesis-targeted anti-melanoma pro-drug development: effect of side-chain variations on the cytotoxicity of tyrosinase-generated ortho-quinones in a model screening system. Eur.J.Cancer. 1997;33:135–143. doi: 10.1016/s0959-8049(96)00340-1. [DOI] [PubMed] [Google Scholar]
- [42].Kim YJ. Antimelanogenic and antioxidant properties of gallic acid. Biol.Pharm.Bull. 2007;30:1052–1055. doi: 10.1248/bpb.30.1052. [DOI] [PubMed] [Google Scholar]
- [43].Liu L, Hudgins WR, Shack S, Yin MQ, Samid D. Cinnamic acid: a natural product with potential use in cancer intervention. Int.J.Cancer. 1995;62:345–350. doi: 10.1002/ijc.2910620319. [DOI] [PubMed] [Google Scholar]
- [44].Kuby SA. Function of NADH(NADPH)-Cytochrome c Reductase. In: Kuby SA, editor. A Study of Enzymes: Mechanism of enzyme action. CRC Press; USA: 1990. pp. 693–697. [Google Scholar]
- [45].Estrela JM, Ortega A, Obrador E. Glutathione in cancer biology and therapy. Crit.Rev.Clin.Lab.Sci. 2006;43:143–481. doi: 10.1080/10408360500523878. [DOI] [PubMed] [Google Scholar]
- [46].Ortega AL, Carretero J, Obrador E, Gambini J, Asensi M, Rodilla V, et al. Tumor cytotoxicity by endothelial cells. Impairment of the mitochondrial system for glutathione uptake in mouse B16 melanoma cells that survive after in vitro interaction with the hepatic sinusoidal endothelium. J.Biol.Chem. 2003;278:13888–13897. doi: 10.1074/jbc.M207140200. [DOI] [PubMed] [Google Scholar]
- [47].Kern DH, Shoemaker RH, Hildebrand-Zanki SU, Driscoll JS. Structure-activity relationships defining the cytotoxicity of catechol analogues against human malignant melanoma. Cancer Res. 1988;48:5178–5182. [PubMed] [Google Scholar]
- [48].Moridani MY, Scobie H, Jamshidzadeh A, Salehi P, O’Brien PJ. Caffeic acid, chlorogenic acid, and dihydrocaffeic acid metabolism: glutathione conjugate formation. Drug Metab.Dispos. 2001;29:1432–1439. [PubMed] [Google Scholar]