Abstract
Ultraviolet photodissociation (UVPD) at 193 nm is compared to collision induced dissociation (CID) for sequencing and determination of modifications of multi-deprotonated 6 – 20-mer oligodeoxynucleotides. UVPD at 193 nm causes efficient charge reduction of the deprotonated oligodeoxynucleotides via electron detachment, in addition to extensive backbone cleavages to yield sequence ions of relatively low abundance, including w, x, y, z, a, a-B, b, c, and d ions. Although internal ions populate UVPD spectra, base loss ions from the precursor are absent. Subsequent CID of the charge-reduced oligodeoxynucleotides formed upon electron detachment, in a net process called electron photodetachment dissociation (EPD), results in abundant sequence ions in terms of w, z, a, a-B and d products, with a marked decrease in the abundance of precursor base loss ions and internal fragments. Complete sequencing was possible for virtually all oligodeoxynucleotides studied. EPD of three modified oligodeoxynucleotides, a methylated oligodeoxynucleotide, a phosphorothioate-modified oligodeoxynucleotide, and an ethylated-oligodeoxynucleotide, resulted in specific and extensive backbone cleavages, specifically, w, z, a, a-B and d products, which allowed the modification site(s) to be pinpointed to a more specific location than by conventional CID.
Introduction
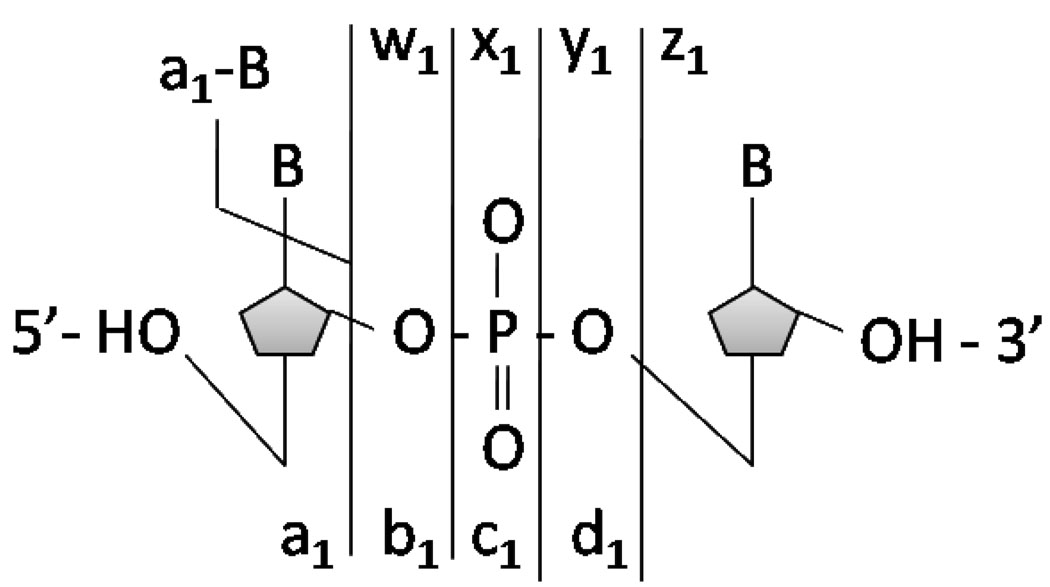
Sequencing biopolymers such as nucleic acids and proteins and determining their structural modifications remains one of the most important applications of tandem mass spectrometry. Collision induced dissociation (CID) is by far the most widely used activation method for nucleic acids.1 During CID, the fragmentation of deprotonated oligodeoxynucleotides is initiated by loss of a neutral or charged base, followed by subsequent backbone fragmentation leading to complementary w and a - B ions (Scheme 1).2 Infrared multiphoton dissociation (IRMPD) has also been successful for activation of nucleic acids due to the high absorptivity of the phosphodiester backbone at 10.6 um and results in fragmentation patterns similar to those of CID.3 The high abundances of non-informative base loss and internal fragments that complicate spectra as well as the limited diversity of products are oft-cited disadvantages of CID and IRMPD.
Scheme 1.
Oligodeoxynucleotide fragmentation nomenclature.
Interest in alternative ultraviolet photon-based and electron-based ion dissociation techniques for tandem mass spectrometry of oligodeoxynucleotides continues to grow, and include ultraviolet photodissociation (UVPD) at 193 nm,4 electron photodetachment dissociation at 260 nm (EPD),5–6 electron detachment dissociation (EDD),7–13 electron capture dissociation (ECD),14–15 and electron transfer dissociation (ETD).16 Pioneering work by McLafferty et al. used 193 nm photons to irradiate multiply charged dT30 ions, causing electron photodetachment in addition to formation of w and a ions (which have the same masses as d and z ions in the sequence dT30).4 More recently, Gabelica et al. explored the electron photodetachment of single strand oligodeoxynucleotide anions and duplexes at 250–285 nm.5–6 The minimal fragmentation of oligodeoxynucleotides observed upon laser irradiation at 260 nm was almost exclusively supplanted by electron photodetachment, rendering UVPD at 260 nm inefficient for sequencing oligodeoxynucleotides.5 CID of the charge reduced radical ions arising from electron photodetachment predominantly yielded w, d, a, and z ion series compared to the w and a-B ions observed upon CID.5
EDD is promoted by interaction of an oligonucleotide with >10 eV electrons, thus generating both radical and non-radical products. Hakansson et al has investigated EDD of deoxyoligonucleotides.7–13 Upon EDD, both w/d and radical a/z series of fragment ions were observed for oligodeoxynucleotide sequences for which those ions were not distinguishable, and one radical z ion was observed for the sequence dGCATGC.7 The limited fragmentation that was observed upon EDD of longer oligodeoxynucleotides was attributed to residual secondary structure that prevented product ions from separating.7,10 Recently, EDD has been performed on oligoribonucleotides by Taucher and Breuker, with EDD resulting in the formation of abundant noncomplementary even electron w and d ions.13 A mechanism was suggested whereby the radical z ions formed upon EDD undergo facile dissociation into even electron w ion.13
ECD and ETD entail activation of oligodeoxynucleotide cations, not anions, and lead to radical cation products via electron attachment. Subsequent dissociation follows different pathways that give rise to many types of product ions.14–16 For example, upon ECD, d radical cations, a/z ions, and c/x ions were observed.15 ETD of DNA cations generated very low abundance backbone fragment ions and instead predominantly caused charge reduction (i.e. electron attachment without dissociation).16 CID of the resulting charge-reduced species produced w, a, z, and d ions, with a marked decrease in the abundance of precursor base loss ions and internal fragments compared to CID.16 Although our previous work has shown efficient cation formation of DNA oligonucleotides, it should be noted that generation of positively charged oligodeoxynucleotides is generally perceived to be less efficient than the generation of the corresponding anions due to the acidic nature of the phosphate backbone under most experimental conditions, making ECD and ETD less popular options for characterization of DNA.14
With respect to characterization of DNA modifications, tandem mass spectrometry techniques offer a promising approach for the rapid and sensitive detection of modifications based on reconstitution of the original nucleic acid sequence from characteristic fragment ions.17 Sequencing by CID and IRMPD has been used to locate modified nucleobases,18–29 and modified deoxyribose and phosphate moieties in DNA,30–32 in addition to characterization of the extremely varied modifications of RNA.33–38 Even some 3D structural aspects of DNA and RNA can be obtained by combining the use of chemical probes with tandem mass spectrometry.39–43 Furthermore, the factors governing fragmentation mechanisms of modified oligonucleotides44–48 by CID have been explored.
In the present study, we explore the fragmentation patterns of negatively charged oligodeoxynucleotides, both single strands and modified single strands, using UVPD and EPD at 193 nm. In all cases, UVPD at 193 nm causes efficient electron detachment from the multiply charged oligodeoxynucleotide anions, producing charge reduced oligodeoxynucleotide anions in addition to an impressive variety of low abundance backbone ions. Subsequent CID of the charge-reduced oligodeoxynucleotide radical ions results in backbone fragmentation which is more extensive than that produced by CID of the corresponding even-electron species but less complicated than that promoted by UVPD alone. EPD of three modified oligodeoxynucleotides resulted in specific and extensive backbone cleavages which allowed the modification site(s) to be pinpointed more readily than by conventional CID.
Experimental
Chemicals
The following oligodeoxynucleotides were obtained from Integrated DNA Technologies (Coralville, IA) on the 1.0 umole scale and used without further purification: 5’- AAAAAA-3’, 5’- CCCCCC-3’, 5’- GGGGGG-3’, 5’- TTTTTT-3’, 5’- TGGCCA-3’, 5’- ATGACTCG-3’, 5’- GTATGACTCGCA-3’, 5’- TCGTATGACTCGCAAG-3’, 5’- CATCGTATGACTCGCAAGTG-3’. In addition, the following sequences were obtained with modifications: 5’ – TGCATGCAAG – 3’ (in which the bold cytosine is methylated at the carbon 5 position) and 5’ - TAGCTAGTCsGAC – 3’ (which contains one phosphorothioate bond in which a sulfur atom is substituted for a non-bridging oxygen in the phosphate backbone at the “s” position) (Table 1). Oligodeoxynucleotide single strand concentrations were determined spectrophotometrically by Beer’s Law using the extinction coefficients provided by the manufacturer. For ESI-MS analysis, the solution was diluted to 10 µM of oligodeoxynucleotide in 20 mM ammonium acetate solution. For the N-ethyl-N-nitrosourea (ENU) reaction, 10 µL of 5.0 M ENU in methanol was added to 40 µL of a 50 mM solution of 5’- GTATGACTCGCA-3’ in 100 mM ammonium acetate. The incubate was heated to 57 °C for one hour, diluted to a DNA concentration of 10 µM and immediately analyzed by ESI-MS.
Table 1.
Summary of the oligodeoxynucleotide sequences used in this study.
| Name | Sequence | Molecular Weight (Da) |
|---|---|---|
| dA6 | 5’- AAAAAA-3’ | 1817.3 |
| dC6 | 5’- CCCCCC-3’ | 1673.1 |
| dG6 | 5’- GGGGGG-3’ | 1913.3 |
| dT6 | 5’- TTTTTT-3’ | 1763.2 |
| ss6 | 5’- TGGCCA-3’ | 1792.2 |
| ss8 | 5’- ATGACTCG-3’ | 2409.6 |
| ss12 | 5’- GTATGACTCGCA-3’ | 3645.4 |
| ss16 | 5’- TCGTATGACTCGCAAG-3’ | 4881.2 |
| ss20 | 5’- CATCGTATGACTCGCAAGTG-3’ | 6117.0 |
| Mss10 | 5’- TGCATGmeCAAG-3’ | 3066.1 |
| PSss12 | 5’- TAGCTAGTCsGAC-3’ | 3661.5 |
Mass Spectrometry
Oligodeoxynucleotide samples were directly electrosprayed into a Finnigan LTQ mass spectrometer (Thermo Electron Corp., San Jose, CA). A Harvard syringe pump (Holliston, MA) at a flow rate of 3 µL/min was used. The ESI source was operated in the negative ion mode with an electrospray voltage of 3.5 kV and a heated capillary temperature of 90 °C. To assist in desolvation, nitrogen sheath and auxiliary gas were applied at 40 and 20 arbitrary units, respectively. Spectra were acquired by summing 20 scans. For the collisionally induced dissociation (CID) experiments, collisional activation voltages were applied at a level sufficient to reduce the isolated precursor ion to ~10–20% of its original abundance. The default activation time of 30 ms was used in all CID experiments with a qz value of 0.25.
The LTQ mass spectrometer was modified for UVPD in a manner described previously.49 UVPD was performed using a Coherent Excistar XS 500 ArF excimer laser (Munich, Germany), with a repetition rate of 500 Hz, and a pulse width of 5 ns. A laser gas mixture containing inert gases and a small amount of fluorine (<1% composition in mixture) was used as the active laser medium inside the laser tube. As the number of laser pulses increased, the concentration of the premix laser gas in the laser tube decreased, resulting in a decrease in laser energy per pulse. In order to maintain the same pulse energy throughout all experiments (except for the energy variable experiments), the high voltage electrical discharge was automatically varied so that the energy per pulse was 6.0 mJ. Most UVPD experiments were performed with one laser pulse, during which the total activation period was the lowest default value of the LTQ mass spectrometer, 0.03 ms. Multiple laser pulse experiments were also performed, in which the laser was pulsed every 2.0 ms at the maximum repetition rate of the laser (500 Hz). The back flange of the vacuum manifold of the instrument was modified with a CF viewport flange with a VUV grade CaF2 window with an anti-reflective 193 nm coating to allow the transmission of 193-nm radiation. The unfocused laser beam was aligned on axis with the linear ion trap such that the beam passed through a 2-mm aperture of the exit lens to irradiate the ion cloud. Upon exiting the laser aperture, the pulse per energy was ~ 6.0 mJ; the energy per pulse near the back flange of the instrument was ~ 5.0 mJ per pulse prior to the 2-mm aperture of the exit lens. The q-value of the precursor was set at 0.1 to reduce the low-mass cutoff value. The pressure in the analyzer region was nominally 9.0 × 10⁻⁶ Torr, and no changes to the He bath gas pressure were made.
For EPD experiments, ultraviolet photodissociation was performed for 1 pulse (LTQ default activation period of 0.03 msec), and a collisional activation voltage was subsequently applied at a level required to reduce the isolated precursor ion to ~10 – 20% of its original abundance. The default activation time of 30 ms was used in all EPD experiments, and the qz value was set to 0.25. The isolation width was set to 5 m/z for all MS/MS steps.
Results and Discussion
For the present study, the fragmentation patterns of a series of oligodeoxynucleotides obtained by UVPD and EPD are compared to those obtained by CID and IRMPD. The types and relative abundances of diagnostic sequence ions are evaluated, and the benefits of EPD for characterization of modified oligodeoxynucleotides are demonstrated.
UVPD, EPD, CID, IRMPD product ions
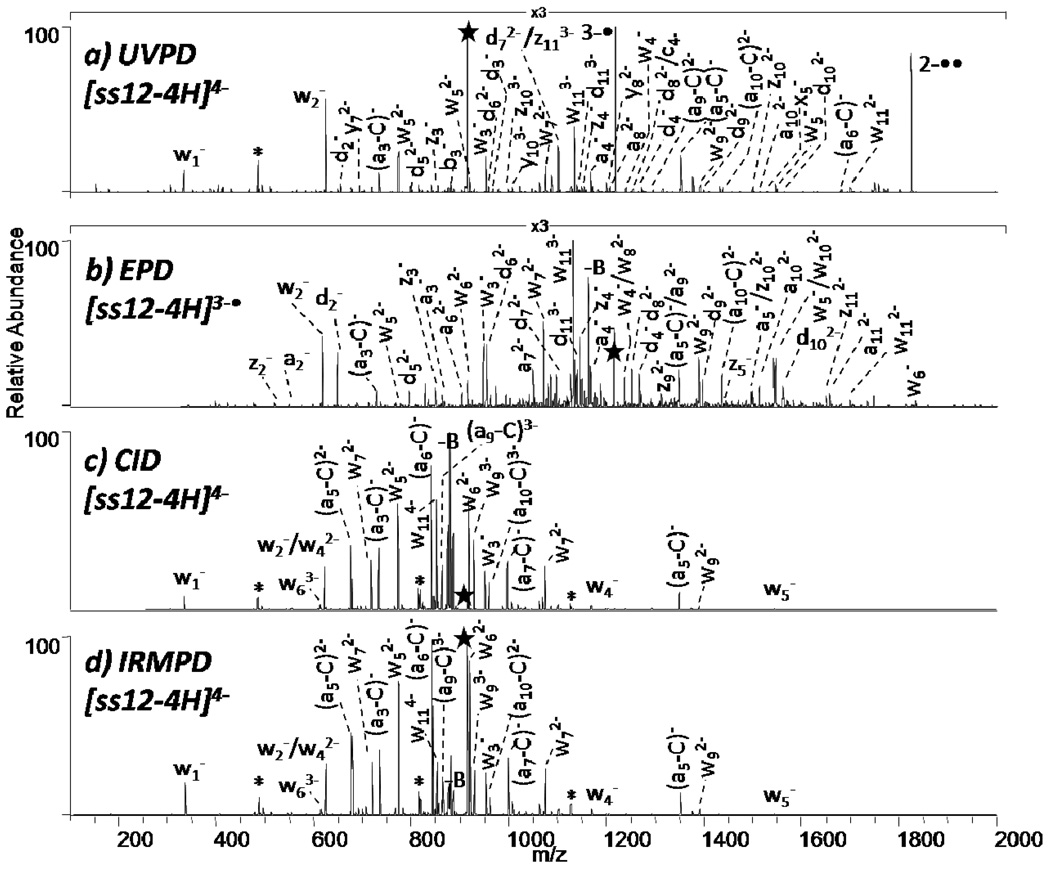
For the single strand d(GTATGACTCGCA), the UVPD spectrum of the 4- charge state, the EPD spectrum of the odd electron species (3-•) produced by electron photodetachment from the 4- charge state, and the CID and IRMPD spectra of the 4- charge state are displayed in Figure 1. UVPD of [GTATGACTCGCA-4H]4- results in an extensive series of product ions arising from various backbone cleavages as well as the abundant charge-reduced product assigned as 3-• and 2-••, as shown in Figure 1a. Due to the complexity of the spectra, not all product ions are labeled in the UVPD (Figure 1a) and EPD (Figure 1b) spectra. Although of low abundance, a complete series of w ions and a near complete series of d ions is observed. Moreover, a few a, a-B, b, c, x, y, and z ions are observed. Internal ions are numerous but base loss ions are low in abundance. This array of fragmentation pathways is generally characteristic of the UVPD mass spectra obtained for all other deprotonated oligodeoxynucleotides. Electron photodetachment upon UVPD has been observed previously for oligodeoxynucleotide anions at 260 nm,5–6 and the mass spectrum in Figure 1a indicates a similar process is operative upon UVPD at 193 nm, yielding abundant charge reduced products.
Figure 1.
MS/MS spectra of ss12 by (a) UVPD of 4- (one UV pulse, 5mJ), (b) EPD of 3-• (one UV pulse, 5mJ; then 28% normalized collision energy, 30 ms), and (c) CID 4- (20% normalized collision energy, 30 ms), and (d) IRMPD 4- (5.0 ms irradiation, 10 W). Precursor ions are noted with a star.
The sequence ions produced by UVPD in Figure 1a are numerous, albeit at rather low abundance. To circumvent this shortcoming and to promote more abundant fragmentation, the abundant charge-reduced ion produced upon UVPD (e.g., [(GTATGACTCGCA-3H)3-• in Figure 1a) was subsequently subjected to collisional activation (shown in Figure 1b), and this two stage activation process was termed by Gabelica and coworkers as electron photodetachment dissociation (EPD, i.e. UVPD → CID).5–6 A near complete series of w and d ions (except for the 5’ terminal w1 and d1 ions due to the low mass cut-off associated with CID) are formed as well as numerous a, a-B and z ions.
For comparison, the CID spectrum of (GTATGACTCGCA-4H)4- is shown in Figure 1c. CID results in production of several w ions, a - B ions, and internal ions, the latter of which often complicate spectral interpretation. Internal ions, the most abundant of which are labeled with an asterisk, are the result of sequential fragmentation leading to products that contain neither the 5’- nor 3’- terminus. Simple base loss results in the most abundant product ions in the CID mass spectrum (Figure 1c).
IRMPD is another photon-based dissociation technique that is an alternative to CID.50 The non-resonant process of ion activation by IR absorption results in rapid conversion of the uninformative base loss ions, ones that often dominate CID mass spectra acquired in quadrupole ion traps, into a - B and w sequence ions without the need for sequential stages of ion activation.3 The IRMPD spectrum of (GTATGACTCGCA-4H)4- is shown in Figure 1d. IRMPD results in production of several w ions, a - B ions, and internal ions, similar to CID, but the unwanted base loss ions are minimized by secondary dissociation into a-B and w ions. The w, z, and d series are notably absent from the CID and IRMPD spectra.
Variation of laser pulse energy for UVPD
Energy-variable UVPD experiments were also conducted to reveal the impact of photon flux on the secondary dissociation of the charge reduced product ions. Gabelica et al measured the electron detachment yield of dG63- at 260 nm and found that the first electron photodetachment is a one-photon process, while the second electron photodetachment was a multi-photon process.5–6
To establish the one-photon or multi-photon character of electron photodetachment when using 193 nm photons, [TGGCCA]3- was exposed to one laser pulse while the laser energy per pulse was increased. Supplemental Figure 1 shows the resulting energy-variable UVPD results for the peak areas of the singly (◊) and doubly (□) charge-reduced product ions, in addition to a w52- ion (Δ). The increase in abundance of the singly charged-reduced product ion follows a linear trend (R2 > 0.99) with respect to laser pulse energy, showing that the first electron detachment is a one-photon process. In contrast, the abundance of the doubly charge-reduced and w52- product ions exhibit a nonlinear trend, indicating that the reaction is a multi-photon process. A quadratic equation fit to the data for the doubly charge-reduced and w52- product ions yields a value of R2 greater than 0.99. The combined pulse-variable and energy-variable data confirm that the dissociation of DNA oligodeoxynucleotides at 193 nm is dependent on total photon flux.
Base dependence on electron detachment efficiency
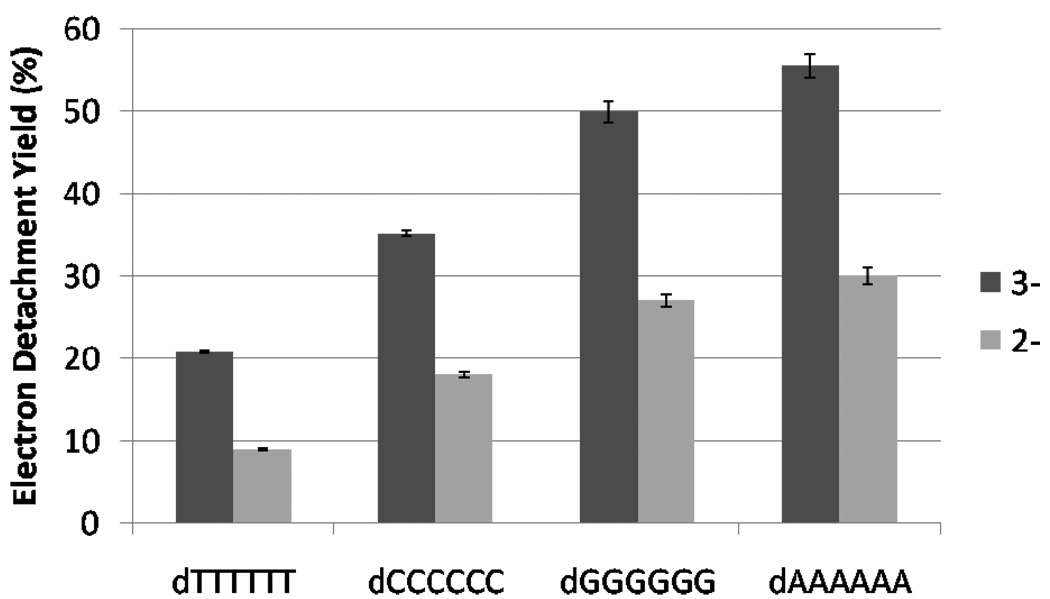
Oligodeoxynucleotides have been shown previously to exhibit sequence-dependent dissociation patterns attributed to the nature of the nucleobases by the ultraviolet photon-based and electron-based activation techniques, including EPD at 260 nm5–6 and EDD.7–12 In order to evaluate the potential impact of the nucleobases on the fragmentation pathways of oligodeoxynucleotides upon irradiation at 193 nm, UVPD experiments were undertaken for four six-mers, dC6, dA6, dG6, and dT6, in the 2- and 3- charge states. After exposure to a single UV pulse, each 6-mer undergoes electron photodetachment as well as fragmentation into primarily w or d sequence ions (UVPD spectra not shown). The electron detachment efficiencies for each 6-mer are summarized in Figure 2.
Figure 2.
Electron detachment yield for the 2- and 3- charge states of dA6, dG6, dC6, and dT6 upon one UV laser pulse (5 mJ). The fraction of charge-reduced species was determined based on the abundances of all radical products and the charge- reduced precursor, with the assumption that all radical product ions are derived from decomposition of the charge reduced precursor. The standard deviation was calculated from three experiments.
The percentage of charge-reduced species was determined by summing the abundances of all charge reduced ions and radical sequence ions and dividing by the summed abundances of all ions. Figure 2 shows that the electron detachment efficiency upon one laser pulse at 193 nm follows the trend dA6 > dG6 > dC6 > dT6. The propensity for electron detachment was also monitored as a function of the number of laser pulses (1 to 15) (data not shown). Based on the much slower decay of the precursor ion abundance, the rate of dissociation of the thymine strand is significantly slower than for the other strands. The precursor ion is completely dissociated after 6 pulses for [dA6]3-, [dG6]3-, and [dC6]3-, whereas 13 pulses are necessary to completely dissociate [dT6]3-. In addition, secondary dissociation of the charge reduced species for [dT6]3- also occur much slower compared to the other 6-mer strands.
The trend in electron detachment observed by EPD at 193 nm (dA6 > dG6 > dC6 > dT6) is different from EPD at 260 nm (dG6 > dA6 > dC6 > dT6), 6 different from EDD (dG6 > dT6 > dC6 > dA6)12 and also different from electron thermal autodetachment (dT7 > dC7 > dA7).51 Guanine has the lowest ionization potential and thus would be expected to undergo the most facile electron detachment. For individual nucleobases, the order of ionization potentials is G < A < C < T.52 Molar extinction coefficients, which are directly related to the absorptivity of the molecule, are not available for 193 nm, but at 260 nm follow the trend A > G > C > T. The base dependence of electron detachment at 193 nm may depend on both the ionization potentials of the individual bases and their photoabsorption efficiencies.
Influence of oligodeoxynucleotide length and charge state on CID, UVPD, and EPD
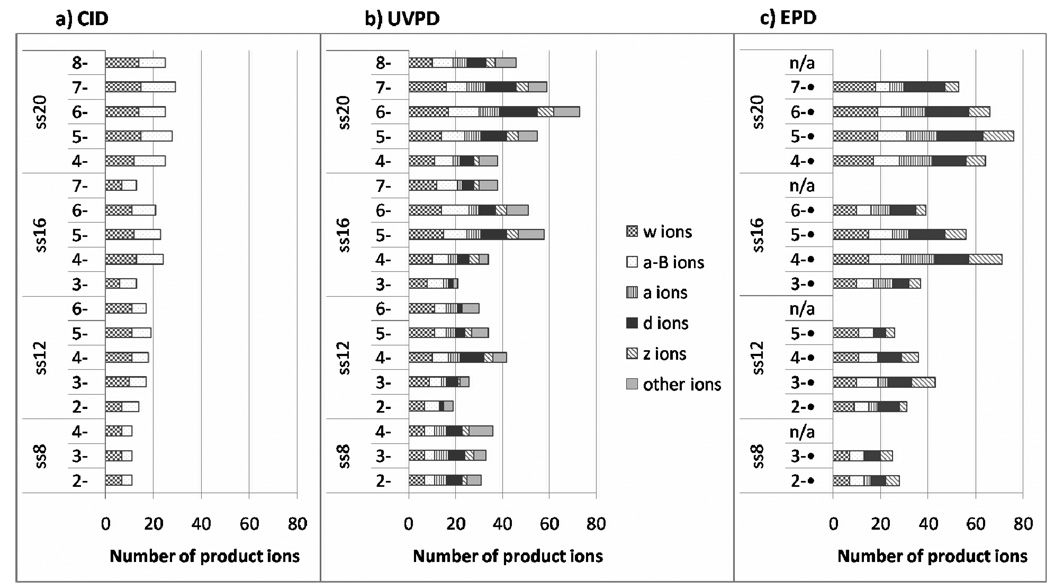
UVPD, EPD, and CID were undertaken for several oligodeoxynucleotides of varying length and sequence in order to determine the sequence coverage obtained as a function of activation method and the charge state of the precursor. A comparison of the CID, UVPD, and EPD results for the series of oligodeoxynucleotides is summarized in Figure 3. The total numbers of diagnostic sequence ions (a - B and w for CID; a, a - B, d, w, z, and other ions (including b, c, x, y) for UVPD; a, a - B, d, w and z for EPD) are displayed in bar graph form for all observed charge states for each oligodeoxynucleotide. As the oligodeoxynucleotide increases in length and the number of possible backbone cleavage site increases, the overall number of product ions increases, as expected. In most cases, the number of product ions formed upon CID does not vary significantly with charge state. In contrast, the total number of ions produced by both UVPD and EPD appear to be much more dependent on charge state, with the intermediate charge states generally leading to the greatest array of product ions for each DNA strand. The total number of product ions from EPD are generally comparable or greater than that from UVPD, even though fewer different types of ions are produced (i.e. no b, c, x or y ions upon EPD).
Figure 3.
Number of diagnostic sequence ions [a-B and w for CID; a, a-B, d, w, z, and other ions (including b, c, x, y) for UVPD; a, a-B, d, w and z for EPD] are displayed in bar graph form for each observed charge state for ss8, ss12, ss16, and ss20.
A detailed comparison of the distributions of product ions generated upon CID, UVPD, and EPD as a function of charge state is shown in Supplementary Figure 2 for ss12. The abundances of each type of sequence ion (categorized as w; a - B; base loss from the intact single strand (-B); d; a; z; collective other ions including b, c, x, and y; and charge-reduced ions) were tallied and normalized to 100% for each precursor charge state. Figure 3 and Supplemental Figure 2 illustrate the striking differences in the number and distributions of product ions arising from each of the activation methods, thus affording significant analytical flexibility depending on the targeted objective, as demonstrated in the next section for characterization of modified oligodeoxynucleotides.
EPD for studying modified oligodeoxynucleotides
As described above, EPD results in a more diverse array of product ions than CID and greater abundances of diagnostic sequence ions than UVPD, and thus the potential of EPD for characterizing modified nucleic acids was explored. Elucidation of modified nucleic acids by MS/MS methods generally poses a greater challenge because the ability to pinpoint the specific site(s) of modification depends on generating a comprehensive array of site-specific fragment ions. In particular, EPD was applied for the characterization of a methylated oligodeoxynucleotide, a phosphorothioate-modified oligodeoxynucleotide, and an ethylated-oligodeoxynucleotide.
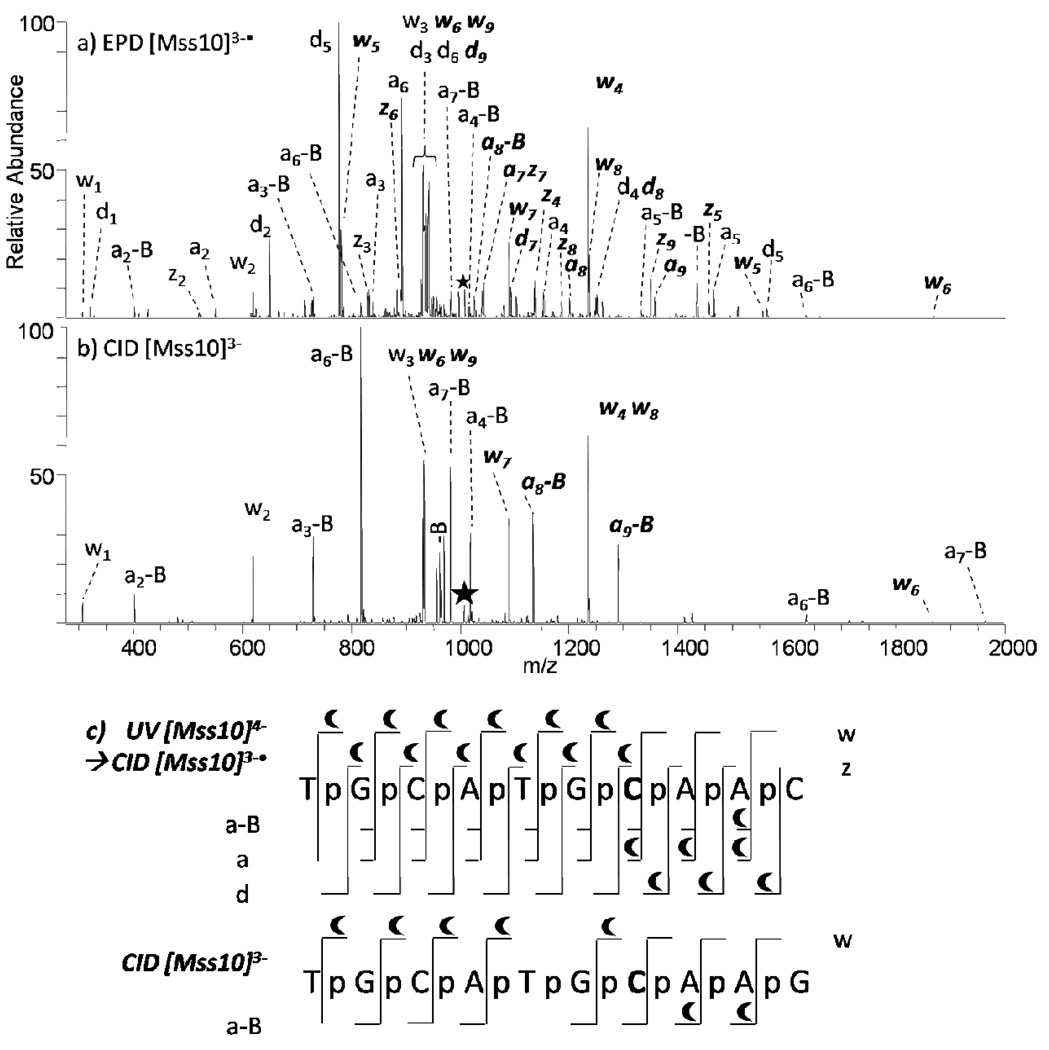
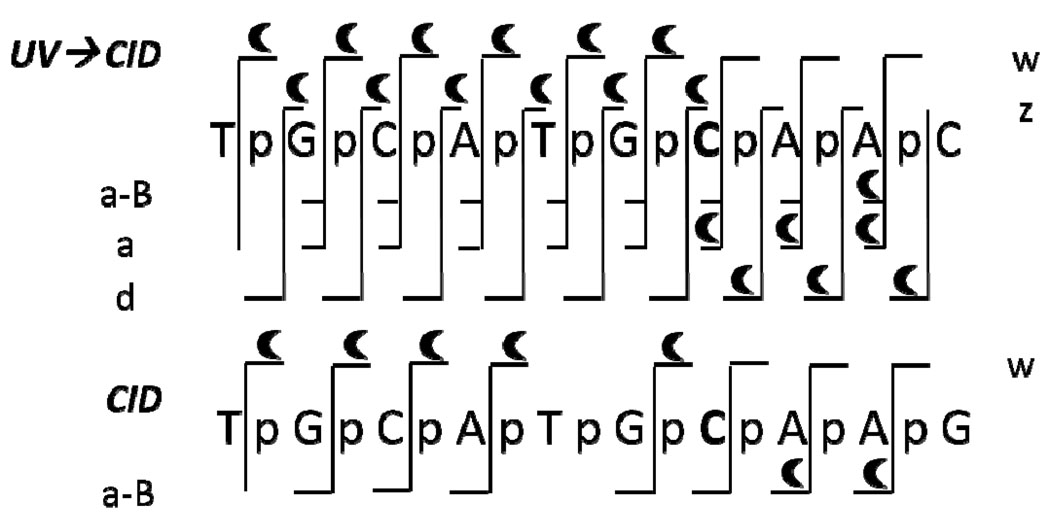
Most cytosine residues at CpG sites are physiologically methylated in mammalian genomes.53 Although 5-methylcytosine does not alter coding information, its presence plays a number of important biological roles, such as repression of gene transcription and the maintenance of gene integrity.54 DNA methylation can also physiologically occur with adenine,55 and guanine as well is susceptible to methylation by certain methylating agents.56 The oligodeoxynucleotide Mss10 (see sequence in Table 1) was characterized by EPD and CID as a means to pinpoint the cytosine methylation site. The representative spectra and resulting backbone cleavages observed upon both EPD and CID are summarized in Figure 4. Those product ions that retain the methyl group are readily identified based on their characteristic mass shifts in the MS/MS spectra and are highlighted with crescents. Interpretation of the MS/MS spectra confirms that there is only one modification located at the seventh residue. In the CID mass spectrum, the pair of 3’-w4 and 5’-a8-AH ions are methylated, indicating the methyl group resides on the oligodeoxynucleotide somewhere between those two complementary products, a region including the cytosine nucleobase, the ribose at that residue, and the two adjacent phosphate groups. For EPD, the 3’-z4 and 5’-a7 ions are methylated, pinpointing the methylation to an even more specific location, either the cytosine nucleobase or the adjacent ribose. Comparison of the 5’-a7 methylated and the 5’-a7-C unmethylated further confirms the site of modification.
Figure 4.
MS/MS spectra of Mss10 by (a) EPD of 3-• (one UV pulse, 5mJ; then 8% normalized collision energy, 30 ms), and (b) CID 3- (8% normalized collision energy, 30 ms). Precursor ions are noted with a star. Bolded and italicized product ions retain the modification. A summary of the product ions formed from EPD and CID for the methylated single strand 10-mer (c), in which the slash marks represent cleavages at that location. A crescent above the slash mark represents a product containing the methyl modification. .
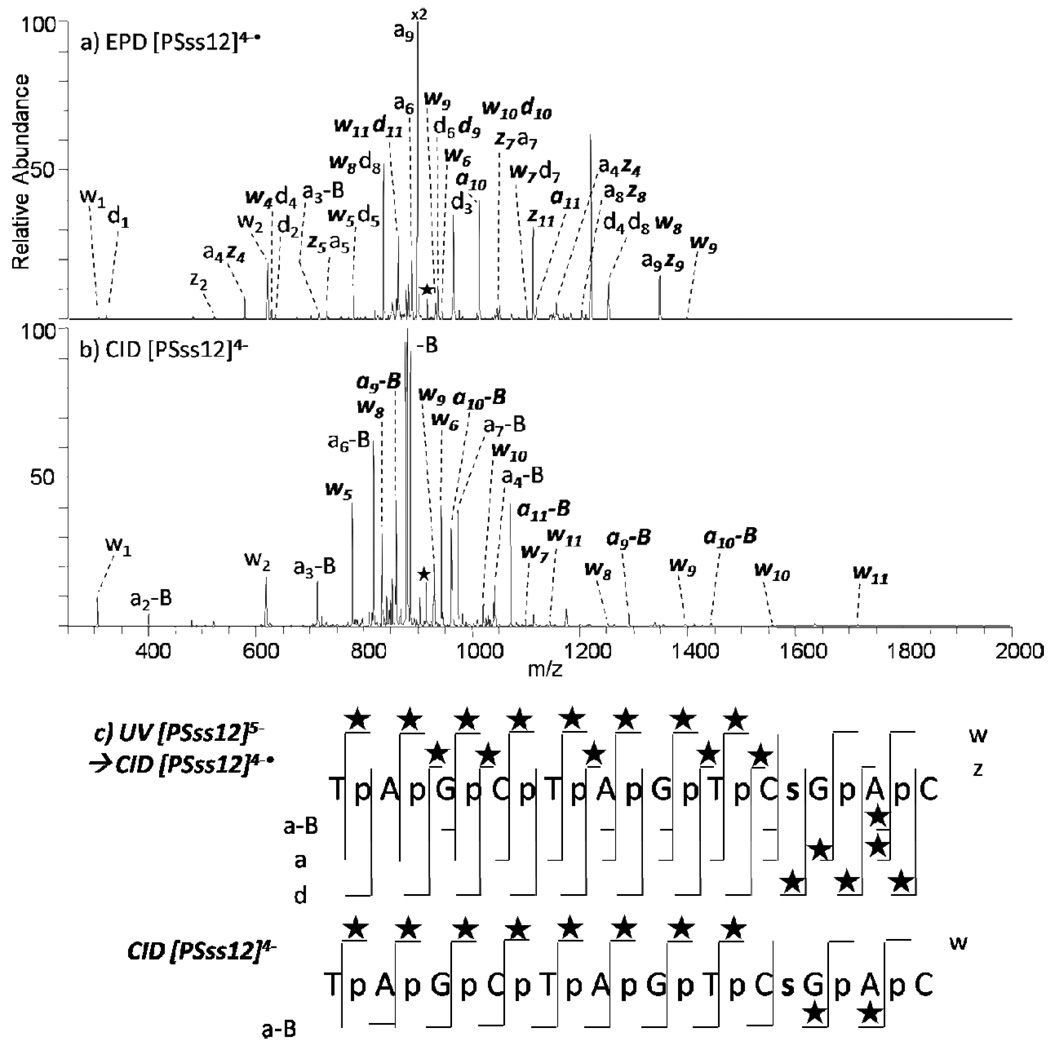
Coupled with the knowledge that cytosine nucleobases are more often methylated than other regions in a DNA oligodeoxynucleotide, CID and EPD provide similar levels of structural information for this example. In order to evaluate the ability of EPD to specifically pinpoint a modification in another location, we characterized the phosphorothioate-modified oligodeoxynucleotide, PSss12, by EPD and CID (Figure 5). For phosphorothioate (PS) modified oligodeoxynucleotides, a sulfur atom is substitute for one non-bridging oxygen in the phosphate backbone of an oligodeoxynucleotide, which renders the internucleotide linkage resistant to nuclease degradation.57,58 The summarized cleavages for both EPD and CID (Figure 5c) (with the characteristic mass shift due to the sulfur atom indicated by stars) indicate that there is only one modification, and it is located at the ninth residue. For CID, the w4 and a10-AH ions are modified, indicating the modification resides somewhere on the oligodeoxynucleotide where those two products overlap, which includes the cytosine nucleobase, the ribose at that residue, the two adjacent phosphate groups, and the ribose at the tenth residue. For EPD, the z4 and d9 ions are modified, pinpointing the modification to a more specific location: a region comprising the cytosine nucleobase, the ribose at that residue, and the 3’ adjacent phosphate group. In addition, taking into account that the a9 ion is never detected with the modification, it can be assumed that the modification must reside on the phosphate backbone. In this case, EPD outperforms CID.
Figure 5.
MS/MS spectra of PSss12 by (a) EPD of 4-• (one UV pulse, 5 mJ; then 8% normalized collision energy, 30 ms), and (b) CID 4- (8% normalized collision energy, 30 ms). Precursor ions are noted with a star. Bolded and italicized product ions retain the modification. Not all of the EPD product ions are labeled due to the complexity of the spectrum. A summary of the product ions formed from EPD and CID for the phosphorothioate single strand 12-mer (c), in which the slash marks represent cleavages at that location. A star above the slash mark represents a product containing the phosphorothioate modification. The phosphorothoate modification is shown as an s in the sequence.
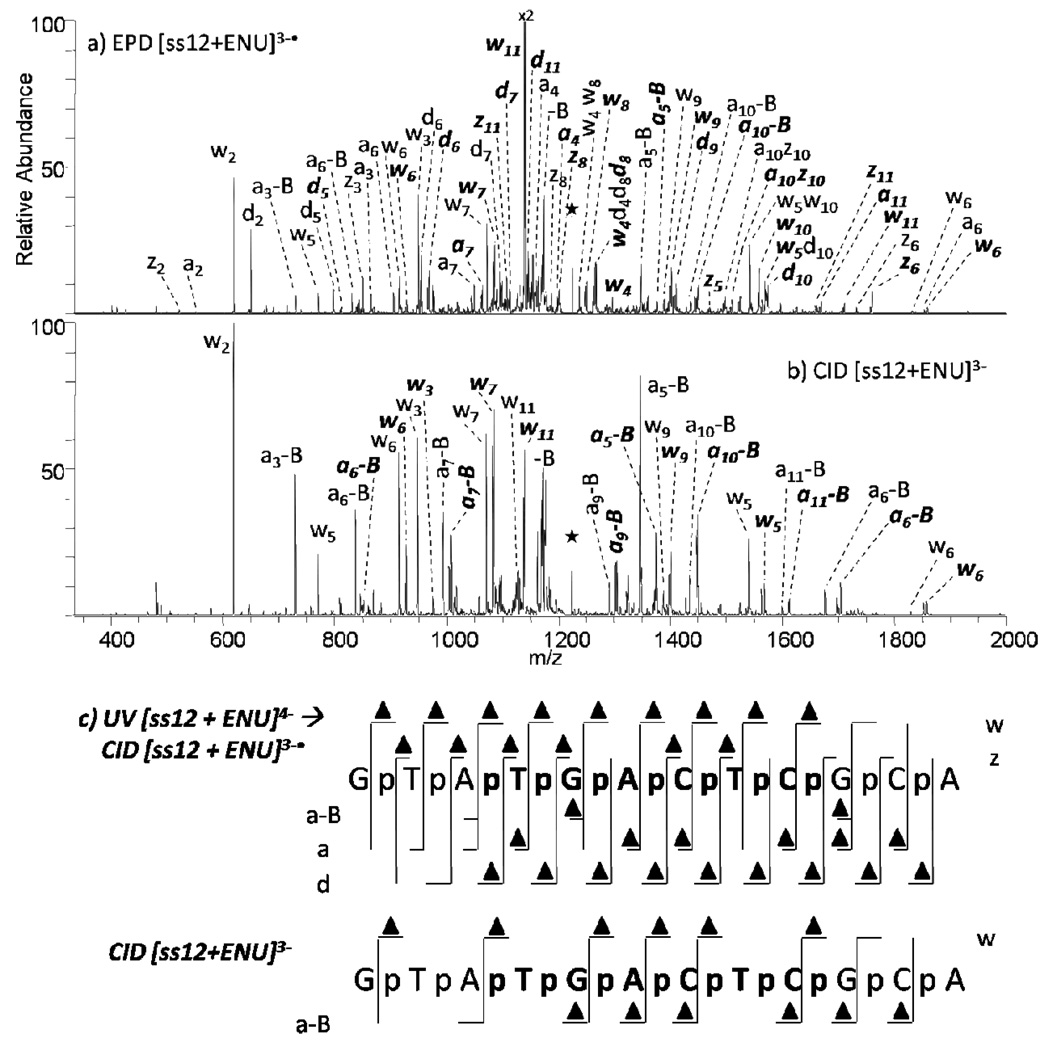
As a final example, N-ethyl-N-nitrosourea (ENU) is a highly potent alkylating agent which acts by transferring an ethyl moiety to nucleic acids. Much discrepancy exists regarding the site of alkylation, with some studies finding nucleobases are the target, including guanine,59–64 thymine,59, 61, 64–67 and adenine.63–65 Other studies have indicated that the major site of adduction occurs at the oxygen of the phosphate backbone.68–70 While it is likely that reaction conditions influence the extent of alkylation and the specific alkylation sites, we were interested in evaluating the use of EPD as a means to pinpoint the ethylation sites. Oligodeoxynucleotide ss12 was reacted with ENU and subsequently characterized by EPD and CID (Figure 6). The summarized cleavages upon EPD and CID of ENU-modified ss12 are shown in Figure 6c. According to the established nomenclature for oligonucleotide dissociation, the four possible cleavages along the phosphodiester chain are indicated by the lower case letters a,b,c, and d for fragments containing the 5’-OH group and w,x,y, and z for fragments containing the 3’-OH group. The numerical subscripts indicate the number of bases from the respective termini. The products formed by EPD (w, d, a, z ions) result from cleavages that occur both 5’ and 3’ to the phosphate group, yielding some products that consist of the nucleobase, ribose, and the phosphate at the newly terminal residue (w and d ions) in addition to the rest of the oligonucleotide, with other products formed containing only the newly terminal nucleobase and the ribose (a and z ions) with the remainder of the oligonucleotide. These complementary sets of differential products allow the ethylation sites to be pinpointed on the phosphate group or the nucleobase/ribose moiety. For ethylation of ss12, EPD allows the modification to be pinpointed to the phosphate, specifically due to the a3 and ethylated d3 ions, and the ethylated w3 and z3 ions. The limited backbone cleavages by CID do not provide sufficient information to identify the ethylation site. In addition, we noted that as the length of the product ion increased (regardless of ion type), the abundances of the modified ions increased relative to analogous unmodified ions (data not shown). The nearly linear increase in percent modification confirms the lack of sequence specificity of the ENU modification.
Figure 6.
MS/MS spectra of ss12+ENU by (a) EPD of 3-• (one UV pulse, 5mJ; then 37% normalized collision energy, 30 ms), and (b) CID 3- (37% normalized collision energy, 30 ms). Precursor ions are noted with a star. Bolded and italicized product ions retain the modification. Not all of the EPD product ions are labeled due to the complexity of the spectrum. A summary of the product ions formed from EPD and CID for the ENU modified single strand 12-mer (c), in which the slash marks represent cleavages at that location. A triangle above the slash mark represents a product containing the ENU modification.
Conclusions
UVPD of DNA oligodeoxynucleotides at 193 nm promotes extensive charge reduction, in addition to an impressive array of w, x, y, z, a, b, c, d, and a-B ions. CID of the charge reduced ions formed upon UVPD, termed EPD, results in far greater abundances of informative sequence ions, including w, z, a, d, and occasionally a-B ions. Although the total number of different types of ions produced by EPD is lower than produced upon UVPD, the overall numbers of products produced is similar or greater, meaning that each series of sequence ions (e.g. w, z, a, d) is more extensive. The efficient and characteristic fragmentation promoted by EPD proves to be more effective than that induced by CID for pinpointing the location of modifications of oligodeoxynucleotides, such as phosphorothioate substitutions and ethylation.
Supplementary Material
For modified oligodeoxynucleotides, UVPD at 193 nm followed by CID of the charge reduced species pinpoints the modification site more readily than CID alone.
Acknowledgements
Funding from the Robert A. Welch Foundation (F-1155) and the National Institutes of Health (RO1 GM65956) is gratefully acknowledged. Smith is also an NSF Graduate Research Fellow (Fellow 2007038036).
References
- 1.Huber Christian, Oberacher Herbert. PCT Int. Appl. 2003:21. [Google Scholar]
- 2.McLuckey ScottA, Van Berkel GaryJ, Glish GaryL. Journal of the American Society for Mass Spectrometry. 1992;3(1):60–70. doi: 10.1016/1044-0305(92)85019-G. [DOI] [PubMed] [Google Scholar]
- 3.Keller KarinM, Brodbelt JenniferS. Analytical Biochemistry. 2004;326(2):200–210. doi: 10.1016/j.ab.2003.12.010. [DOI] [PubMed] [Google Scholar]
- 4.Guan Ziqiang, Kelleher NeilL, O'Connor PeterB, Aaserud DavidJ, Little DanielP, McLafferty FredW. International Journal of Mass Spectrometry and Ion Processes. 1996;157/158:357–364. [Google Scholar]
- 5.Gabelica Valerie, Tabarin Thibault, Antoine Rodolphe, Rosu Frederic, Compagnon Isabelle, Broyer Michel, De Pauw Edwin, Dugourd Philippe. Analytical Chemistry. 2006;78(18):6564–6572. doi: 10.1021/ac060753p. [DOI] [PubMed] [Google Scholar]
- 6.Gabelica Valerie, Rosu Frederic, Tabarin Thibault, Kinet Catherine, Antoine Rodolphe, Broyer Michel, De Pauw Edwin, Dugourd Philippe. Journal of the American Chemical Society. 2007;129(15):4706–4713. doi: 10.1021/ja068440z. [DOI] [PubMed] [Google Scholar]
- 7.Yang Jiong, Mo Jingjie, Adamson JulieT, Hakansson Kristina. Analytical chemistry. 2005;77(6):1876–1882. doi: 10.1021/ac048415g. [DOI] [PubMed] [Google Scholar]
- 8.Mo Jingjie, Hakansson Kristina. Analytical and Bioanalytical Chemistry. 2006;386(3):675–681. doi: 10.1007/s00216-006-0614-z. [DOI] [PubMed] [Google Scholar]
- 9.Yang Jiong, Hakansson Kristina. Journal of the American Society for Mass Spectrometry. 2006;17(10):1369–1375. doi: 10.1016/j.jasms.2006.05.006. [DOI] [PubMed] [Google Scholar]
- 10.Yang Jiong, Hakansson Kristina. International Journal of Mass Spectrometry. 2008;276(2–3):144–148. [Google Scholar]
- 11.Yang Jiong, Hakansson Kristina. European Journal of Mass Spectrometry. 2009;15(2):293–304. doi: 10.1255/ejms.966. [DOI] [PubMed] [Google Scholar]
- 12.Kinet Catherine, Gabelica Valerie, Balbeur Dorothee, De Pauw Edwin. International Journal of Mass Spectrometry. 2009;283(1–3):206–213. [Google Scholar]
- 13.Taucher Monika, Breuker Kathrin. Journal of the American Society for Mass Spectrometry. 2010;21(6):918–929. doi: 10.1016/j.jasms.2010.02.025. [DOI] [PubMed] [Google Scholar]
- 14.Schultz KristinN, Hakansson Kristina. International Journal of Mass Spectrometry. 2004;234(1–3):123–130. [Google Scholar]
- 15.Hakansson Kristina, Hudgins RobertR, Marshall AlanG, O'Hair RichardAJ. Journal of the American Society for Mass Spectrometry. 2003;14(1):23–41. doi: 10.1016/S1044-0305(02)00708-0. [DOI] [PubMed] [Google Scholar]
- 16.Smith SunceraeI, Brodbelt JenniferS. International Journal of Mass Spectrometry. 2009;283(1–3):85–93. doi: 10.1016/j.ijms.2009.02.012. [DOI] [PMC free article] [PubMed] [Google Scholar]
- 17.Yang Jiong, Hakansson Kristina. In: Mass Spectrometry of Nucleosides and Nucleic Acids. Banoub JosephH, Limbach PatrickA., editors. Taylor & Francis, Inc; 2010. pp. 105–126. [Google Scholar]
- 18.Su DianGT, Taylor John-StephenA, Gross MichaelL. Chemical Research in Toxicology. 2010;23(3):474–479. doi: 10.1021/tx9003962. [DOI] [PMC free article] [PubMed] [Google Scholar]
- 19.Zhang Qiang, Gross MichaelL. Chemical Research in Toxicology. 2008;21(6):1244–1252. doi: 10.1021/tx800067s. [DOI] [PMC free article] [PubMed] [Google Scholar]
- 20.Chowdhury Goutam, Guengerich FPeter. Angewandte Chemie. (International Edition) 2008;47(2):381–384. doi: 10.1002/anie.200703942. [DOI] [PubMed] [Google Scholar]
- 21.Qiu Sheng-Xiang, Yang RichardZ, Gross MichaelL. Chemical Research in Toxicology. 2004;17(8):1038–1046. doi: 10.1021/tx049953r. [DOI] [PubMed] [Google Scholar]
- 22.Hannis JamesC, Muddiman DavidC. International Journal of Mass Spectrometry. 2002;219(1):139–150. [Google Scholar]
- 23.Zhang Li-Kang, Gross MichaelL. Journal of the American Society for Mass Spectrometry. 2002;13(12):1418–1426. doi: 10.1016/S1044-0305(02)00701-8. [DOI] [PubMed] [Google Scholar]
- 24.Wang Yinsheng, Taylor John-Stephen, Gross MichaelL. Chemical Research in Toxicology. 1999;12(11):1077–1082. doi: 10.1021/tx9900831. [DOI] [PubMed] [Google Scholar]
- 25.Wunschel DavidS, Muddiman DavidC, Smith RichardD. Advances in Mass Spectrometry. 1998;14(Chapter 15/377–Chapter 15/406) [Google Scholar]
- 26.Muddiman DavidC, Anderson GordonA, Hofstadler StevenA, Smith RichardD. Analytical Chemistry. 1997;69(8):1543–1549. doi: 10.1021/ac961134r. [DOI] [PubMed] [Google Scholar]
- 27.Crain PF, Gregson JM, McCloskey JA, Nelson CC, Peltier JM, Phillips DR, Pomerantz SC, Reddy DM. Mass Spectrometry in the Biological Sciences. 1996:497–517. [Google Scholar]
- 28.Ni Jinsong, Pomerantz StevenC, Rozenski Jef, Zhang Yizhou, McCloskey JamesA. Analytical Chemistry. 1996;68(13):1989–1999. doi: 10.1021/ac960270t. [DOI] [PubMed] [Google Scholar]
- 29.McLuckey ScottA, Habibi-Goudarzi Sohrab. Journal of the American Society for Mass Spectrometry. 1994;5(8):740–747. doi: 10.1016/1044-0305(94)80006-5. [DOI] [PubMed] [Google Scholar]
- 30.Sannes-Lowery KristinA, Hofstadler StevenA. Journal of the American Society for Mass Spectrometry. 2003;14(8):825–833. doi: 10.1016/S1044-0305(03)00335-0. [DOI] [PubMed] [Google Scholar]
- 31.Polo LenoreM, McCarley TracyDonovan, Limbach PatrickA. Analytical Chemistry. 1997;69(6):1107–1112. [Google Scholar]
- 32.Ni Jinsong, Pomerantz StevenC, McCloskey JamesA. Nucleic Acids Symposium Series. Twentythird Symposium on Nucleic Acids Chemistry, 1996; 1996. pp. 113–114. [Google Scholar]
- 33.Coombs CCallie, Limbach PatrickA. Mass Spectrometry of Nucleosides and Nucleic Acids. 2010:423–429. [Google Scholar]
- 34.Durairaj Anita, Limbach PatrickA. Rapid Communications in Mass Spectrometry. 2008;22(23):3727–3734. doi: 10.1002/rcm.3789. [DOI] [PMC free article] [PubMed] [Google Scholar]
- 35.Durairaj Anita, Limbach PatrickA. Analytica Chimica Acta. 2008;623(2):117–125. doi: 10.1016/j.aca.2008.06.027. [DOI] [PMC free article] [PubMed] [Google Scholar]
- 36.Kellersberger KatherineA, Yu EizadoraT, Merenbloom SamuelI, Fabris Daniele. Journal of the American Society for Mass Spectrometry. 2005;16(2):199–207. doi: 10.1016/j.jasms.2004.10.008. [DOI] [PubMed] [Google Scholar]
- 37.Zhou Shaolian, Sitaramaiah Devarasetty, Pomerantz StevenC, Crain PamelaF, McCloskey JamesA. Nucleosides, Nucleotides & Nucleic Acids. 2004;23(1 & 2):41–50. doi: 10.1081/ncn-120027816. [DOI] [PubMed] [Google Scholar]
- 38.Patteson KG, Rodicio LenorePolo, Limbach PatrickA. Nucleic Acids Research. 2001;29(10):e49/1–e49/7. doi: 10.1093/nar/29.10.e49. [DOI] [PMC free article] [PubMed] [Google Scholar]
- 39.Kellersberger KatherineA, Yu Eizadora, Kruppa GaryH, Young MalinM, Fabris Daniele. Analytical Chemistry. 2004;76(9):2438–2445. doi: 10.1021/ac0355045. [DOI] [PubMed] [Google Scholar]
- 40.Yu Eizadora, Fabris Daniele. Journal of Molecular Biology. 2003;330(2):211–223. doi: 10.1016/s0022-2836(03)00589-8. [DOI] [PubMed] [Google Scholar]
- 41.Zhang Qingrong, Yu EizadoraT, Kellersberger KatherineA, Crosland Elizabeth, Fabris Daniele. Journal of the American Society for Mass Spectrometry. 2006;17(11):1570–1581. doi: 10.1016/j.jasms.2006.06.002. [DOI] [PubMed] [Google Scholar]
- 42.Turner KevinB, Yi-Brunozzi HyeYoung, Brinson RobertG, Marino JohnP, Fabris Daniele, Le Grice StuartFJ. RNA. 2009;15(8):1605–1613. doi: 10.1261/rna.1615409. [DOI] [PMC free article] [PubMed] [Google Scholar]
- 43.Turner KevinB, Yi-Brunozzi HyeYoung, Brinson RobertG, Marino JohnP, Fabris Daniele, Le Grice StuartFJ. RNA. 2009;15(8):1605–1613. doi: 10.1261/rna.1615409. [DOI] [PMC free article] [PubMed] [Google Scholar]
- 44.Nyakas Adrien, Eymann Michael, Schuerch Stefan. Journal of the American Society for Mass Spectrometry. 2009;20(5):792–804. doi: 10.1016/j.jasms.2008.12.018. [DOI] [PubMed] [Google Scholar]
- 45.Monn SelinaTM, Schuerch Stefan. Journal of the American Society for Mass Spectrometry. 2007;18(6):984–990. doi: 10.1016/j.jasms.2007.02.006. [DOI] [PubMed] [Google Scholar]
- 46.Wang Yinsheng, Men Lijie, Vivekananda Shetty. Journal of the American Society for Mass Spectrometry. 2002;13(10):1190–1194. doi: 10.1016/S1044-0305(02)00452-X. [DOI] [PubMed] [Google Scholar]
- 47.Luo Hai, Lipton MaryS, Smith RichardD. Journal of the American Society for Mass Spectrometry. 2002;13(3):195–199. doi: 10.1016/S1044-0305(01)00353-1. [DOI] [PubMed] [Google Scholar]
- 48.Wan KX, Gross ML. Journal of the American Society for Mass Spectrometry. 2001;12(5):580–589. doi: 10.1016/S1044-0305(01)00223-9. [DOI] [PubMed] [Google Scholar]
- 49.Gardner MylesW, Vasicek LisaA, Shabbir Shagufta, Anslyn EricV, Brodbelt JenniferS. Analytical Chemistry (Washington, DC, United States) 2008;80(13):4807–4819. doi: 10.1021/ac800625x. [DOI] [PubMed] [Google Scholar]
- 50.Brodbelt JenniferS, Wilson JeffreyJ. Mass Spectrometry Reviews. 2009;28(3):390–424. doi: 10.1002/mas.20216. [DOI] [PubMed] [Google Scholar]
- 51.Danell AllisonS, Parks JoelH. Journal of the American Society for Mass Spectrometry. 2003;14(12):1330–1339. doi: 10.1016/S1044-0305(03)00578-6. [DOI] [PubMed] [Google Scholar]
- 52.Hush NS, Cheung AgnesS. Chemical Physics Letters. 1975;34(1):11–13. [Google Scholar]
- 53.Klose RobertJ, Bird AdrianP. Trends in Biochemical Sciences. 2006;31(2):89–97. doi: 10.1016/j.tibs.2005.12.008. [DOI] [PubMed] [Google Scholar]
- 54.Bird AdrianP. Nature (London, United Kingdom) 1986;321(6067):209–213. doi: 10.1038/321209a0. [DOI] [PubMed] [Google Scholar]
- 55.Vanyushin BF. Molecular Biology (New York, NY, United States, English Edition) 2005;39(4):473–481. [Google Scholar]
- 56.Schoental Regina. Biochemical Journal. 1967;102(1):5C–7C. doi: 10.1042/bj1020005c. [DOI] [PMC free article] [PubMed] [Google Scholar]
- 57.Eckstein F. Nucleosides & Nucleotides. 1985;4(1–2):77–79. [Google Scholar]
- 58.Guga Piotr, Boczkowska Malgorzata, Janicka Magdalena, Maciaszek Anna, Nawrot Barbara, Antoszczyk Slawomir, Stec WojciechJ. Pure and Applied Chemistry. 2006;78(5):993–1002. [Google Scholar]
- 59.Yang JiaLing, Lee PingChuan, Lin SingRong, Lin JinGuo. Carcinogenesis. 1994;15(5):939–945. doi: 10.1093/carcin/15.5.939. [DOI] [PubMed] [Google Scholar]
- 60.Sendowski Kirsten, Rajewsky ManfredF. Mutation Research, Fundamental and Molecular Mechanisms of Mutagenesis. 1991;250(1–2):153–160. doi: 10.1016/0027-5107(91)90171-j. [DOI] [PubMed] [Google Scholar]
- 61.Richardson KK, Richardson FC, Crosby RM, Swenberg JA, Skopek TR. Proceedings of the National Academy of Sciences of the United States of America. 1987;84(2):344–348. doi: 10.1073/pnas.84.2.344. [DOI] [PMC free article] [PubMed] [Google Scholar]
- 62.Fortini P, Bignami M, Dogliotti E. Mutation Research, DNA Repair. 1990;236(1):129–137. doi: 10.1016/0921-8777(90)90040-c. [DOI] [PubMed] [Google Scholar]
- 63.Nehls Peter, Rajewsky ManfredF. Mutation Research. 1985;150(1–2):13–21. doi: 10.1016/0027-5107(85)90096-x. [DOI] [PubMed] [Google Scholar]
- 64.Swenson DavidH, Harbach PhilipR, Trzos RonaldJ. Carcinogenesis. 1980;1(11):931–936. doi: 10.1093/carcin/1.11.931. [DOI] [PubMed] [Google Scholar]
- 65.Guttenplan JosephB, Hu YouChiu. Mutation Research Letters. 1984;141(3–4):153–159. doi: 10.1016/0165-7992(84)90089-7. [DOI] [PubMed] [Google Scholar]
- 66.Mittelstaedt RobertaA, Smith BeverlyA, Heflich RobertH. Environmental and Molecular Mutagenesis. 1995;26(4):261–269. doi: 10.1002/em.2850260402. [DOI] [PubMed] [Google Scholar]
- 67.Boerrigter MichaelETI, Mullaart Erik, Berends Frits, Vijg Jan. Carcinogenesis. 1991;12(1):77–82. doi: 10.1093/carcin/12.1.77. [DOI] [PubMed] [Google Scholar]
- 68.Stahl KW, Koester FE. Experientia. 1984;40(7):734–736. doi: 10.1007/BF01949749. [DOI] [PubMed] [Google Scholar]
- 69.Rizvi RY, Hadi SM. Bioscience reports. 1984;4(9):729–735. doi: 10.1007/BF01128813. [DOI] [PubMed] [Google Scholar]
- 70.Manfield IainW, Stockley PeterG. Methods in molecular biology. 2009;543:105–120. doi: 10.1007/978-1-60327-015-1_9. [DOI] [PubMed] [Google Scholar]
Associated Data
This section collects any data citations, data availability statements, or supplementary materials included in this article.


