Abstract
Laser desorption postionization mass spectrometry (LDPI-MS) with 8.0 – 12.5 eV vacuum ultraviolet synchrotron radiation is used to single photon ionize antibiotics and extracellular neutrals that are laser desorbed both neat and from intact bacterial biofilms. Neat antibiotics are optimally detected using 10.5 eV LDPI-MS, but can be ionized using 8.0 eV radiation, in agreement with prior work using 7.87 eV LDPI-MS. Tunable vacuum ultraviolet radiation also postionizes laser desorbed neutrals of antibiotics and extracellular material from within intact bacterial biofilms. Different extracellular material is observed by LDPI-MS in response to rifampicin or trimethoprim antibiotic treatment. Once again, 10.5 eV LDPI-MS displays the optimum trade-off between improved sensitivity and minimum fragmentation. Higher energy photons at 12.5 eV produce significant parent ion signal, but fragment intensity and other low mass ions are also enhanced. No matrix is added to enhance desorption, which is performed at peak power densities insufficient to directly produce ions, thus allowing observation of true VUV postionization mass spectra of antibiotic treated biofilms.
I. INTRODUCTION
Staphylococcus epidermidis is a bacteria capable of forming biofilms that are a major cause of infection in surgical implants.1 Bacterial biofilms of S. epidermidis and other microbes are generally resistant to antibiotic therapies, making their treatment a major concern in hospitals and outpatient settings.2 Antibiotic resistance may derive from the extracellular polymeric substance, composed of polysaccharides, nucleic acids, and other species produced by the microbes, or from the fortified cell walls of S. epidermidis and similar gram positive microbes.3 Studies of biofilm antimicrobial resistance would benefit from new methods in mass spectrometric (MS) imaging that probe the intact biofilm and allow characterization of relevant components of the extracellular environment. Secondary ion mass spectrometry (SIMS) has been applied to biofilms4 and bacteria.5,6 Other methods in imaging MS also show promise for such analyses,7 including matrix assisted laser desorption ionization MS of bacterial colonies grown on agar.6
Laser desorption postionization mass spectrometry (LDPI-MS) is one method being investigated for analysis of intact bacterial biofilms.8,9 LDPI-MS employs single photon ionization (SPI) with vacuum ultraviolet (VUV) radiation to effectively ionize gaseous neutrals. SPI is typically performed near the ionization threshold, where irradiating VUV photon energies are within a few eV of analyte ionization energies, minimizing excess energy within the parent ion that can otherwise lead to dissociation. The SPI mechanism and other issues were discussed previously along with other fundamental aspects of both VUV SPI and LDPI-MS.8,9 By decoupling desorption and ionization, LDPI-MS minimizes the fluctuation in ionization efficiency with analyte which affects other imaging methods.10 Other postionization strategies have also been applied with success to both imaging MS experiments that utilize either primary ion or infrared laser desorption.11–14
Prior work with 7.87 eV VUV photons showed that LDPI-MS is a sensitive analytical tool to selectively probe analytes within intact bacterial biofilms. 7.87 eV LDPI-MS detected and imaged a concentration gradient of rifampicin in a S. epidermidis biofilm and several other antibiotics.9,15 Quorum sensing peptides in Bacillus subtilis have also been detected by 7.87 eV LDPI-MS.16 The use of 7.87 eV VUV photons in LDPI-MS is straightforward since they are produced by robust, commercially available excimer laser sources.8 However, the dearth of intense, pulsed, commercially available VUV sources for higher photon energies necessitates the use of synchrotron radiation for thorough evaluation of the application of SPI-MS to imaging strategies. Prior work has also shown the capability of tunable VUV synchrotron radiation to detect sputtered neutrals for imaging mass spectrometry.17,18 This paper demonstrates the use of tunable 8.0 to 12.5 eV photon energies with LDPI-MS to detect antibiotics both neat and doped into drip flow grown biofilms. The photon energy tunability available with synchrotron sources allows for the determination of the most sensitive photon energy for antibiotic detection. This approach also permits characterization of extracellular substances within intact bacterial biofilms, including those formed in response to antibiotic treatment.
II. EXPERIMENTAL
A. MS Instrumentation
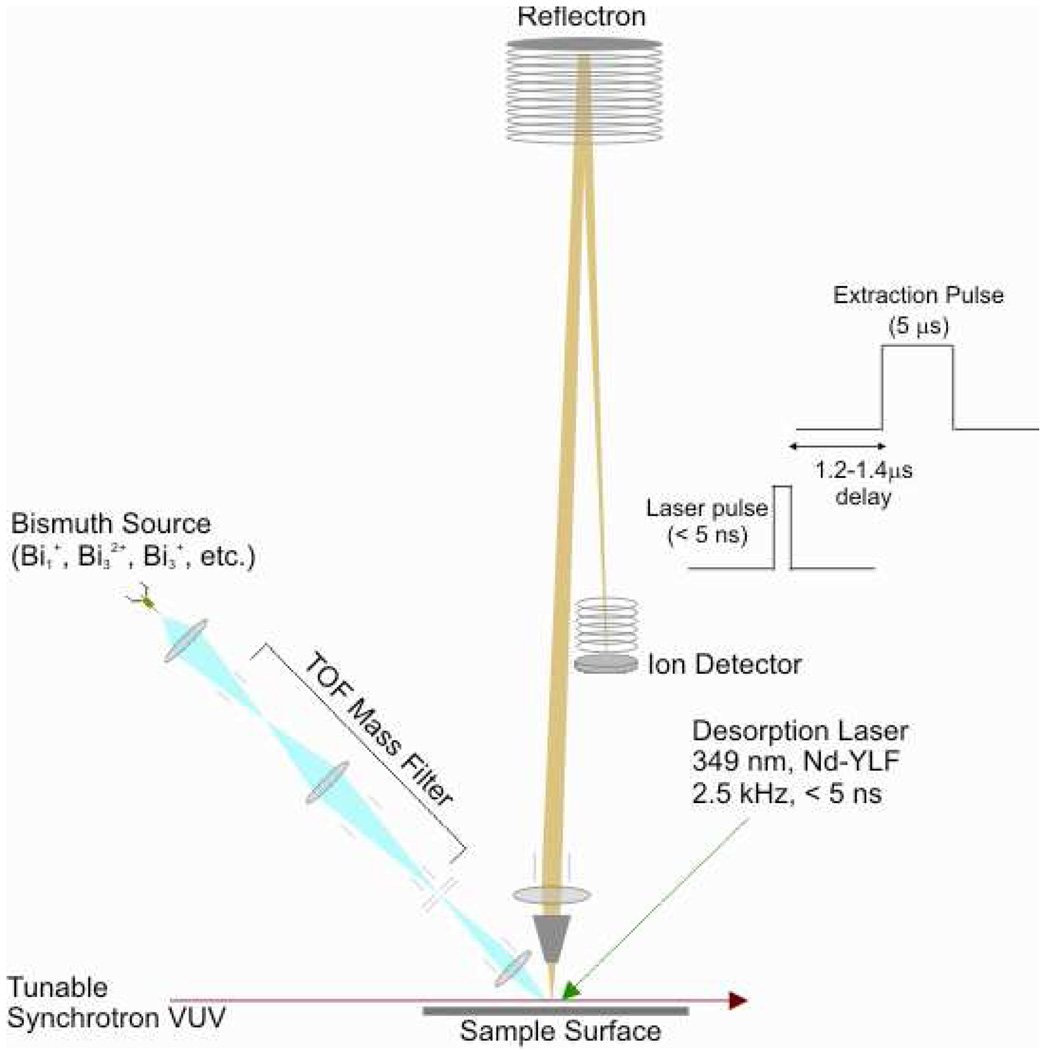
Studies were performed with a modified commercial secondary ion mass spectrometer (TOF.SIMS 5, ION TOF Inc., Münster, Germany) coupled to a desorption laser (Explorer, Newport, Nd-YLF 349 nm) and synchrotron VUV radiation at the Chemical Dynamics Beamline, Advanced Light Source, Lawrence Berkeley National Laboratory.19 The experimental configuration is shown schematically in Figure 1 and was described previously17 except for the coupling of the desorption laser. Variation in the undulator gap on the beamline allowed tuning of the VUV photon energy from 8.0 to 12.5 eV photon energy with a spectral bandwidth of 0.22 eV.19 An argon gas filter was used to remove higher energy harmonics. The VUV beam was focused by beamline optics to a 280 µm vertical × 490 µm horizontal waist, which was aligned so that the beam barely grazed the sample. The extraction cone of the mass spectrometer was 1.5 mm above the sample surface.17
Figure 1.
Schematic of TOF-SIMS instrument adapted for laser desorption postionization (LDPI-MS). Includes added Nd-YLF desorption laser, vacuum ultraviolet synchrotron radiation, and extraction pulse timing scheme.
The Nd-YLF desorption laser was operated at a repetition rate of 2500 Hz and focused to a ~300 µm spot diameter. The sample stage was fixed with respect to desorption laser spot during data acquisition. The <5 ns pulse delivered peak power densities of 2 – 10 MW/cm2 when operated in the range of 6 – 34 µJ/pulse. Desorbed neutrals were photoionized by the quasi-continuous synchrotron radiation, and were extracted by a 5 µs long ion extraction pulse beginning 1.2 – 1.4 µs after the desorption laser. Mass resolution of the instrument in the laser desorption postionization mode was measured as ~1000 for a sample of 2,5-dibromotyrosine on a gold substrate, but spectra on biofilms are broader due to charging effects. All displayed spectra are the sum of 143,000 laser shots during sample analysis which occurred in 57 seconds.
B. Sample and Biofilm Preparation
Calibrants and neat antibiotics (Sigma-Aldrich, Milwaukee, WI, USA) were deposited on indium tin oxide (ITO) coated glass microscope slides (Sigma-Aldrich). Colony biofilms were prepared from stock solutions of Staphylococcus epidermidis (ATCC 35984, Manassas, VA, USA).15 Drip flow biofilms were grown on ITO glass by methods previously described.20 Flow cells were inoculated with 1 mL bacterial culture containing ~1×10⁸ colony forming units (CFU) per mL. An additional 10 mL of tryptic soy broth (TSB) for nutrient supply was provided for 12 hours of static growth. Growth for an additional 12 hours occurred under a flow of 3.6 mL/hour of full strength TSB with the flow cell apparatus tilted at a 10° incline. Antibiotics were introduced into the biofilms during a final hour of static growth, during which 50 µL of antibiotic was administered to each sample with a final concentration from 0.1 to 1.0 mM in acetonitrile (as noted below). Each biofilm-substrate was removed from the drip flow cell and dried for 12 hours before analysis. Control biofilms were prepared in the same fashion as the above samples, but without antibiotic doping.
C. MS Data Collection
Mass calibration was performed with sexithiophene (mol. wt. 494 Da, Sigma-Aldrich) and [6,6] diphenyl C62 bis(butyric acid methyl ester) (mol. wt. 1100 Da, Sigma-Aldrich). Each sample was scanned for direct ionization by laser desorption (LD, no VUV) and synchrotron background (SB, no LD). Relative photon flux curves were obtained from 8.0 to 12.5 eV and used to correct the ion intensity at each photon energy. At least three replicates were run of each sample. Major spectral peaks were compared to chemical structures obtained from commercial fragmentation analysis software (ACD/MS Fragmenter, Advanced Chemistry Development Inc., Toronto, Ont., Canada) to assist elucidation of fragmentation pathways of the antibiotics.
III. RESULTS AND DISCUSSION
A. Detection of Neat Antibiotics
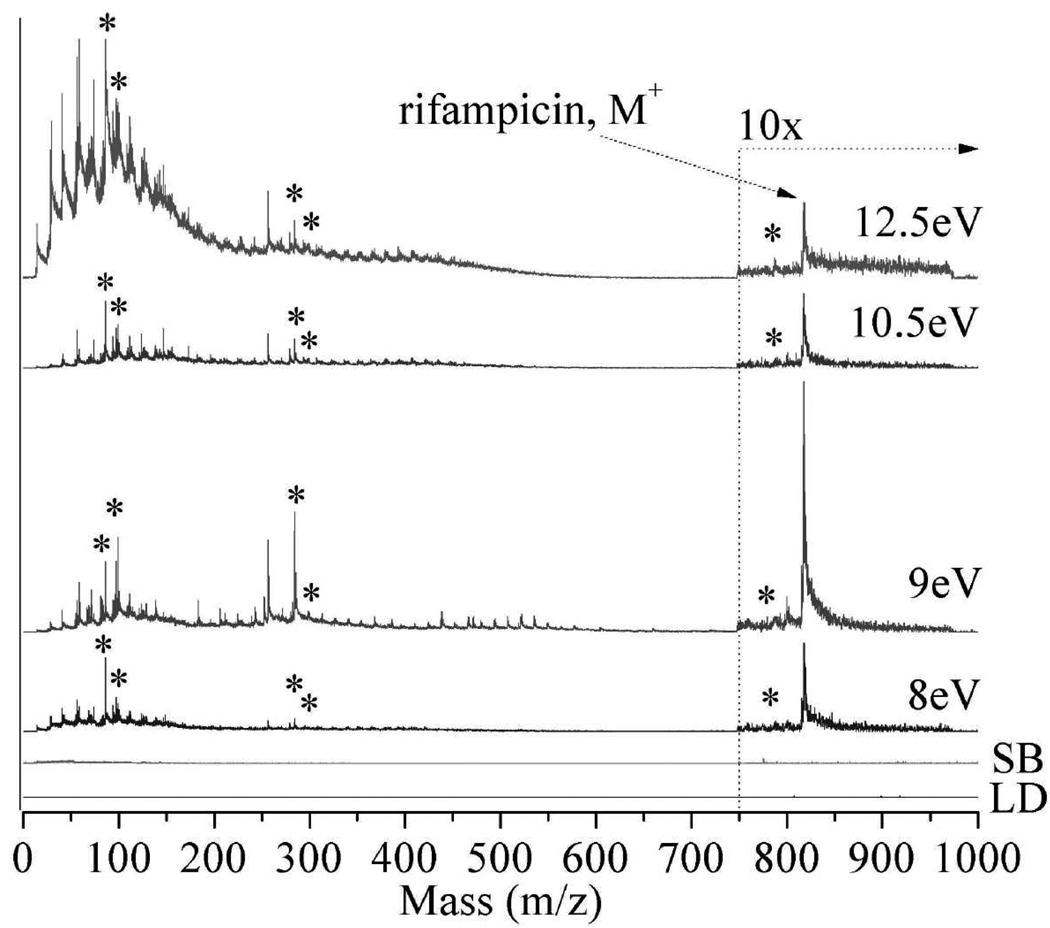
Figure 2 displays the laser desorption postionization mass spectra (LDPI-MS) of neat rifampicin adsorbed on ITO glass, recorded at VUV photon energies of 8.0, 9.0, 10.5, and 12.5 eV. Each spectrum is a plot of m/z versus ion signal corrected for photon flux variation with photon energy. The parent ion of rifampicin appears at m/z 823 and is observed at all photon energies, albeit at different intensities. All photon energies ≥8.0 eV are sensitive to this antibiotic, with the best signal to noise ratio occurring at 10.5 eV. Prior work found that the rifampicin parent ion was a radical cation.8 The enhanced ion signal at 9.0 eV vs. 10.5 eV presented in Figure 2 was not reproduced in replicate samples and probably resulted from spot-to-spot fluctuation in laser desorption efficiency.
Figure 2.
Laser desorption postionization mass spectrometry (LDPI-MS) of neat rifampicin at photon energies of 8.0 – 12.5 eV (indicated on each spectrum). Also shown are (LD) direct ionization by laser desorption without vacuum ultraviolet (VUV) radiation and (SB) synchrotron background at 12.5 eV photon energy (no LD). Ion signal is shown after correction for photon flux variation with photon energy. Asterisks indicate known rifampicin fragments. Spectra here and below are artificially offset to avoid peak overlap.
Figure 2 also displays several fragments of rifampicin including m/z 99, 298, and 791 (indicated by asterisks) which correspond to a methylated piperazine fragment, naphthalene core, and methyl-ether fragment loss, respectively. Another dominant fragment, m/z 84, likely forms via methyl loss from the m/z 99 fragment ion. The m/z 284 fragment also appears to result from rifampicin. Antibiotic fragmentation pathways will be discussed in a separate publication.
Spectral complexity from m/z 100 to 400 increases with increasing photon energy. Ions below m/z 200 are especially predominant for 12.5 eV LDPI-MS due to both increased ionization and fragmentation of parent ions. Ionization of more chemical constituents occurs as the higher photon energies exceeds the ionization energies of a larger group of species. These additional species undergoing ionization at higher photon energies include water, adventitious hydrocarbons adsorbed from vacuum, and possibly neutral fragments of rifampicin that are photodissociated by the desorption laser. Dissociative photoionization of parent ions also occurs due to excess internal energy imparted by the higher photon energy.8,9
Also shown in Figure 2 are the 12.5 eV synchrotron background (SB) without laser desorption (LD) and LD without any VUV postionization: neither of these control spectra show significant signal contributions. There is a very slight synchrotron background (SB) signal observed as a result of the beam grazing the sample surface and/or labile species subliming into the path of the synchrotron beam. For this reason, only the highest photon energy synchrotron background is shown, as this contribution is always larger than that observed at the lower photon energies.
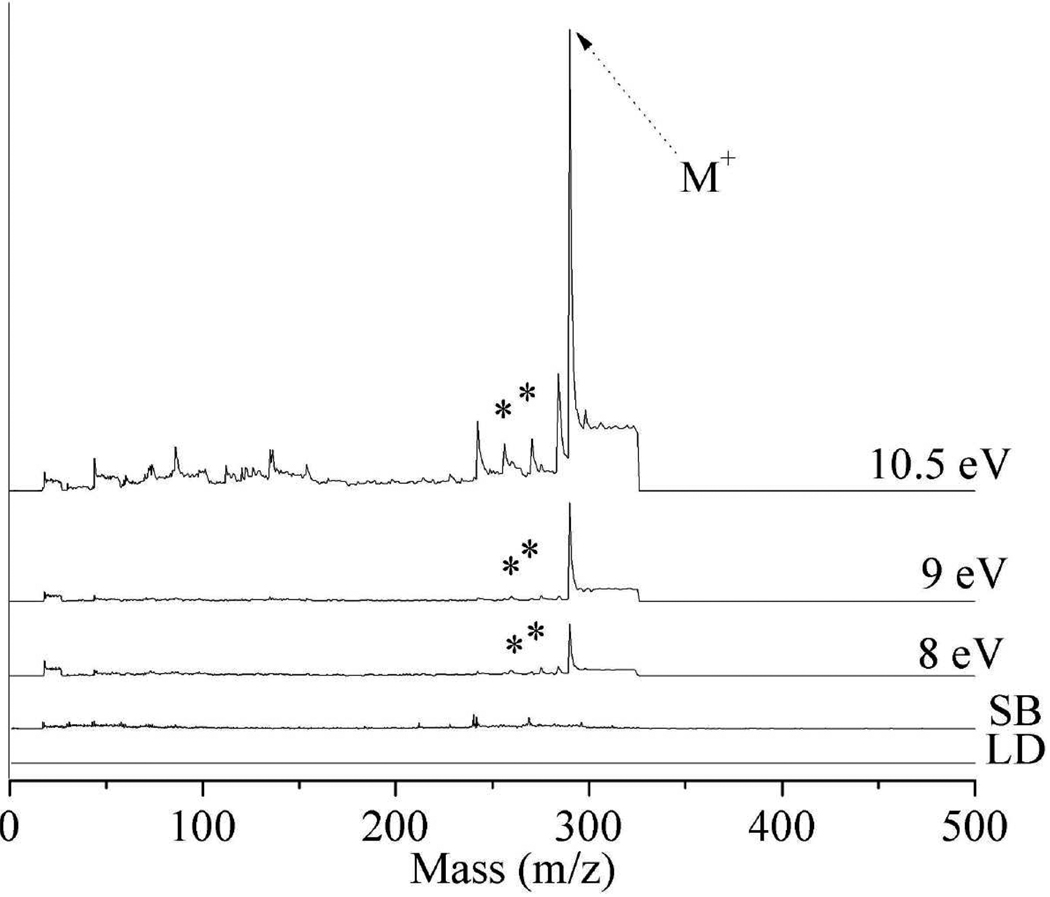
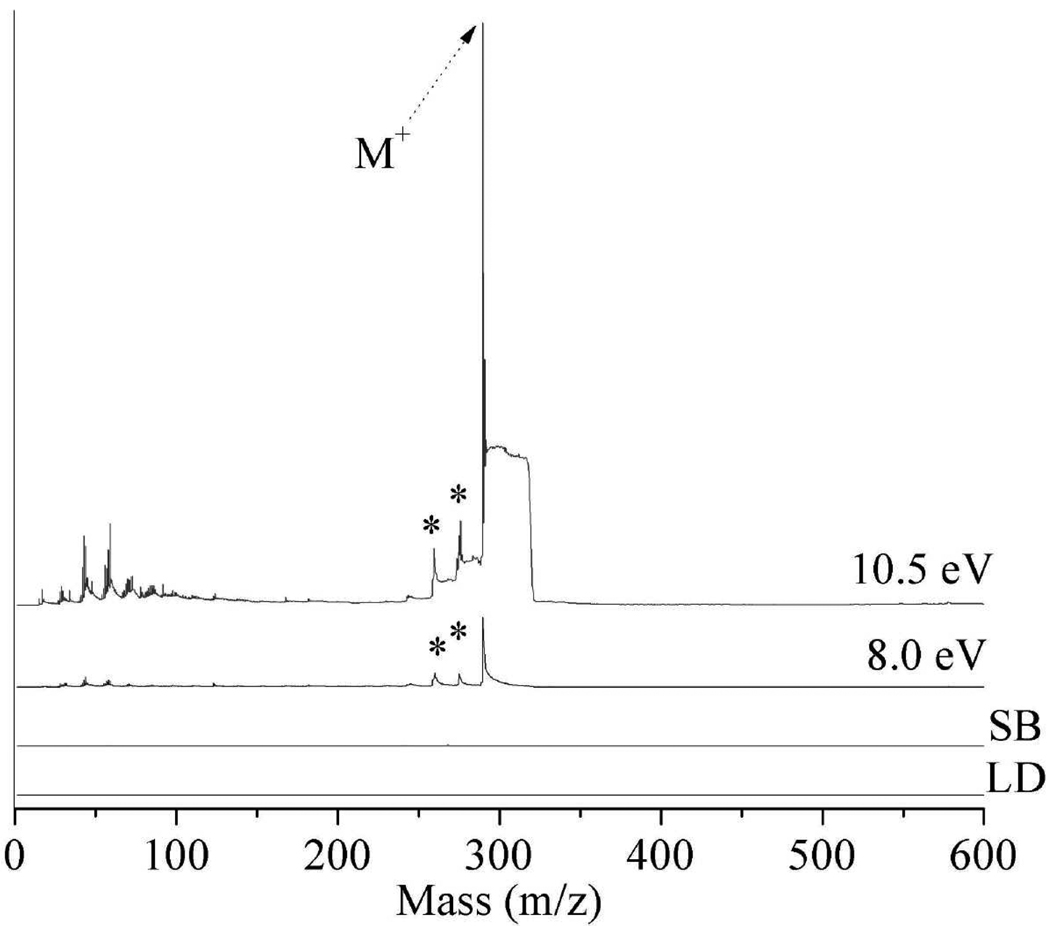
Similar results are observed for the LDPI-MS of neat trimethoprim which displays an intact parent cation at m/z 290, as shown in Figure 3. Trimethoprim fragments to form [M-NH2]+ fragment due to loss of amine at m/z 274 and [M-CH3O]+ at m/z 259 due to loss of ethanol. Other dominant, but unidentified trimethoprim-derived peaks are observed at m/z 242 and 284. The few peaks observed in the synchrotron background in Figure 3 may indicate an artifact resulting from the synchrotron beam grazing the sample surface, as discussed earlier. Ion formation from VUV radiation grazing the sample surface was previously observed on this instrument when measuring organic surfaces.
Figure 3.
8.0 – 10.5 eV LDPI-MS of neat trimethoprim. Includes (LD) direct ionization by laser desorption and (SB) synchrotron background at 10.5 eV. Known trimethoprim fragments indicated by asterisks.
Another spectral feature in the trimethoprim LDPI-MS of Figure 3 is an elevated baseline that appears as a step function following each peak in the mass spectra. This baseline step function results from the continuous ionization of slowly desorbing neutrals by the quasi-continuous wave VUV radiation. Shortening the extraction pulse is effective in reducing or eliminating this baseline, albeit at the expense of reduced sensitivity for higher m/z ions.
Any VUV radiation incident on metal electrodes in the ion extraction region produce photoelectrons that will be accelerated by electrostatic fields and potentially lead to electron ionization.21 Some of this contribution could arise as the SB signal discussed earlier, but photoelectron induced electron ionization appears minimal compared to the true photoionization signal.
B. Analysis of Biofilms Treated with Rifampicin Antibiotic
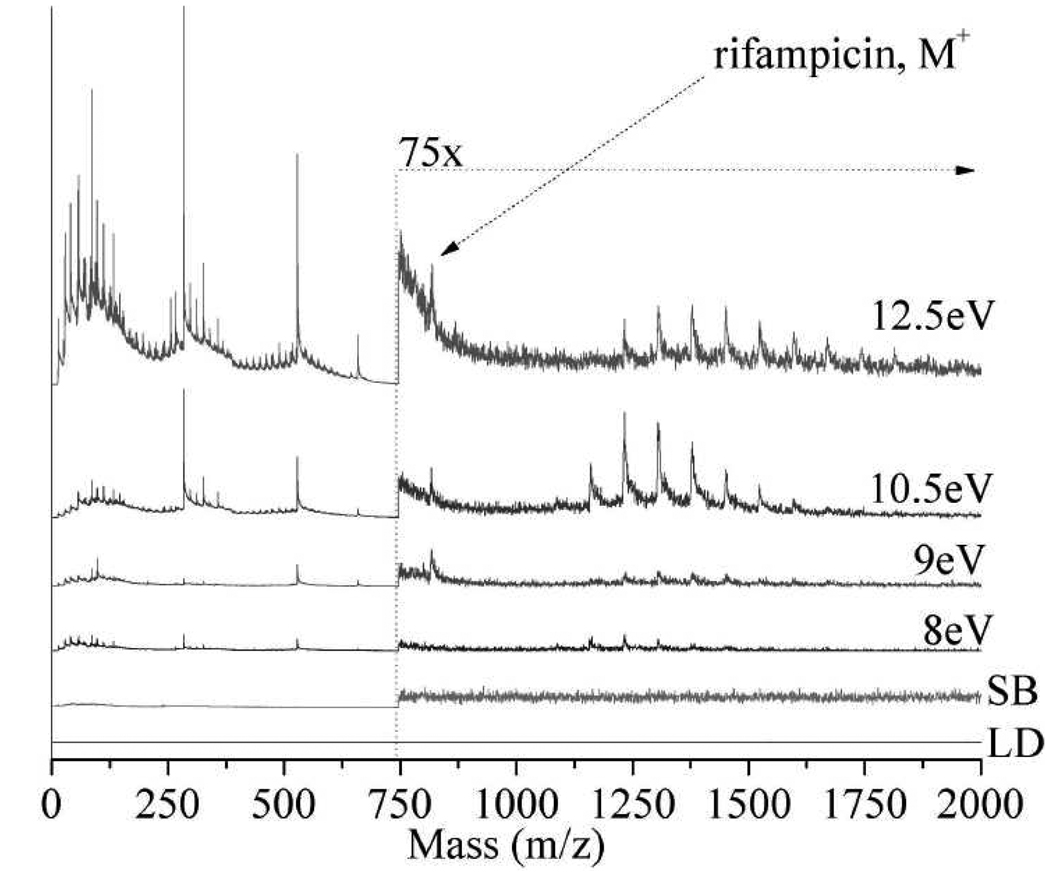
Figure 4 displays 8.0 – 12.5 eV LDPI-MS of drip flow biofilms grown on ITO glass and doped with 120 µM rifampicin. The parent ion of rifampicin appears at m/z 823 for 9.0, 10.5, and 12.5 eV photon energies, but is buried in the baseline at 8.0 eV. Lower intensity fragments observed in neat rifampicin, such as m/z 791, are buried in the baseline but the m/z 84 and 284 rifampicin fragment peaks remain visible. These mass ions are also observed from 7.87 eV LDPI-MS of biofilms and are thought to result from the desorption and ionization of a variety of low mass species.8,9,15,16 The higher peak intensities below m/z 200 at 12.5 eV photon energies is attributed to a loss of selective ionization and fragmentation, as discussed above for neat rifampicin.
Figure 4.
8.0 – 12.5 eV LDPI-MS of 120 µM rifampicin-treated biofilm. Includes (LD) direct ionization by laser desorption and (SB) synchrotron background at 12.5 eV.
A novel observation is that the rifampicin-treated biofilm spectra shown in Figure 4 display a polymeric series of peaks from ~m/z 1000 to 1800, with a consistent 74 Da mass separation. These polymeric peaks are observed at all photon energies, however the 10.5 eV LDPI-MS displays the best signal to noise ratio. The m/z values of the polymeric peaks do not vary with photon energy and while the low and high mass limits vary somewhat, they appear near m/z 1000 and 1800, respectively. No definitive identification of these polymeric peaks can be made with the current instrumentation, which like most imaging mass spectrometers, lacks exact mass and tandem mass spectrometric capabilities. However, by examining the literature and based upon the peak spacing of ~74 Da that is always observed in the polymeric distribution, a tentative assignment can be made to peptidoglycans from the antibiotic-degraded cell wall.
The cell wall is made up of an approximately 50 nm thick peptidoglycan layer alternating units of N-acetylmuramic acid and N-acetylglucosamine linked by β-1,4-glycosidic bonds forming these glycan chains and crossed-linked by pentaglycine.22 It is proposed that rifampicin lyses the cells leading to the release of peptidoglycan cell wall fragments with multiple strings of pentaglycine, which gives rise to the m/z 1000 – 1800 polymeric series of 5 to 15 peaks separated by ~74 Da observed in this work. The primary mode of action of rifampicin is inhibition of DNA and RNA synthesis.22 However, rifampicin has also been shown to effectively penetrate the thick extracellular polymeric substance that S. epidermidis microbes exude to anchor the biofilm.23 Furthermore, rifampicin deforms and/or lyses S. epidermidis cells in biofilms.24,25 Both processes are expected to result from cell wall degradation. Lysostaphin is an antimicrobial known to cleave the peptidoglycan crosslinking pentaglycine bridges of Staphylococcus aureus, thereby hydrolyzing the cell wall and lysing the bacteria.26 Rifampicin and lysostaphin displayed a similar ability to deform and/or lyse S. epiderimidis biofilms.25 Peptidoglycan fragments can be formed by autolysis or lysis of bacteria brought upon by specific antimicrobials.27 It follows that rifampicin might also cleave the pentaglycine bridges of the peptidoglycan cell wall of S. epidermidis, leading to the polymeric peak distribution observed here. The acetonitrile solvent used to dissolve the antibiotics can also contribute to cell lysis, but any such effect would have to be synergistic with that of rifampicin to play a role here.28
Several other assignments for the polymeric peak distribution are considered and excluded here. The polymeric series does not appear to result from adducts with rifampicin. Neither teichoic acid nor polysaccharides possess the required string of adjacent monomers to produce the ~74 Da mass separation between peaks.29 Inorganic species that could induce such a mass separation30 are also ruled out. First, the peak widths do not increase in width as would be expected with the addition of multiple KCl adducts due to the 35Cl and 37Cl isotopes. Second, adduction with Si(CH3)O from silicone in laboratory containers is ruled out by the appearance of the polymeric series only in the presence of rifampicin. Nevertheless, the assignment of the polymeric distribution to peptidoglycans is tentative and further work is underway to characterize the observed species by other methods. Two unidentified peaks at m/z 521 and 662 also appear in Figure 4, and are discussed in the next section.
Synchrotron background contribution becomes more apparent at 12.5 eV photon energies in the rifampicin treated biofilm spectrum of Figure 4, especially compared to that of the neat rifampicin spectrum of Figure 2. The greater noise level in the synchrotron background in the former is likely due to the photoionization of volatile species subliming from the biofilm. Laser desorption without any VUV again showed no significant ionization.
C. LDPI-MS Comparison of Biofilms with and without Antibiotic Treatment
Figure 5 displays LDPI-MS of a biofilm treated with 1.0 mM trimethoprim recorded at VUV photon energies of 8.0 and 10.5 eV. This trimethoprim-treated biofilm shows an eightfold enhancement of parent ion at m/z 290 when the photon energy is increased from 8.0 to 10.5 eV. Identifiable trimethoprim fragments observed from the biofilm include m/z 259 and 275, corresponding to losses of methylamide and methyl groups, respectively.
Figure 5.
8.0 and 10.5 eV LDPI-MS of 1.0 mM trimethoprim-treated biofilm. Includes direct ionization by laser desorption (LD) and synchrotron background at 10.5 eV (SB). Asterisks indicate known fragments.
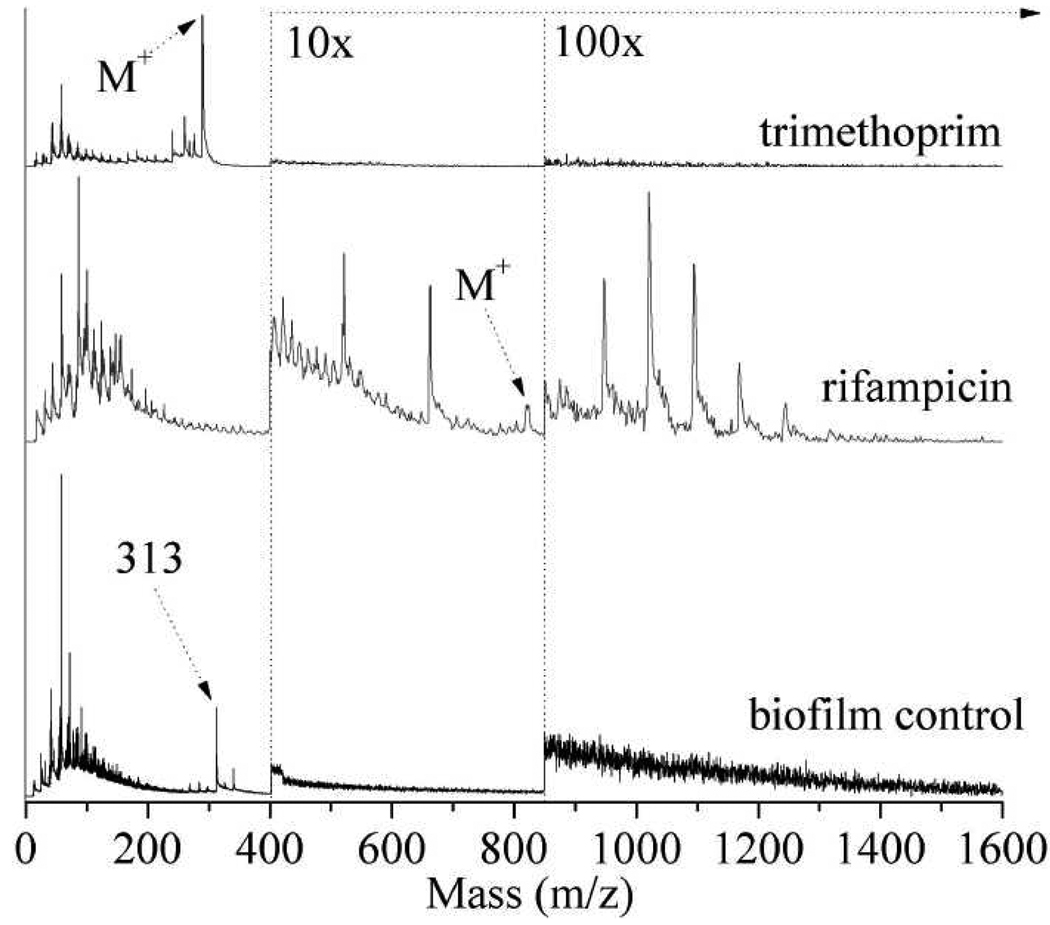
Figure 6 compares the 10.5 eV LDPI-MS of a trimethoprim-treated biofilm, a rifampicin-treated biofilm, and a control biofilm prepared without any antibiotic treatment. Neither the control biofilm without any antibiotic nor the trimethoprim-treated biofilm displayed the polymeric series of peaks observed above m/z 1000 in the presence of rifampicin (see prior section). Trimethoprim’s antibiotic activity results from its ability to inhibit metabolism of folic acid, which leads to disruption of DNA replication and cessation of cell growth.22 Thus, the release of peptidoglycans postulated above to explain the rifampicin-induced polymeric peak distribution is not expected for trimethoprim.
Figure 6.
10.5 eV LDPI-MS of 1.0 mM trimethoprim-treated biofilm, 120 µM rifampicin-treated biofilm, and biofilm control prepared without any antibiotic treatment.
Two unidentified peaks at m/z 521 and 662 appear in Figures 4 and 6 only in the presence of rifampicin in the biofilm, and these peaks are visible at all photon energies from 8 to 12.5 eV. However, these two peaks are not seen either in the trimethoprim-treated biofilm or the control biofilm at any photon energy. The prominence of these peaks in the presence of rifampicin implies they represent a specific induced response by the biofilm to rifampicin.
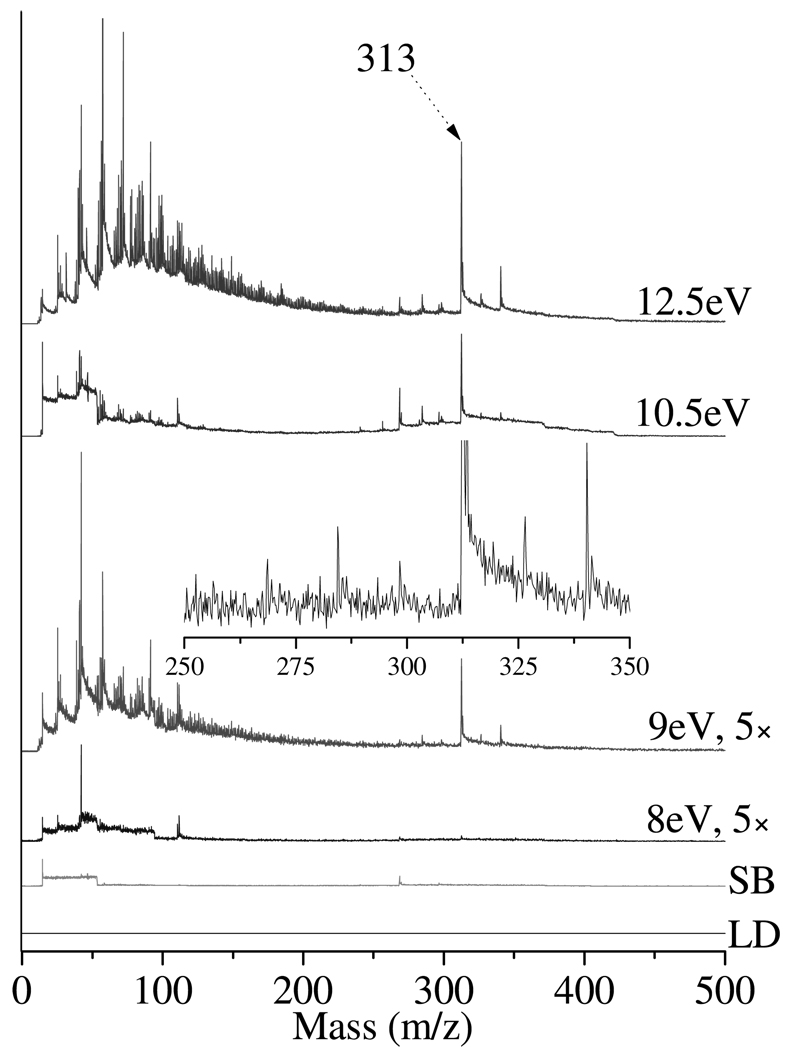
The 10.5 eV LDPI-MS of the control biofilm shown in Figure 6 (bottom) displays the presence of unidentified cellular material with a dominant peak at m/z 313. Figure 7 displays 8.0 – 12.5 eV LDPI-MS of the biofilm control prepared without any antibiotic treatment on ITO glass. The m/z 313 peak, the adjacent peak at m/z 340, and several others are observed even at 9.0 eV (see inset of Figure 7) and could derive from fragments of phospholipids.31 Increasing the photon energy to 10.5 and 12.5 eV leads to an increase in the intensity of peaks in this region, some potentially due to the detection of additional, as yet unidentified species. These peaks are not visible in either of the antibiotic doped biofilm spectra.
Figure 7.
8.0 – 12.5 eV LDPI-MS of control doped drip flow biofilm (no antibiotic). Includes direct ionization by laser desorption (LD, no VUV) and (SB) synchrotron background at 12.5 eV (no LD). Inset displays expanded m/z 250 – 350 region of 9.0 eV LDPI-MS, with m/z 313 peak truncated.
Abundant peaks are also observed in the biofilm control spectra below m/z 200, and these are most pronounced with 12.5 eV LDPI-MS. Similar low mass peak distributions are observed in neat rifampicin, rifampicin doped biofilm, and the trimethoprim doped biofilm. At 12.5 eV photon energies, ≥3.5 eV of excess energy is available to the parent ion to enhance dissociation. Thus, the increased number of peaks below m/z 200 can be attributed to enhanced parent ion dissociation as well as detection of intact high ionization energy species.
D. Laser Desorption Effects
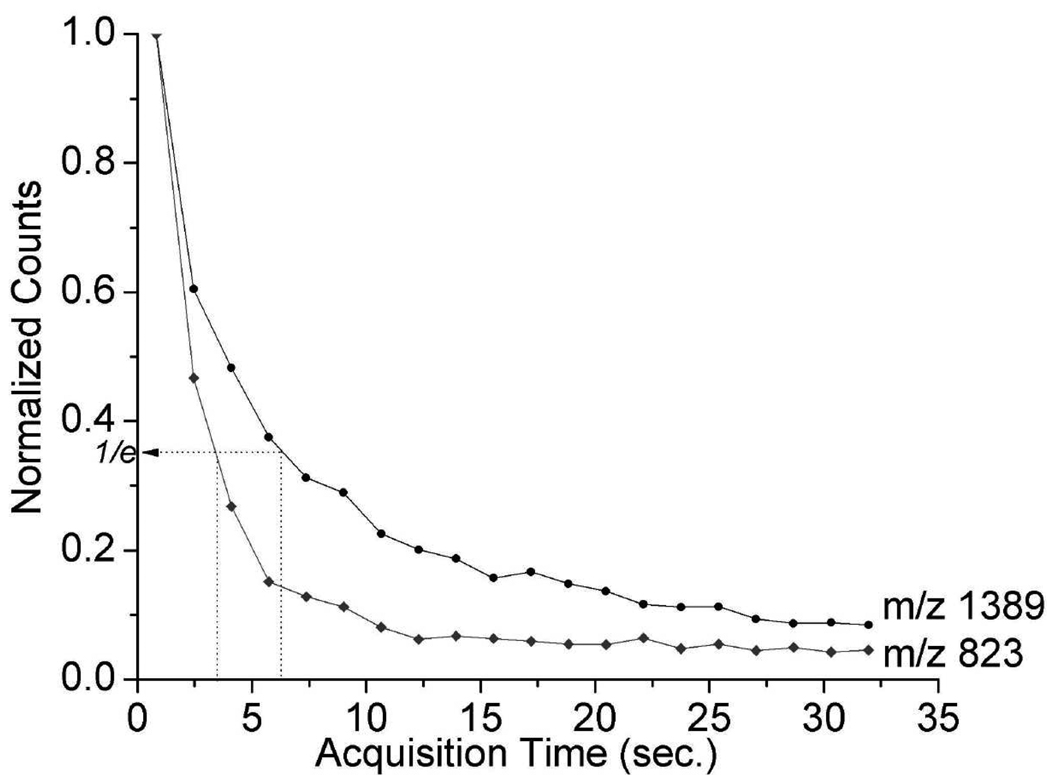
All spectra presented here are the sum of 143,000 individual mass spectra recorded from a single ~300 µm diameter spot on the sample. Concern regarding the potential exhaustion of analyte signal during such extended laser desorption led to collection of data presented in Figure 8, which displays the signal decay of two important peaks from the 10.5 eV LDPI-MS of a rifampicin-treated biofilm. The rifampicin parent peak (m/z 823) signal decays to 1/e of its original value within 8200 laser shots or ~3.3 seconds. An abundant polymeric series peak at m/z 1389 is also monitored in Figure 8 and displays a decay that is 75% longer than that of m/z 823. Approximately half of the total ion signal is accumulated within 3.3 seconds and ~90% of all ion signal is collected within 22 seconds. However, running the data collection for the full ~57 seconds slightly improves the signal to noise and compensates for different decay times between different ions. Examination of the spectra accumulated on a single spot for various time periods does not show any dramatic changes in the relative peak intensities.
Figure 8.
Normalized ion signal decay curves from rifampicin doped biofilm with 10.5 eV LDPI-MS for (top curve) the polymeric peak which appears at m/z 1389 and (bottom curve) the rifampicin parent ion peak which appears at m/z 823.
A complete study of sensitivity was not performed, but a rough estimate of limit of detection can be made. 50 µL of rifampicin doped onto the biofilm at 120 µM concentration deposits 6 nmoles of analyte onto the 1 cm2 ITO substrate. Under the current parameters a fixed desorption laser spot of 300 µm leaves a maximum of ~4 pmol of analyte available for analysis. If it is assumed that the analyte in this area is exhausted during an analysis and 55% of ion accumulation is reached at 1/e (see above), then it is possible to detect 2 pmol of analyte at 1/e.
The relatively defocused, extended laser desorption utilized here is in contrast to the more focused laser desorption previously reported for 7.87 eV LDPI-MS of biofilms.9 In the latter, the desorption laser was focused into a ~20 µm diameter spot on the sample and exhausted the analyte in <102 laser shots. Attempts in this study to increase the desorption efficiency by increasing the laser pulse energy only form more pyrolysis type peaks in the mass spectra, as typified by ion signal appearing at nearly every mass unit up to ~m/z 500 (data not shown).
IV. CONCLUSIONS
It has been shown that tunable VUV radiation can postionize laser desorbed neutrals of antibiotics and extracellular material from within intact bacterial biofilms. Much prior work has focused on the selectivity to species with low ionization energies that is afforded by single photon ionization with 7.87 eV photons,8,9,15,16 but the current work shows that higher photon energies dramatically improve sensitivity. Within the range of 8.0 – 12.5 eV, photon energies of 10.5 eV appear to provide the optimal balance between improved sensitivity and minimal fragmentation, at least for the biofilm-antibiotic combinations probed here. Furthermore, while 12.5 eV photons produce significant parent ion signal, signal for fragments and other low mass ions are also enhanced at this relatively high photon energy.
SIMS and MALDI-MS have been applied to imaging colonies of microbes4,6 and other work is underway to compare LDPI-MS to those methods. Nevertheless, the relatively low emitted ion/neutral ratios in SIMS and MALDI-MS9 argue for the use of postionization strategies to improve sensitivity and subsequent quantification.32 Single photon ionization with VUV radiation is one of several postionization strategies under investigation for imaging MS.11–14 An evaluation of the relative merits of these methods is required and comparison of LDPI-MS to secondary ionization mass spectrometry (SIMS) and secondary neutral mass spectrometry (SNMS) is currently underway. However, even a cursory evaluation indicates that different direct and postionization strategies often sample different chemical distributions. Furthermore, LDPI-MS has been shown to be competitive with other desorption/ionization methods,33 allowing detection of even high mass peptides.34 The results presented here indicate that VUV postionization can contribute new and useful analytical information in imaging MS. This conclusion seems especially valid when taking into account the shortcomings of the current LDPI-MS configuration necessitated by the use of synchrotron radiation. These shortcomings include relatively low VUV intensities and a mismatched duty cycle resulting from combining pulsed desorption with continuous wave VUV radiation for single photon ionization. However, new, higher photon energy pulsed VUV sources are being developed that should overcome these shortcomings in the future.8,9,35,36
Another point to consider in LDPI-MS is that no matrix addition or other pretreatment is required to facilitate successful analysis. However, the current size of the desorption beam is not ideal and may contribute to thermal desorption. Nevertheless, even with the large number of laser shots on the same sample spot used here, no sample degradation is apparent once the desorption laser power is optimized. However, work with 7.87 eV LDPI-MS8,9,15 indicates that higher pulse energies focused into smaller spots might prove advantageous by inducing a more ablative desorption event closer to that known to occur in matrix-assisted laser desorption ionization.37 Future improvements in focusing capabilities of the laser desorption apparatus at the synchrotron and rastering the sample stage for imaging mass spectrometry should provide a capability comparable to lab based sources. Furthermore, work on infrared laser desorption coupled with postionization of animal tissue13 and femtosecond ablation of biofilms38 imply that either matrix addition or other laser desorption schemes should be investigated to complement the techniques described here.
Several peaks are observed in the biofilm mass spectra presented here that remain unidentified, but their detection shows great potential for new discovery.6 The polymeric peaks tentatively assigned as peptidoglycan fragments can function as signaling molecules in cell–cell communication,27 as virulence factors,27 and can aid in biofilm formation.39 This potential ability to detect peptidoglycans within intact bacterial biofilms by LDPI-MS would be a useful new strategy for probing intercellular communication and interspecies interactions within biofilms.
ACKNOWLEDGMENTS
The authors acknowledge their ongoing collaboration with Ross Carlson of the Center for Biofilm Engineering at Montana State University (Bozeman, MT), who has freely provided his invaluable expertise on bacterial biofilms. This work is supported by the National Institute of Biomedical Imaging and Bioengineering via grant EB006532. MA, LT, JZ and the ALS are supported by the Director, Office of Energy Research, Office of Basic Energy Sciences, Chemical Sciences Division of the U.S. Department of Energy under contract No. DE-AC02-05CH11231. The contents of this manuscript are solely the responsibility of the authors and do not necessarily represent the official views of the National Institute of Biomedical Imaging and Bioengineering or the National Institutes of Health.
REFERENCES
- 1.Otto M. Nat. Rev. Microbiol. 2009;7:555. doi: 10.1038/nrmicro2182. [DOI] [PMC free article] [PubMed] [Google Scholar]
- 2.Stewart PS, Rayner J, Roe F, Rees WM. J. Appl. Microbiol. 2001;91:525. doi: 10.1046/j.1365-2672.2001.01413.x. [DOI] [PubMed] [Google Scholar]
- 3.Sousa C, Teixeira P, Oliveira R. J. Basic Microbiol. 2009;49:363. doi: 10.1002/jobm.200800196. [DOI] [PubMed] [Google Scholar]
- 4.Tyler BJ, Rangaranjan S, Möller J, Beumer A, Arlinghaus HF. Appl. Surf. Sci. 2006;252:6712. [Google Scholar]
- 5.Vaidyanathan S, Fletcher JS, Goodacre R, Lockyer NP, Micklefield J, Vickerman JC. Anal. Chem. 2008;80:1942. doi: 10.1021/ac701921e. [DOI] [PubMed] [Google Scholar]
- 6.Esquenazi E, Yang Y-L, Watrous J, Gerwick WH, Dorrestein PC. Nat. Prod. Rep. 2009;26:1521. doi: 10.1039/b915674g. [DOI] [PubMed] [Google Scholar]
- 7.Watrous J, Hendricks N, Meehan M, Dorrestein PC. Anal. Chem. 2010;82:1598. doi: 10.1021/ac9027388. [DOI] [PMC free article] [PubMed] [Google Scholar]
- 8.Hanley L, Zimmermann R. Anal. Chem. 2009;81:4174. doi: 10.1021/ac8013675. [DOI] [PMC free article] [PubMed] [Google Scholar]
- 9.Akhmetov A, Moore JF, Gasper GL, Koin PJ, Hanley L. J. Mass Spectrom. 2010;45:137. doi: 10.1002/jms.1716. [DOI] [PMC free article] [PubMed] [Google Scholar]
- 10.Heeren RMA, Smith DF, Stauber J, Kükrer-Kaletas B, MacAleese L. J. Amer. Soc. Mass Spectrom. 2009;20:1006. doi: 10.1016/j.jasms.2009.01.011. [DOI] [PubMed] [Google Scholar]
- 11.Kriegeskotte C, Cantz T, Haberland J, Zibert A, Haier J, Köhler G, Schöler HR, Schmidt HHJ, Arlinghaus HF. J. Mass Spectrom. 2009;44:1417. doi: 10.1002/jms.1634. [DOI] [PubMed] [Google Scholar]
- 12.Willingham D, Brenes DA, Wucher A, Winograd N. J. Phys. Chem. C. 2009;114:5391. doi: 10.1021/jp9054632. [DOI] [PMC free article] [PubMed] [Google Scholar]
- 13.Nemes P, Woods AS, Vertes A. Anal. Chem. 2010;82:982. doi: 10.1021/ac902245p. [DOI] [PMC free article] [PubMed] [Google Scholar]
- 14.Galhena AS, Harris GA, Nyadong L, Murray KK, Fernandez FM. Anal. Chem. 2010;82:2178. doi: 10.1021/ac902905v. [DOI] [PubMed] [Google Scholar]
- 15.Gasper GL, Carlson R, Akhmetov A, Moore JF, Hanley L. Proteom. 2008;8:3816. doi: 10.1002/pmic.200701142. [DOI] [PMC free article] [PubMed] [Google Scholar]
- 16.Edirisinghe PD, Moore JF, Skinner-Nemec KA, Lindberg C, Giometti CS, Veryovkin IV, Hunt JE, Pellin MJ, Hanley L. Anal. Chem. 2007;79:508. doi: 10.1021/ac0615605. [DOI] [PubMed] [Google Scholar]
- 17.Takahashi LK, Zhou J, Wilson KR, Leone SR, Ahmed M. J. Phys. Chem. A. 2009;113:4035. doi: 10.1021/jp810408v. [DOI] [PubMed] [Google Scholar]
- 18.Zhou J, Takahashi LK, Wilson KR, Leone SR, Ahmed M. Anal. Chem. 2010;82:3905. doi: 10.1021/ac1004629. [DOI] [PubMed] [Google Scholar]
- 19.Heimann PA, Koike M, Hsu CW, Blank D, Yang XM, Suits AG, Lee YT, Evans M, Ng CY, Flaim C, Padmore HA. Rev. Sci. Instrum. 1997;68:1945. [Google Scholar]
- 20.Xu KD, Stewart PS, Xia F, Huang CT, McFeters GA. Appl. Environ. Microbiol. 1998;64:4035. doi: 10.1128/aem.64.10.4035-4039.1998. [DOI] [PMC free article] [PubMed] [Google Scholar]
- 21.Gamez G, Zhu L, Schmitz TA, Zenobi R. Anal. Chem. 2008;80:6791. doi: 10.1021/ac8007187. [DOI] [PubMed] [Google Scholar]
- 22.Walsh C. Antibiotics: Actions, Origins, Resistance. Washington, D.C.: ASM Press; 2003. [Google Scholar]
- 23.Zheng Z, Stewart PS. Antimicrob. Agents Chemother. 2002;46:900. doi: 10.1128/AAC.46.3.900-903.2002. [DOI] [PMC free article] [PubMed] [Google Scholar]
- 24.Richards GK, Prentis J, Gagnon RF. Adv. Perit. Dial. 1989;5:133. [PubMed] [Google Scholar]
- 25.Liang X, Wang A, Cao T, Tang H, McAllister JP, II, Salley SO, Ng KYS. J. Biomed. Mater. Res. A. 2006;76:580. doi: 10.1002/jbm.a.30559. [DOI] [PubMed] [Google Scholar]
- 26.Kumar JK. Appl. Microbiol. Biotechnol. 2008;80:555. doi: 10.1007/s00253-008-1579-y. [DOI] [PubMed] [Google Scholar]
- 27.Cloud-Hansen KA, Peterson SB, Stabb EV, Goldman WE, McFall-Ngai MJ, Handelsman J. Nat. Rev. Microbiol. 2007;4:710. doi: 10.1038/nrmicro1486. [DOI] [PubMed] [Google Scholar]
- 28.Rais R, Gonzalez PM, Zheng X, Wring SA, Polli JE. AAPS J. 2008;10:596. doi: 10.1208/s12248-008-9069-9. [DOI] [PMC free article] [PubMed] [Google Scholar]
- 29.Swoboda JG, Campbell J, Meredith TC, Walker S. ChemBioChem. 2010;11:35. doi: 10.1002/cbic.200900557. [DOI] [PMC free article] [PubMed] [Google Scholar]
- 30.Tong H, Bell D, Tabei K, Siegel MM. J. Amer. Soc. Mass Spectrom. 1999;10:1174. [Google Scholar]
- 31.Goodacre R, Heald JK, Kell DB. FEMS Microbiol Lett. 1999;176:17. [Google Scholar]
- 32.Adam T, Zimmermann R. Anal. Bioanal. Chem. 2007;389:1941. doi: 10.1007/s00216-007-1571-x. [DOI] [PubMed] [Google Scholar]
- 33.Siegal MM, Tabei K, Tsao R, Pastel MJ, Pandey RK, Berkenkamp S, Hillenkamp F, de Vries MS. J. Mass Spectrom. 1999;34:661. doi: 10.1002/(SICI)1096-9888(199906)34:6<661::AID-JMS818>3.0.CO;2-I. [DOI] [PubMed] [Google Scholar]
- 34.Marksteiner M, Haslinger P, Sclafani M, Ulbricht H, Arndt M. J. Phys. Chem. A. 2009;113:9952. doi: 10.1021/jp905039f. [DOI] [PubMed] [Google Scholar]
- 35.Heinbuch S, Grisham M, Martz D, Rocca JJ. Opt. Express. 2005;13:4050. doi: 10.1364/opex.13.004050. [DOI] [PubMed] [Google Scholar]
- 36.Chen M-C, Gerrity MR, Backus S, Popmintchev T, Zhou X, Arpin P, Zhang X, Kapteyn HC, Murnane MM. Optics Express. 2009;17:17376. doi: 10.1364/OE.17.017376. [DOI] [PubMed] [Google Scholar]
- 37.Knochenmuss R, Zhigilei LV. J. Mass Spectrom. 2010;45:333. doi: 10.1002/jms.1732. [DOI] [PubMed] [Google Scholar]
- 38.Milasinovic S, Liu Y, Gasper GL, Zhao Y, Johnston JL, Gordon RJ, Hanley L. J. Vac. Sci. Technol. A. 2010;28:647. doi: 10.1116/1.3397736. [DOI] [PMC free article] [PubMed] [Google Scholar]
- 39.Shank EA, Kolter R. Curr. Opin. Microbiol. 2009;12:205. doi: 10.1016/j.mib.2009.01.003. [DOI] [PMC free article] [PubMed] [Google Scholar]


