

Abstract
This Point/Counterpoint presents a scholarly debate of the mechanisms underlying the electrocardiographic and arrhythmic manifestations of Brugada syndrome (BrS), exploring in detail the available evidence in support of the repolarization vs. depolarization hypothesis.
Introduction
In this Point/Counterpoint we will, after a short introduction, discuss our views on the pathophysiological mechanism behind the electrocardiographic signature of Brugada syndrome. Brugada syndrome is characterized by specific ST segment changes in the right precordial ECG leads known as the type-1 or coved-type Brugada ECG. It shows familial segregation and is associated with malignant arrhythmias which may lead to sudden death [1,2]. As with other inheritable arrhythmia syndromes, there is large variability in phenotype among patients. Fortunately, most patients with the signature type-1 ECG and several other criteria [2] do not develop arrhythmias throughout life when they refrain from certain drugs and fever is immediately treated [2–6]. Nevertheless, a substantial number of patients with Brugada syndrome may indeed die suddenly or experience multiple arrhythmia episodes. Hence, it is critical to understand the pathophysiological mechanism behind this syndrome, so as to enable better risk stratification for sudden death, timely treatment, and prevention of sudden death.
However, the pathophysiological mechanism of Brugada syndrome (let alone risk stratification) remains a matter of debate [7,8]. Although there seems to be consensus on a right ventricular origin and on the positive association between the type-1 ECG and arrhythmias, the underlying mechanisms are, in our view still, not very clear. We will discuss the two leading hypotheses. The ‘repolarization hypothesis’ on one hand was initiated by studies in canine wedge preparations [9]. This hypothesis relies on transmural dispersion of repolarization between the right ventricular (outflow tract) endocardium and epicardium. In contrast, the ‘depolarization hypothesis’ relies on RV conduction slowing and involvement of (mild) structural abnormalities [8]. Certainly, these hypotheses are not mutually exclusive and ongoing research will give better and/or new insights in the (near) future.
Point Wilde/Postema
Conduction delay
Conduction delay as part of the clinical presentation of Brugada syndrome, i.e. right bundle branch block and prolonged HV-intervals, was already described in the first report on Brugada syndrome [1]. Most evidence in favor of right ventricular conduction delay as part of the pathophysiology mechanism behind Brugada syndrome is derived from clinical studies. In these studies, body surface, epicardial and endocardial mapping, electrophysiological studies as well as cardiac imaging consequently point to conduction delay as a prominent feature of the type-1 ECG and being most evident in the right ventricle [10–19]. Provocation tests with sodium channel blockers (e.g. ajmaline or flecainide), used to uncover the type-1 ECG, also evoke severe conduction slowing in atria and ventricles while the type-1 ECG develops [20–24]. Conduction slowing by reduced sodium current induced by sodium channel blockers and its relation to Brugada syndrome is furthermore mirrored in the association between Brugada syndrome and loss-of-function mutations in SCN5a (the gene that encodes for the α-subunit of the cardiac sodium channel) [25,26]. Also, late potentials, which reflect delayed and discontinuous ventricular depolarization, have often been observed. These late potentials have been associated with the development of arrhythmias and can be uncovered or become more pronounced when sodium channel blockers are introduced to unmask a type-1 Brugada ECG [13,16,19,27]. Further, slowed and discontinuous conduction were found in computer models simulating decreased sodium current.[28]
Structural abnormalities
In conjunction with the observed right ventricular conduction delay as part of the manifestation of the type-1 ECG and arrhythmias, there is growing evidence for structural abnormalities as part of the syndrome. This notwithstanding, there is an obligatory absence of gross structural abnormalities [2]. Right from the first reports of Brugada syndrome it was described that there were no apparent signs of ischemia, infarction or scar, right ventricular cardiomyopathy, hypertrophic or dilated cardiomyopathy or other forms of structural heart disease [1]. However, from earlier and later publications the notion appears that there might indeed be structural changes involved, albeit relatively mild changes which may not become evident using conventional cardiac imaging modalities (echocardiography, magnetic resonance imaging). In an explanted heart and in right ventricular biopsies it was found that structural abnormalities (fibrosis, myocarditis, apoptosis) were present [14,29]. These findings are in concordance with the observed late potentials and fragmented electrograms which reflect discontinuous conduction through diseased myocardium [13,15,19,27,30].
Substantial overlap with clear structural cardiac disease such as (familial) arrhythmogenic cardiomyopathy may thus be suspected [10]. Also, there may be support for both a congenital (familial) and an acquired form of Brugada syndrome. The latter is for example supported by the observation of type-1 ECGs provoked by ajmaline in Chagas’ disease which involves myocarditis [31]. In contrast, the former is supported by the association between loss-of-function mutations in SCN5a with Brugada syndrome and (RV) structural abnormalities in both human and mice [25,32,33]. Structural abnormalities may also lead to conduction slowing itself and SCN5a loss-of-function mutations may provoke decreased excitability and hampered conduction through decreased connexin expression [33,34]. Although mutations which lead to dysfunctional or less sodium channels at the cellular membrane are only found in approximately 10 to 30% of Brugada syndrome patients, it appears that decreased sodium channel expression is just as apparent in Brugada syndrome patients with a sodium channel mutation as in those without a sodium channel mutations [35]. Likewise, it has recently been noted that SCN5A mutations may not be directly causal to the occurrence of Brugada syndrome and that genetic background may play a powerful role in its pathophysiology.[36]
As far as arrhythmias are concerned, in general these surface in the third or fourth decade of life. This advocates that there is a time dependent process that either is acquired later in life or that takes many years to eventually trigger the arrhythmias or to constitute a sufficient arrhythmogenic substrate. The development of structural abnormalities could be such a process [33]. When this occurs, the effects of reduction in wave length due to conduction slowing are exacerbated by augmented anisotropy and discontinuous conduction due to decreased sodium current and the interstitial changes. Conduction block, reentry and wave break will be promoted, and may be the elements to cause arrhythmias. In this concept, tissue discontinuities are required, and may already be relevant when relatively mild, because they conspire with functional impairments, e.g., loss-of-function SCN5a-mutations, decreased sodium channel function or expression, with or without mutations in modifying genes[37] and/or environmental stressors such as sodium channel blocking drugs,[2,21] vagal stimulation[13] or fever [38].
Repolarization hypothesis
Along with these arguments in favor of the ‘depolarization hypothesis’, there are also arguments against the ‘repolarization hypothesis’. The main argument being that if there would be transmural dispersion of repolarization at the time of a type-1 ECG to an extent as de canine wedge preparations show, this would indeed be extremely arrhythmogenic. This arrhythmogenicity of the transmural dispersion of repolarization is also always found in the canine wedges [7,9]. However, although the type-1 ECG is indeed associated with arrhythmias, most patients do not have any arrhythmias throughout their life although they show a constant or intermittent type-1 ECG. Also when a type-1 ECG is evoked by drugs, the occurrence of arrhythmias is rare. Furthermore, such transmural dispersion of repolarization would require complete uncoupling of endocardium and epicardium,[30] which in our view is not physiological possible in the human heart. Hence, conduction slowing and mild structural abnormalities seem to be a more logical substrate for arrhythmias to develop.
Type-1 ECG
While RV conduction slowing seems to be part of the signature ECG of Brugada syndrome, how can it cause that signature ECG? We have earlier advocated that conduction slowing in the RV will result in very late activation of the RV outflow tract (RVOT, figure 1A) [8]. The RVOT action potential (Fig. 1B, top) is thus delayed with respect to other RV action potentials (figure 1B, bottom). During the hatched phase of the cardiac cycle in figure 1D, the membrane potential in the RV is more positive than in RVOT, thus acting as a source, and driving intercellular current to RVOT, which acts as a sink (Fig. 1C, a). To ensure a closed-loop circuit, current passes back from RVOT to RV in the extracellular space (figure 1C, c), and an ECG electrode positioned over the RVOT (V2 in the 3rd intercostal space for example) inscribes a positive signal, as it records the limb of this closed-circuit which travels towards it (figure 1C, b). Thus, this electrode inscribes ST elevation during this phase of the cardiac cycle (figure 1D, bottom, bold line). Reciprocal events are recorded in the left precordial leads, as demonstrated using BSM [18]. Here, current flowing from the extracellular space into RV (figure 1C, d) causes ST depression. In the next phase of the cardiac cycle (following the upstroke (figure 1F, hatched phase) of the delayed action potential in RVOT), the potential gradients between RV and RVOT are reversed, as membrane potentials are now more positive in RVOT than RV. Thus, the RVOT now acts as the source, driving the closed-loop circuit in the opposite direction (figure 1E), with current now passing away from the right precordial lead (figure 1E, d), thus resulting in the negative T-wave (figure 1F, bottom, bold line). Note that in figure 1D and 1F, the delayed action potential of the RVOT is abbreviated in comparison to other RV action potentials (and in comparison to figure 1B, where action potentials of isolated cells are shown). As there is electrotonic interaction between RV and RVOT (which is present when the RV and RVOT are electrically well-coupled) the severe conduction delay in the RVOT will accelerate repolarization of RVOT action potential [39].
Figure 1.

Qualitative model of the depolarization hypothesis for the Type-1 Brugada syndrome ECG. For explanation, see text. Modified from Ref. [8] with permission.
Electrotonic interaction
This scheme directly shows overlap between the repolarization model and the depolarization model: the existence of shortened action potentials in the RVOT either being due to severe conduction delay or due to principal repolarization differences between RVOT endocardium and RVOT epicardium. There is even a third way that may result in ST elevation associated with Brugada syndrome: excitation failure resulting from small structural barriers [40]. Interestingly, in a simulation study (incorporating transmural differences in the density of the transient outward current) shorter action potentials arise in those areas directly surrounding the structural barriers, also believed to be due to electrotonic interaction between excited and unexcited areas [40,41]. Hence, the principal difference between the repolarization and depolarization hypothesis regarding shortening of action potentials, is whether it’s a primary or secondary process. We believe it’s the latter, a secondary process, simply the result of conduction abnormalities possibly augmented by structural discontinuities, just as the Type-1 ECG.
Counterpoint Antzelevitch/Di Diego/Viskin/Morita/Fish
We will attempt to address the major points raised by Wilde and Postema in this Counterpoint. It is correct that conduction delay was part of the clinical presentation of Brugada syndrome; indeed, RBBB was an integral part of the name ascribed to this new clinical entity [1]. However, a rigorous application of simple electrocardiographic criteria, long-used to define RBBB,[42] reveals that a large majority of RBBB-like morphologies encountered in cases of Brugada syndrome do not fit the criteria for RBBB [42]. Moreover, attempts by Miyazaki and coworkers to record delayed activation of the RV in Brugada patients met with failure [43]. The absence of any semblance of an S wave in the left precordial leads in many BrS patients exhibiting a typical Type 1 ST-segment elevation strongly suggests that the r’, J wave or ST segment elevation is due to the presence of a prominent notch in epicardium but not endocardium in the region of the RVOT, rather than to a delay of conduction (see [7] for review) (Figure 2). The only clinical study that endeavored to record monophasic action potentials (MAP) from both epicardial and endocardial surfaces of the right ventricular outflow tract (RVOT) of patients with the Brugada syndrome provides further direct support for this hypothesis, demonstrating deeply notched action potentials in the RV epicardium of BrS patients, but not in endocardium; on the other hand, no major conduction delays were observed in the RVOT.[44,45]
Figure 2.
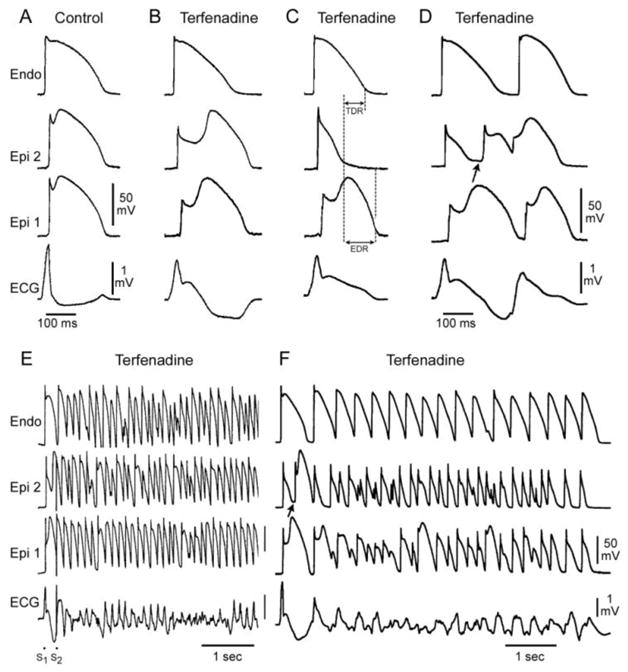
Cellular basis for electrocardiographic and arrhythmic manifestation of BrS. Each panel shows transmembrane action potentials from one endocardial (top) and two epicardial sites together with a transmural ECG recorded from a canine coronary-perfused right ventricular wedge preparation. A: Control (Basic cycle length (BCL) 400 msec). B: Combined sodium and calcium channel block with terfenadine (5 μM) accentuates the epicardial action potential notch creating a transmural voltage gradient that manifests as a ST segment elevation or exaggerated J wave in the ECG. Despite the appearance of a typical BrS ECG, an arrhythmogenic substrate is absent. C: Continued exposure to sodium and calcium blockade results in all-or-none repolarization at the end of phase 1 at some epicardial sites but not others, creating a local epicardial dispersion of repolarization (EDR) as well as a transmural dispersion of repolarization (TDR). D: Phase 2 reentry occurs when the epicardial action potential dome propagates from a site where it is maintained to regions where it has been lost giving rise to a closely coupled extrasystole. E: Extrastimulus (S1–S2 = 250 msec) applied to epicardium triggers a polymorphic VT. F: Phase 2 reentrant extrasystole triggers a brief episode of polymorphic VT. (Modified from [48] with permission)
The repolarization hypothesis was developed based on experimental data generated by models that closely recapitulate the clinical electrocardiographic and arrhythmic manifestation of BrS,[7,9,46–50] as in the example illustrated in Figure 2. It is noteworthy that there is no such experimental model for the BrS depolarization hypothesis, only theoretical armchair and mathematical models for the ECG manifestations of BrS that make assumptions that are open to question (discussed below) and there are no experimental models that we are aware of for the very rapid polymorphic VT (PVT) characteristic of BrS based on the depolarization hypothesis. Indeed, because of the exquisite rate-dependence of conduction, PVT is unlikely to develop when major conduction delays are present at baseline.
Wilde and Postema raise as a chief argument against the repolarization hypothesis the fact that “if there would be transmural dispersion of repolarization at the time of a type-1 ECG to an extent as the canine wedge preparations show, this would indeed be extremely arrhythmogenic.” They correctly point out that most patients do not have any arrhythmias throughout their life although they show a constant or intermittent type-1 ECG. Interestingly, we view this point as a strong argument in favor of the repolarization hypothesis, but against the depolarization hypothesis. As we have repeatedly stressed, with the repolarization hypothesis a typical BrS ECG may be generated without an arrhythmogenic substrate, as illustrated in Fig. 2. Fig. 2B shows the development of a coved type ST segment following exposure of the canine coronary-perfused right ventricular wedge preparation to combined sodium and calcium channel block. Despite the classical BrS ECG, no transmural dispersion of repolarization or any other arrhythmogenic substrate is present. The arrhythmogenic substrate develops when a further shift in the balance of current in the early phases of the action potentials leads to loss of the action potential dome at some epicardial sites but not others (Fig. 2C) resulting in the development of an epicardial dispersion of repolarization, which gives rise to a closely coupled phase 2 reentrant extrasystole. Loss of the dome also results in a marked transmural dispersion of repolarization and refractoriness, creating a vulnerable window during which the closely coupled extrasystole can induce a reentrant arrhythmia. (Fig. 2F). Note that despite the potent block of both sodium and calcium channel currents (the most prevalent genetic defects associated with BrS), conduction is little affected relative to the marked changes in repolarization characteristics. Also noteworthy is the fact that the repolarization hypothesis provides an explanation for both substrate (dispersion of repolarization) and trigger (Phase 2 reentry) underlying the development of PVT. The depolarization hypothesis cannot account readily for the very closely coupled extrasystoles that often precipitate PVT.
The second argument leveled against the repolarization hypothesis is that “such transmural dispersion of repolarization would require complete uncoupling of endocardium and epicardium,[30] which in our view is not physiological possible in the human heart.” We are at a loss to understand this argument since all models of BrS developed, including the one cited, have demonstrated the development of major dispersion of repolarization with relatively little or no slowing of conduction, suggesting that such repolarization heterogeneity can occur without any loss of cellular coupling between epicardium and endocardium.
The issue of structural changes associated with BrS is an important one, but one also mired in debate. Because of space constraints, we will not pursue this here in that it is amply discussed in a variety of reviews (e.g., [7,51]). The most recent study on the subject concluded that only a small subset of BrS patients display significant histopathological abnormalities in biopsy samples of the RVOT that could be linked to the ECG phenotype [52]. Suffice it to say that some cases BrS may be associated with a mild fibrosis or other structural changes.
We disagree with the premise that late potentials or wall motion abnormalities in BrS patients necessarily denote the presence of structural changes and conduction delays. Signal averaged ECG (SAECG) recordings have demonstrated late potentials in patients with the Brugada syndrome, especially in the anterior wall of the right ventricular outflow tract (RVOT) [16,27,53–57]. Although traditionally ascribed to conduction delays, in cases of BrS these late potentials could arise from the delayed second upstroke of the epicardial action potential in the RVOT or to a concealed phase 2 reentry [7,53]. Wall motion abnormalities have also been detected in BrS patients [58]. Although such contractile abnormalities are commonly considered pathognomonic of structural disease, in case of BrS syndrome they could well be the result of loss of the action potential dome in the right ventricular epicardium [53,59]. Loss of the dome would lead to contractile dysfunction because calcium entry into the cells would be greatly diminished and sarcoplasmic reticulum calcium stores would be depleted.
We have previously suggested that the rate-dependence of the ST segment elevation in BrS may be helpful in discriminating between the repolarization and depolarization hypotheses [7]. If the ST segment elevation is due predominantly to delayed conduction in the RVOT, acceleration of the rate would be expected to further aggravate conduction and thus accentuate the ST segment elevation and the RBBB morphology of the ECG. If, on the other hand, ST segment elevation or BrS sign is secondary to accentuation of the epicardial action potential notch, acceleration of the rate would be expected to normalize the ECG, by reducing the action potential notch and restoring the action potential dome in RV epicardium. This occurs because the transient outward current, which is at the heart of this mechanism, is slow to recover from inactivation and is less available at faster rates. Although there are relatively few reports of the effects of pacing, most investigators in the field agree that there is a tendency for the Brugada ECG to normalize during an increase in heart rate consistent with the repolarization hypothesis.[60–62] There are however also reports of ST segment elevation or J point elevation with exercise. Amin et al. recently reported J point elevation in BrS patients (both SCN5A+ and SCN5A-) during exercise.[63] The principal difference between studies showing a decrease vs. increase of the J point in response to exercise appears to be the presence of a prominent ST segment elevation at baseline in the former.
Fig. 3 shows the effect of exercise on a 12 lead ECG of a 33 years old asymptomatic BrS male with a family history of SCD and a loss of function SCN5A missense mutation (R878C). At baseline all three right precordial leads displayed a marked ST segment elevation and V3 displayed a notched QRS suggesting major conduction delay in the RVOT. Interestingly, the conduction defect was exaggerated during exercise as evidenced by the further fragmentation of the QRS in V3, but despite this the ST segment elevation in all right precordial leads was reduced. These findings suggest that the ST segment elevation is due to a repolarization defect and not to the clearly apparent depolarization defect.
Figure 3.

Opposite effects of exercise on QRS fragmentation and ST segment elevation in right precordial leads of a 33 year old asymptomatic male with Brugada syndrome secondary to a loss of function SCN5A missense mutation (R878C).
Additional support for the repolarization hypothesis derives from the demonstration that quinidine normalizes ST segment elevation and suppresses late potentials recorded in patients with Brugada syndrome [64–67]. These effects of the drug are presumably due to inhibition of Ito leading to diminution of the epicardial action potential notch and normalization of the repolarization heterogeneities. If the ST segment elevation or the late potentials were due to delayed conduction, quinidine-induced INa inhibition would be expected to accentuate their appearance.
Although there is no experimental model of BrS based on the depolarization hypothesis, we have developed a model of ischemia-induced changes, which corresponds to what has been proposed as the depolarization hypothesis.[67,68] Fig. 4 illustrates the development of a very significant transmural delay as a consequence of exposure of ventricular wedge preparation to global ischemia. Progressive delay leads to a gradual prolongation of the R wave and inversion of the T wave. The ECG at first glance resembles a BrS phenotype, but with closer inspection it is clear that the depolarization hypothesis does not lead to an ST segment elevation, but rather to an R wave prolongation. Fig 4B shows that the marked conduction delay is due to a discontinuity in conduction in the deep subepicardium. Conduction under these conditions is exquisitely sensitive to rate, with acceleration leading to block and inexcitability. Fig. 4B shows that with continued ischemia the R wave prolongs and 2:1 conduction block develops. This causes disappearance of the T wave in alternate beats, which is generally not observed in BrS, but is a common characteristic of ischemia-induced tombstone morphology of the ECG, induced by coronary spasm, as illustrated in Fig. 4C.[69] A similar phenomenon is observed in right ventricular wedge preparations following exposure to hyperkalemic conditions [70]. Our data suggest that reduced INa availability in ventricular epicardium contributes to its greater sensitivity to electrical depression under a variety of clinical conditions including acute myocardial ischemia and severe hyperkalemia, predisposing to reduced excitability, slowed transmural conduction, which is responsible for dramatic prolongation of the R wave.
Figure 4.

Electrophysiologic effect of ischemia in the ventricular wedge model. A: Each panel shows (from top to bottom) simultaneous recordings of transmembrane action potentials from endocardium (Endo) and epicardium (Epi) and the ECG recorded across the bath along the same axis. Recordings were obtained from a RV wedge displaying a relatively small phase 1 in the epicardial action potential under control conditions, following 10 and 25 min of no-flow ischemia, and 1 and 40 min of reperfusion. Progressive ischemia-induced delay of transmural conduction leads to a gradual prolongation of the R wave (apparent ST-segment elevation) and inversion of the T wave. B: Recordings obtained at 25–30 min of no-flow ischemia (BCL=800 msec). From top to bottom: Five unipolar electrograms (EGs) recorded between endocardium and epicardium (Endo, M3, M2, M1 and Epi), Endo action potential, Epi action potential and a transmural electrocardiogram (ECG). A 90 msec-step delay (discontinuous conduction) in transmural conduction occur between EG-M2 and EG-M1 giving rise to a prolonged R wave (tombstone morphology) and negative T wave in the ECG of alternate beats. 2:1 intramural conduction block occurs at site EG-M2 leads a disappearance of the ECG-T wave, which is concurrent with the absence of the Epi AP response. Arrows denote the activation time at each of the unipolar electrograms. C: Shown side-by side are recording from arterially-perfused right ventricular wedge preparation following 25–30 min of ischemia (BCL=800 msec)(Left) and an example of the tombstone effect and T wave alternans appearing in the right precordial leads following vasospastic ischemia as well as normalization of the ECG following spontaneous reperfusion. (Panels A, B and the left part of panel C are modified from [67] and right part of panel C is from Childers [69], with permission).
Thus, the available data, both basic and clinical, point to the repolarization hypothesis, i.e., transmural voltage gradients that develop secondary to accentuation of the epicardial notch, at times leading to loss of the action potential dome, as the predominant mechanism underlying the Brugada syndrome ECG signature and arrhythmogenesis. There is no doubt in our minds that in some cases, particularly those associated with sodium channel loss of function, conduction slowing may contribute to the development of arrhythmias. It is our view, however, that conduction slowing or structural defects are by no means obligatory.
Rebuttal Wilde &Postema
In this rebuttal we aim to address the concerns raised by Antzelevitch et al. about the depolarization hypothesis and to react to the points raised in favor of the repolarization hypothesis.
RBBB and terminal right ventricular delay
We agree that RBBB is not the hallmark of the syndrome as our colleagues argued [42]. The wide S-wave in infero-lateral leads does not represent a typical RBBB morphology but represents conduction delay in the RVOT [8]. This is supported by vigorous electrocardiographic studies on the location of the conduction delay in BrS which occurs in the final not the first part of the QRS complex [19]. There are indeed studies which do show conduction delay,[10–19] whereas others do not.[43,45] We have to realize from the well known ‘inverse problem’, that multiple conduction and repolarization patterns may result into identical ECGs.
Role of animal models
There is a clear-cut difference in opinion between us and our opponents about the value and significance of an animal model. We do not see how the absence of an animal model in case of the depolarization model can be used as either an argument in favor of the repolarization hypothesis or against the depolarization hypothesis. The wedge preparation has been demonstrated by others[71] to have certain important shortcomings. Data from whole (experimental) heart but in particular human data have our preference.
Role of repolarization
As to the role of transmural (endo-epi) or epicardial dispersion of repolarization, we do not agree with the statement that “Fig 2B shows […] despite the classical BrS ECG, no transmural dispersion of repolarization or any other arrhythmogenic substrate …”. The reason for the negative T-wave in this part of the model is actuated by transmural dispersion of repolarization between the shorter endocardial action potential and the longer epicardial action potential, whereas the ST-segment elevation would result from epi-epi dispersion. Hence we doubt the supposed stable and not-arrhythmogenic state of this part of the repolarization model.
Role of late potentials
Regarding late potentials, our colleagues argue that “late potentials could arise from the delayed second upstroke of the epicardial action potential in the RVOT or to a concealed phase 2 reentry” so as in figure 2B, 2C or 2D. Let us first state that the concept of phase 2 reentry is in fact not justified. We are dealing with a triggered beat and not with the continuation of a preceding activation front. Apart from this there are several arguments against this assumption. The association between late potentials and concealed phase 2 reentry seems unlikely as late potentials are much more often recognized in Brugada syndrome patients than arrhythmias.[13,19,27,30] Late potentials correlate closely to fragmented QRS complexes as reported by one of our antagonists (Dr. Morita)[30] and are associated with depolarization abnormalities in the RVOT.[16,17,19] Alternatively, that would only leave the association between a delayed second upstroke of the epicardial action potential in the RVOT as in figure 2B/2C and late potentials. But then, why would late potentials be associated with a delayed second upstroke of the epicardial action potentials in the RVOT only? Late potentials in Brugada syndrome patients are already observed when they do not have a type-1 ECG. They exacerbate when the type-1 ECG develops, especially in the RVOT region.[13,19] With a discontinuously traveling electrical impulse through structurally abnormal cardiac tissue this is easily explained. In addition, superimposed sodium channel blockade may increase conduction delay further. In Brugada syndrome patients this augments late potentials and augmented late potentials are related to higher incidence of arrhythmias [30,72,73]. How can we understand the presence of late potentials on the basis of the repolarization hypothesis? It is highly improbable that a delayed and relatively slow upstroke in phase 2 and 3 of the epicardial action potential in the RVOT could affect the global recording of high frequency late potentials with more or less simultaneous repolarization of the bulk of the cardiac mass.
Effects of exercise
As to the effect of tachycardia during exercise on ST elevation in Brugada syndrome, our experience,[63] is very different than that of our discussants. In Figure 3 the exercise example with lower ST elevation than at baseline, shows a heart rate of 75 beats/min (Post Ex [0 min]), which may present standing, but not exercise. In a relatively large group of Brugada syndrome patients versus controls we have shown that there is J elevation during exercise (and thereafter).[63] Figure 5 gives an example of a Brugada syndrome patient with a tachycardia during exercise. Not only there is more (not less) ST-elevation with tachycardia, but interestingly the ST-elevation is alternating indicative for 2:1 late activation of myocardial tissue (probably the RVOT). But indeed, there are some examples of a decrease during exercise, albeit followed by post-exercise augmentation of J elevation.[61] Either way, the only series in this matter,[63] supports the depolarization hypothesis.
Figure 5.

Exercise in a Brugada syndrome patient. It is clear that the tachycardia induced by exercise is accompanied by a sharp rise in ST-elevation and a coved-type morphology in V1, and, interestingly, alternating in this particular case. Courtesy of A.S. Amin, MD, and H.L. Tan, MD, PhD.
Ischemia model
In Brugada syndrome ischemia plays no role. For this reason and also because of space limitation, we consider the issues raised in relation with Figure 4 as less relevant. However, our discussants argue that the “disappearance of the T wave in alternate beats […] is never observed in BrS, but is a common characteristic of ischemia-induced tombstone morphology of the ECG, induced by coronary spasm, as illustrated in Fig. 4C”. We would like to add to this issue that there are in fact several published Brugada cases in whom the T-wave does ‘disappear’ in alternate beats (e.g. Figure 6).[74–76] As agreed by our colleagues, this is in favor of the depolarization hypothesis.
Figure 6.

Alternating T-waves in a Brugada syndrome patient. Courtesy of H.L. Tan, MD, PhD.
About triggers and substrates…
It is true that the repolarization hypothesis explains both the substrate of the Brugada’s syndrome type-1 ECG and the triggering event within the context of that hypothesis. Our colleagues argue that this is an advantage. It is true that the depolarization hypothesis only explains the substrate of the Brugada’s syndrome type-1 ECG. The triggering event can come from anywhere, albeit that structural abnormalities added to conduction abnormalities create a substrate for ‘true’ reentry. In our opinion the identical location of both triggering event and electrophysiological substrate in the scenario of the repolarization hypothesis would render such an arrhythmogenic risk that it is not easy to understand how such patients could stay alive over substantial time spans. At least we may point to the fact that extra beats that provoke VTs in Brugada syndrome patients may arise both from the right and the left ventricle as has been reported by Morita et al.[77]
CONCLUSION - Wilde/Postema
In summary, in our view principal depolarization abnormalities form the basis of the Brugada syndrome and the observed repolarization abnormalities on the ECG (the coved-type ST-segment) are the result of depolarization abnormalities probably in combination with (mild) structural abnormalities.
Rebuttal Antzelevitch/Di Diego/Viskin/Morita/Fish
Lack of Experimental Model Consistent with Depolarization Hypothesis
With all due respect to our esteemed colleagues, the inability to generate an experimental animal or in vitro model of BrS supporting the depolarization hypothesis is not a trivial matter. It is not merely that it does not exist, but that attempts to create such a model by mimicking the genetic defects responsible for BrS result in experimental models exhibiting characteristics consistent with the repolarization hypothesis. Loss of function mutations in INa and ICa and gain of function mutations in Ito recreated using pharmacological agents that inhibit INa and ICa [9, 24, 46–49] or that augment Ito [78] recapitulate all the electrocardiographic and arrhythmic manifestations of BrS via a repolarization hypothesis mechanism in the coronary perfused right ventricular wedge preparation. Even when sodium channel inhibition is reduced by a full 50%, thus mimicking a total loss of function mutation heterozygously expressed, depolarization factors contribute little to the manifestation of BrS phenotype (Fig. 2). The only means by which we are able to mimic the depolarization hypothesis is with ischemia (Fig. 4) and the ECG and functional characteristics are clearly different from those of BrS [67, 68].
Further evidence in support of the repolarization hypothesis as the predominant mechanism derives from the observation that the ECG and arrhythmic characteristics of BrS are similar whether depolarizing (SCN5A mutations causing loss of function in INa) or repolarizing (KCNE3 mutations causing a gain of function in Ito) currents are affected [79]. This is difficult indeed to explain if the major substrate in the former, but not in the latter, is due to markedly delayed conduction.
Effects of exercise
Our challengers have acknowledged the fact that a substrate that causes a major conduction delay should be sensitive to an acceleration of rate and they point to their recent study [63], the only one thus far published, demonstrating that in most of their BrS patients the ST segment is further elevated during exercise. It is noteworthy that another study has recently been completed evaluating the effect of exercise. In a recent preliminary report by Makimoto et al. [80] evaluating 93 BrS patients, a J point elevation was observed during peak exercise in only 9% of cases, but even in these few, ST segment elevation was reduced. Thus in 0 out of 93 BrS patients and 0 of 22 controls was ST segment elevated during peak exercise. One interpretation of this is that in these cases J point elevation reflects conduction delay in the RVOT, but the reduction in ST segment elevation reflects a decrease in the amplitude of the epicardial action potential notch and a reduction of the BrS substrate. Interestingly, in 34% of the BrS patients in the Makimoto and co-worker’s [80] series, ST segment was elevated during the early period of recovery from exercise, consistent with a period of enhanced vagal tone, which is known to accentuate the epicardial action potential notch. These results provide compelling evidence in support of the repolarization hypothesis.
Alternating appearance of T waves
Our colleagues point to the alternating appearance of T waves as evidence in support of the depolarization hypothesis. Indeed this is the case when accompanied by a tombstone morphology of the R wave as we illustrated in Figure 2, but in its absence this phenomenon may be more consistent with a repolarization hypothesis as illustrated in Figure 7 [81].
Figure 7.

Appearance of T wave in alternate beats in an experitmental model of BrS generated by exposing a canine right ventricular wedge prpearation to verapamil (1 μM). T wave alternans occurs as a result of concealed phase 2 reentry. The dome propagates from Epi 1 to Epi 2 on alternating beats while the endocardial response remains constant. The concealed phase 2 reentry results in a negative T wave in alternate beats only. BCL=558 ms. Modified form [81], with permission.
Role of Late Potentials
As previously noted, we are of the opinion that that late potentials observed in BrS patients [16,27,53–57] do not necessarily denote the presence of structural defects and conduction delays as perfunctorily presumed in many studies because in BrS late potentials could arise from the delayed second upstroke of the epicardial action potential in the RVOT or to a concealed phase 2 reentry [7,53]. Our colleagues indicate that “it is highly improbable that a delayed and relatively slow upstroke in phase 2 and 3 of the epicardial action potential in the RVOT could affect the global recording of high frequency late potentials with more or less simultaneous repolarization of the bulk of the cardiac mass.” The feasibility of this manifestation is illustrated in Figure 8. It is noteworthy that exposure inhibition of Ito with 4-aminopyriridine or quinidine abolished the repolarization heterogeneities leading to disappearance of the late potentials, consistent with the ability of quinidine to abolish SAECG late potentials in patients with BrS. If late potentials observed in BrS patients were due to delayed conduction, quinidine’s effect to inhibit INa would be expected to exacerbate their appearance.
Figure 8.

Late potentials due to the delayed second upstroke of the epicardial response or to concelaed phase 2 reentry generated in a canine right ventricular wedge model of Brugada sydnrome. A: Control. B: BrS phenotype develops following exposure to the INa and ICa inhibitor terfenadine (5 uM); a late potential is registered in the the epicardial electrogram following an 80 ms delay coincident with the upstroke of phase 2 of the action potential (arrow). C: Further exposure to terfenadine leads to loss of the action potnatil dome at some epicardial sites (Epi 1) but not others leading to the development of a concealed phase 2 reentry which regsiters in the epicardial electrogram as a late pottnial with a 148 ms delay (arrow). Modified form [82], with permission.
CONCLUSION - Antzelevitch/Di Diego/Viskin/Morita/Fish
We conclude that the available data provide compelling evidence in support of the repolarization hypothesis as the predominant mechanism underlying BrS. Slowed conduction and mild structural defects in some BrS cases, particularly in those involving INa loss of function, is undeniable and is likely to contribute to the Brugada phenotype, but in our view is not obligatory. The marked accentuation of the epicardial action potential notch can not only account for the ST segment elevation associated with BrS, but can facilitate loss of the action potential dome leading to a marked dispersion of repolarization that when invaded by a premature beat can encounter marked conduction delay, thus setting the stage for the development of reentrant arrhythmias.
Acknowledgments
Drs Wilde and Postema would like to thank Tobias Opthof for fruitful discussions.
Supported by grant HL47678 (CA) from NHLBI, and New York State and Florida Grand Lodges of Free and Accepted Masons.
Footnotes
Publisher's Disclaimer: This is a PDF file of an unedited manuscript that has been accepted for publication. As a service to our customers we are providing this early version of the manuscript. The manuscript will undergo copyediting, typesetting, and review of the resulting proof before it is published in its final citable form. Please note that during the production process errors may be discovered which could affect the content, and all legal disclaimers that apply to the journal pertain.
Reference List
- 1.Brugada P, Brugada J. Right bundle branch block, persistent ST segment elevation and sudden cardiac death: a distinct clinical and electrocardiographic syndrome. A multicenter report. J Am Coll Cardiol. 1992;20:1391–6. doi: 10.1016/0735-1097(92)90253-j. [DOI] [PubMed] [Google Scholar]
- 2.Antzelevitch C, Brugada P, Borggrefe M, Brugada J, Brugada R, Corrado D, et al. Brugada syndrome: report of the second consensus conference. Heart Rhythm. 2005;2:429–40. doi: 10.1016/j.hrthm.2005.01.005. [DOI] [PubMed] [Google Scholar]
- 3.Eckardt L, Probst V, Smits JP, Bahr ES, Wolpert C, Schimpf R, et al. Long-term prognosis of individuals with right precordial ST-segment-elevation Brugada syndrome. Circulation. 2005;111:257–63. doi: 10.1161/01.CIR.0000153267.21278.8D. [DOI] [PubMed] [Google Scholar]
- 4.Priori SG, Napolitano C, Gasparini M, Pappone C, Della Bella P, Giordano U, et al. Natural history of Brugada syndrome: insights for risk stratification and management. Circulation. 2002;105:1342–7. doi: 10.1161/hc1102.105288. [DOI] [PubMed] [Google Scholar]
- 5.Takagi M, Yokoyama Y, Aonuma K, Aihara N, Hiraoka M. Clinical characteristics and risk stratification in symptomatic and asymptomatic patients with brugada syndrome: multicenter study in Japan. J Cardiovasc Electrophysiol. 2007;18:1244–51. doi: 10.1111/j.1540-8167.2007.00971.x. [DOI] [PubMed] [Google Scholar]
- 6.Postema PG, Wolpert C, Amin AS, Probst V, Borggrefe M, Roden DM, et al. Drugs and Brugada syndrome patients: review of the literature, recommendations, and an up-to-date website. Heart Rhythm. 2009;6:1335–41. doi: 10.1016/j.hrthm.2009.07.002. www.brugadadrugs.org. [DOI] [PMC free article] [PubMed]
- 7.Antzelevitch C. Brugada syndrome. Pacing Clin Electrophysiol. 2006;29:1130–59. doi: 10.1111/j.1540-8159.2006.00507.x. [DOI] [PMC free article] [PubMed] [Google Scholar]
- 8.Meregalli PG, Wilde AA, Tan HL. Pathophysiological mechanisms of Brugada syndrome: depolarization disorder, repolarization disorder, or more? Cardiovasc Res. 2005;67:367–78. doi: 10.1016/j.cardiores.2005.03.005. [DOI] [PubMed] [Google Scholar]
- 9.Yan GX, Antzelevitch C. Cellular basis for the Brugada syndrome and other mechanisms of arrhythmogenesis associated with ST-segment elevation. Circulation. 1999;100:1660–6. doi: 10.1161/01.cir.100.15.1660. [DOI] [PubMed] [Google Scholar]
- 10.Corrado D, Nava A, Buja G, Martini B, Fasoli G, Oselladore L, et al. Familial cardiomyopathy underlies syndrome of right bundle branch block, ST segment elevation and sudden death. J Am Coll Cardiol. 1996;27:443–8. doi: 10.1016/0735-1097(95)00485-8. [DOI] [PubMed] [Google Scholar]
- 11.Matsuo K, Shimizu W, Kurita T, Suyama K, Aihara N, Kamakura S, et al. Increased dispersion of repolarization time determined by monophasic action potentials in two patients with familial idiopathic ventricular fibrillation. J Cardiovasc Electrophysiol. 1998;9:74–83. doi: 10.1111/j.1540-8167.1998.tb00869.x. [DOI] [PubMed] [Google Scholar]
- 12.Tukkie R, Sogaard P, Vleugels J, de Groot I, Wilde AA, Tan HL. Delay in right ventricular activation contributes to Brugada syndrome. Circulation. 2004;109:1272–7. doi: 10.1161/01.CIR.0000118467.53182.D1. [DOI] [PubMed] [Google Scholar]
- 13.Kasanuki H, Ohnishi S, Ohtuka M, Matsuda N, Nirei T, Isogai R, et al. Idiopathic ventricular fibrillation induced with vagal activity in patients without obvious heart disease. Circulation. 1997;95:2277–85. doi: 10.1161/01.cir.95.9.2277. [DOI] [PubMed] [Google Scholar]
- 14.Coronel R, Casini S, Koopmann TT, Wilms-Schopman FJ, Verkerk AO, de Groot JR, et al. Right ventricular fibrosis and conduction delay in a patient with clinical signs of Brugada syndrome: a combined electrophysiological, genetic, histopathologic, and computational study. Circulation. 2005;112:2769–77. doi: 10.1161/CIRCULATIONAHA.105.532614. [DOI] [PubMed] [Google Scholar]
- 15.Postema PG, van Dessel PF, de Bakker JM, Dekker LR, Linnenbank AC, Hoogendijk MG, et al. Slow and discontinuous conduction conspire in Brugada syndrome: a right ventricular mapping and stimulation study. Circ Arrhythm Electrophysiol. 2008;1:379–86. doi: 10.1161/CIRCEP.108.790543. [DOI] [PubMed] [Google Scholar]
- 16.Nagase S, Kusano KF, Morita H, Fujimoto Y, Kakishita M, Nakamura K, et al. Epicardial electrogram of the right ventricular outflow tract in patients with the Brugada syndrome: using the epicardial lead. J Am Coll Cardiol. 2002;39:1992–5. doi: 10.1016/s0735-1097(02)01888-0. [DOI] [PubMed] [Google Scholar]
- 17.Hisamatsu K, Kusano KF, Morita H, Takenaka S, Nagase S, Nakamura K, et al. Relationships between depolarization abnormality and repolarization abnormality in patients with Brugada syndrome: using body surface signal-averaged electrocardiography and body surface maps. J Cardiovasc Electrophysiol. 2004;15:870–6. doi: 10.1046/j.1540-8167.2004.03675.x. [DOI] [PubMed] [Google Scholar]
- 18.Bruns HJ, Eckardt L, Vahlhaus C, Schulze-Bahr E, Haverkamp W, Borggrefe M, et al. Body surface potential mapping in patients with Brugada syndrome: right precordial ST segment variations and reverse changes in left precordial leads. Cardiovasc Res. 2002;54:58–66. doi: 10.1016/s0008-6363(02)00242-0. [DOI] [PubMed] [Google Scholar]
- 19.Postema PG, van Dessel PF, Kors JA, Linnenbank AC, van Herpen G, Ritsema van Eck HJ, et al. Local depolarization abnormalities are the dominant pathophysiologic mechanism for the type-1 ECG in Brugada syndrome. A study of electrocardiograms, vectorcardiograms and body surface potential maps during ajmaline provocation. J Am Coll Cardiol. 2010;55:789–97. doi: 10.1016/j.jacc.2009.11.033. [DOI] [PubMed] [Google Scholar]
- 20.Rolf S, Bruns HJ, Wichter T, Kirchhof P, Ribbing M, Wasmer K, et al. The ajmaline challenge in Brugada syndrome: diagnostic impact, safety, and recommended protocol. Eur Heart J. 2003;24:1104–12. doi: 10.1016/s0195-668x(03)00195-7. [DOI] [PubMed] [Google Scholar]
- 21.Meregalli PG, Ruijter JM, Hofman N, Bezzina CR, Wilde AA, Tan HL. Diagnostic value of flecainide testing in unmasking SCN5A-related Brugada syndrome. J Cardiovasc Electrophysiol. 2006;17:857–64. doi: 10.1111/j.1540-8167.2006.00531.x. [DOI] [PubMed] [Google Scholar]
- 22.Wolpert C, Echternach C, Veltmann C, Antzelevitch C, Thomas GP, Spehl S, et al. Intravenous drug challenge using flecainide and ajmaline in patients with Brugada syndrome. Heart Rhythm. 2005;2:254–60. doi: 10.1016/j.hrthm.2004.11.025. [DOI] [PMC free article] [PubMed] [Google Scholar]
- 23.Brugada R, Brugada J, Antzelevitch C, Kirsch GE, Potenza D, Towbin JA, et al. Sodium channel blockers identify risk for sudden death in patients with ST-segment elevation and right bundle branch block but structurally normal hearts. Circulation. 2000;101:510–5. doi: 10.1161/01.cir.101.5.510. [DOI] [PubMed] [Google Scholar]
- 24.Shimizu W, Antzelevitch C, Suyama K, Kurita T, Taguchi A, Aihara N, et al. Effect of sodium channel blockers on ST segment, QRS duration, and corrected QT interval in patients with Brugada syndrome. J Cardiovasc Electrophysiol. 2000;11:1320–9. doi: 10.1046/j.1540-8167.2000.01320.x. [DOI] [PubMed] [Google Scholar]
- 25.Chen Q, Kirsch GE, Zhang D, Brugada R, Brugada J, Brugada P, et al. Genetic basis and molecular mechanism for idiopathic ventricular fibrillation. Nature. 1998;392:293–6. doi: 10.1038/32675. [DOI] [PubMed] [Google Scholar]
- 26.Rook MB, Bezzina Alshinawi C, Groenewegen WA, van Gelder I, van Ginneken AC, Jongsma HJ, et al. Human SCN5A gene mutations alter cardiac sodium channel kinetics and are associated with the Brugada syndrome. Cardiovasc Res. 1999;44:507–17. doi: 10.1016/s0008-6363(99)00350-8. [DOI] [PubMed] [Google Scholar]
- 27.Fujiki A, Usui M, Nagasawa H, Mizumaki K, Hayashi H, Inoue H. ST segment elevation in the right precordial leads induced with class IC antiarrhythmic drugs: insight into the mechanism of Brugada syndrome. J Cardiovasc Electrophysiol. 1999;10:214–8. doi: 10.1111/j.1540-8167.1999.tb00662.x. [DOI] [PubMed] [Google Scholar]
- 28.Bebarova M, O’Hara T, Geelen JL, Jongbloed RJ, Timmermans C, Arens YH, et al. Subepicardial phase-0 block and discontinuous transmural conduction underlie right-precordial ST-segment elevation by a SCN5A loss-of-function mutation. Am J Physiol Heart Circ Physiol. 2008;295:H48–H58. doi: 10.1152/ajpheart.91495.2007. [DOI] [PMC free article] [PubMed] [Google Scholar]
- 29.Frustaci A, Priori SG, Pieroni M, Chimenti C, Napolitano C, Rivolta I, et al. Cardiac histological substrate in patients with clinical phenotype of Brugada syndrome. Circulation. 2005;112:3680–7. doi: 10.1161/CIRCULATIONAHA.105.520999. [DOI] [PubMed] [Google Scholar]
- 30.Morita H, Kusano KF, Miura D, Nagase S, Nakamura K, Morita ST, et al. Fragmented QRS as a marker of conduction abnormality and a predictor of prognosis of Brugada syndrome. Circulation. 2008;118:1697–704. doi: 10.1161/CIRCULATIONAHA.108.770917. [DOI] [PubMed] [Google Scholar]
- 31.Chiale PA, Przybylski J, Laino RA, Halpern MS, Sanchez RA, Gabrieli A, et al. Electrocardiographic changes evoked by ajmaline in chronic Chagas’ disease with manifest myocarditis. Am J Cardiol. 1982;49:14–20. doi: 10.1016/0002-9149(82)90271-5. [DOI] [PubMed] [Google Scholar]
- 32.Bezzina CR, Rook MB, Groenewegen WA, Herfst LJ, van der Wal AC, Lam J, et al. Compound heterozygosity for mutations (W156X and R225W) in SCN5A associated with severe cardiac conduction disturbances and degenerative changes in the conduction system. Circ Res. 2003;92:159–68. doi: 10.1161/01.res.0000052672.97759.36. [DOI] [PubMed] [Google Scholar]
- 33.van Veen TA, Stein M, Royer A, Le Quang K, Charpentier F, Colledge WH, et al. Impaired impulse propagation in Scn5a-knockout mice: combined contribution of excitability, connexin expression, and tissue architecture in relation to aging. Circulation. 2005;112:1927–35. doi: 10.1161/CIRCULATIONAHA.105.539072. [DOI] [PubMed] [Google Scholar]
- 34.de Bakker JM, van Capelle FJ, Janse MJ, Tasseron S, Vermeulen JT, de Jonge N, et al. Slow conduction in the infarcted human heart. ‘Zigzag’ course of activation. Circulation. 1993;88:915–26. doi: 10.1161/01.cir.88.3.915. [DOI] [PubMed] [Google Scholar]
- 35.Gaborit N, Wichter T, Varro A, Szuts V, Lamirault G, Eckardt L, et al. Transcriptional profiling of ion channel genes in Brugada syndrome and other right ventricular arrhythmogenic diseases. Eur Heart J. 2009;30:487–96. doi: 10.1093/eurheartj/ehn520. [DOI] [PubMed] [Google Scholar]
- 36.Probst V, Wilde AA, Barc J, Sacher F, Babuty D, Mabo P, et al. SCN5A mutations and the role of genetic background in the pathophysiology of Brugada syndrome. Circ Cardiovasc Genet. 2009;2:552–7. doi: 10.1161/CIRCGENETICS.109.853374. [DOI] [PubMed] [Google Scholar]
- 37.Tan HL, Bezzina CR, Smits JP, Verkerk AO, Wilde AA. Genetic control of sodium channel function. Cardiovasc Res. 2003;57:961–73. doi: 10.1016/s0008-6363(02)00714-9. [DOI] [PubMed] [Google Scholar]
- 38.Amin AS, Meregalli PG, Bardai A, Wilde AA, Tan HL. Fever increases the risk for cardiac arrest in the Brugada syndrome. Ann Intern Med. 2008;149:216–8. doi: 10.7326/0003-4819-149-3-200808050-00020. [DOI] [PubMed] [Google Scholar]
- 39.Franz MR, Bargheer K, Rafflenbeul W, Haverich A, Lichtlen PR. Monophasic action potential mapping in human subjects with normal electrocardiograms: direct evidence for the genesis of the T wave. Circulation. 1987;75:379–86. doi: 10.1161/01.cir.75.2.379. [DOI] [PubMed] [Google Scholar]
- 40.Hoogendijk MG, Potse M, Linnenbank AC, Verkerk AO, Den Ruijter HM, Van Amersfoorth SC, et al. Mechanism of right precordial ST-segment elevation in structural heart disease: excitation failure by current-to-load mismatch. Heart Rhythm. 2010;7:238–48. doi: 10.1016/j.hrthm.2009.10.007. [DOI] [PubMed] [Google Scholar]
- 41.Rohr S, Salzberg BM. Characterization of impulse propagation at the microscopic level across geometrically defined expansions of excitable tissue: multiple site optical recording of transmembrane voltage (MSORTV) in patterned growth heart cell cultures. J Gen Physiol. 1994;104:287–309. doi: 10.1085/jgp.104.2.287. [DOI] [PMC free article] [PubMed] [Google Scholar]
- 42.Gussak I, Antzelevitch C, Bjerregaard P, Towbin JA, Chaitman BR. The Brugada syndrome: clinical, electrophysiologic and genetic aspects. J Am Coll Cardiol. 1999;33:5–15. doi: 10.1016/s0735-1097(98)00528-2. [DOI] [PubMed] [Google Scholar]
- 43.Miyazaki T, Mitamura H, Miyoshi S, Soejima K, Aizawa Y, Ogawa S. Autonomic and antiarrhythmic drug modulation of ST segment elevation in patients with Brugada syndrome. J Am Coll Cardiol. 1996;27:1061–70. doi: 10.1016/0735-1097(95)00613-3. [DOI] [PubMed] [Google Scholar]
- 44.Antzelevitch C, Brugada P, Brugada J, Brugada R, Shimizu W, Gussak I, et al. Brugada syndrome: a decade of progress. Circ Res. 2002;91:1114–8. doi: 10.1161/01.res.0000046046.53721.90. [DOI] [PubMed] [Google Scholar]
- 45.Kurita T, Shimizu W, Inagaki M, Suyama K, Taguchi A, Satomi K, et al. The electrophysiologic mechanism of ST-segment elevation in Brugada syndrome. J Am Coll Cardiol. 2002;40:330–4. doi: 10.1016/s0735-1097(02)01964-2. [DOI] [PubMed] [Google Scholar]
- 46.Aiba T, Shimizu W, Hidaka I, Uemura K, Noda T, Zheng C, et al. Cellular basis for trigger and maintenance of ventricular fibrillation in the brugada syndrome model high-resolution optical mapping study. J Am Coll Cardiol. 2006;47:2074–85. doi: 10.1016/j.jacc.2005.12.064. [DOI] [PubMed] [Google Scholar]
- 47.Di Diego JM, Cordeiro JM, Goodrow RJ, Fish JM, Zygmunt AC, Perez GJ, et al. Ionic and cellular basis for the predominance of the Brugada syndrome phenotype in males. Circulation. 2002;106:2004–11. doi: 10.1161/01.cir.0000032002.22105.7a. [DOI] [PubMed] [Google Scholar]
- 48.Fish JM, Antzelevitch C. Role of sodium and calcium channel block in unmasking the Brugada syndrome. Heart Rhythm. 2004;1:210–7. doi: 10.1016/j.hrthm.2004.03.061. [DOI] [PMC free article] [PubMed] [Google Scholar]
- 49.Morita H, Zipes DP, Fukushima-Kusano K, Nagase S, Nakamura K, Morita ST, et al. Repolarization heterogeneity in the right ventricular outflow tract: correlation with ventricular arrhythmias in Brugada patients and in an in vitro canine Brugada model. Heart Rhythm. 2008;5:725–33. doi: 10.1016/j.hrthm.2008.02.028. [DOI] [PubMed] [Google Scholar]
- 50.Shimizu W, Aiba T, Kamakura S. Mechanisms of disease: current understanding and future challenges in Brugada syndrome. Nat Clin Pract Cardiovasc Med. 2005;2:408–14. doi: 10.1038/ncpcardio0268. [DOI] [PubMed] [Google Scholar]
- 51.Tan HL. Sodium channel variants in heart disease: expanding horizons. J Cardiovasc Electrophysiol. 2006;17 (Suppl 1):S151–S157. doi: 10.1111/j.1540-8167.2006.00398.x. [DOI] [PubMed] [Google Scholar]
- 52.Zumhagen S, Spieker T, Rolinck J, Baba HA, Breithardt G, Bocker W, et al. Absence of pathognomonic or inflammatory patterns in cardiac biopsies from patients with Brugada syndrome. Circ Arrhythm Electrophysiol. 2009;2:16–23. doi: 10.1161/CIRCEP.107.737882. [DOI] [PubMed] [Google Scholar]
- 53.Antzelevitch C. Late potentials and the Brugada syndrome. J Am Coll Cardiol. 2002;39:1996–9. doi: 10.1016/s0735-1097(02)01887-9. [DOI] [PubMed] [Google Scholar]
- 54.Eckardt L, Bruns HJ, Paul M, Kirchhof P, Schulze-Bahr E, Wichter T, et al. Body surface area of ST elevation and the presence of late potentials correlate to the inducibility of ventricular tachyarrhythmias in Brugada syndrome. J Cardiovasc Electrophysiol. 2002;13:742–9. doi: 10.1046/j.1540-8167.2002.00742.x. [DOI] [PubMed] [Google Scholar]
- 55.Futterman LG, Lemberg L. Brugada. Am J Crit Care. 2001;10:360–4. [PubMed] [Google Scholar]
- 56.Ikeda T, Takami M, Sugi K, Mizusawa Y, Sakurada H, Yoshino H. Noninvasive risk stratification of subjects with a Brugada-type electrocardiogram and no history of cardiac arrest. Ann Noninvasive Electrocardiol. 2005;10:396–403. doi: 10.1111/j.1542-474X.2005.00055.x. [DOI] [PMC free article] [PubMed] [Google Scholar]
- 57.Mizobuchi M, Enjoji Y, Nakamura S, Muranishi H, Utsunomiya M, Funatsu A, et al. Ventricular late potential in patients with apparently normal electrocardiogram; predictor of Brugada syndrome. Pacing Clin Electrophysiol. 2009 doi: 10.1111/j.1540-8159.2009.02621.x. [Epub ahead of print] [DOI] [PubMed] [Google Scholar]
- 58.Takagi M, Aihara N, Kuribayashi S, Taguchi A, Shimizu W, Kurita T, et al. Localized right ventricular morphological abnormalities detected by electron-beam computed tomography represent arrhythmogenic substrates in patients with the Brugada syndrome. Eur Heart J. 2001;22:1032–41. doi: 10.1053/euhj.2000.2424. [DOI] [PubMed] [Google Scholar]
- 59.Antzelevitch C. Brugada syndrome: historical perspectives and observations. Eur Heart J. 2002;23:676–8. doi: 10.1053/euhj.2001.3145. [DOI] [PubMed] [Google Scholar]
- 60.Esperer HD, Hoos O, Hottenrott K. Syncope due to Brugada syndrome in a young athlete. Br J Sports Med. 2006;41:180–1. doi: 10.1136/bjsm.2006.030098. [DOI] [PMC free article] [PubMed] [Google Scholar]
- 61.Guevara-Valdivia ME, Iturralde TP, De MA, Colin LL, Medeiros DA, Gonzalez-Hermosillo JA. Electrocardiographic changes during stress test in a patient with “Brugada syndrome”. Arch Cardiol Mex. 2001;71:66–72. [PubMed] [Google Scholar]
- 62.Stix G, Bella PD, Carbucicchio C, Schmidinger H. Spatial and temporal heterogeneity of depolarization and repolarization may complicate implantable cardioverter defibrillator therapy in Brugada syndrome. J Cardiovasc Electrophysiol. 2000;11:516–21. doi: 10.1111/j.1540-8167.2000.tb00004.x. [DOI] [PubMed] [Google Scholar]
- 63.Amin AS, de Groot EA, Ruijter JM, Wilde AA, Tan HL. Exercise-induced ECG changes in Brugada syndrome. Circ Arrhythm Electrophysiol. 2009;2:531–9. doi: 10.1161/CIRCEP.109.862441. [DOI] [PubMed] [Google Scholar]
- 64.Belhassen B, Glick A, Viskin S. Efficacy of quinidine in high-risk patients with Brugada syndrome. Circulation. 2004;110:1731–7. doi: 10.1161/01.CIR.0000143159.30585.90. [DOI] [PubMed] [Google Scholar]
- 65.Belhassen B, Viskin S. Pharmacologic approach to therapy of Brugada syndrome: quinidine as an alternative to ICD therapy? In: Antzelevitch C, Brugada P, Brugada J, Brugada R, editors. The Brugada Syndrome: From Bench to Bedside. Blackwell Futura; Oxford: 2004. pp. 202–211. [Google Scholar]
- 66.Watanabe H, Chinushi M, Osaki A, Okamura K, Izumi D, Komura S, et al. Elimination of late potentials by quinidine in a patient with Brugada syndrome. J Electrocardiol. 2006;39:63–6. doi: 10.1016/j.jelectrocard.2005.07.009. [DOI] [PubMed] [Google Scholar]
- 67.Di Diego JM, Antzelevitch C. Cellular basis for ST-segment changes observed during ischemia. J Electrocardiol. 2003;36 (Suppl):1–5. doi: 10.1016/j.jelectrocard.2003.09.001. [DOI] [PubMed] [Google Scholar]
- 68.Di Diego JM, Fish JM, Antzelevitch C. Brugada syndrome and ischemia-induced ST-segment elevation. Similarities and differences. J Electrocardiol. 2005;38:14–7. doi: 10.1016/j.jelectrocard.2005.06.003. [DOI] [PMC free article] [PubMed] [Google Scholar]
- 69.Childers R. R wave amplitude in ischemia, injury, and infarction. Plenary address. J Electrocardiol. 1996;29 (Suppl):171–8. doi: 10.1016/s0022-0736(96)80058-6. [DOI] [PubMed] [Google Scholar]
- 70.Cordeiro JM, Mazza M, Goodrow R, Ulahannan N, Antzelevitch C, Di Diego JM. Functionally distinct sodium channels in ventricular epicardial and endocardial cells contribute to a greater sensitivity of epicardium to electrical depression. Am J Physiol Heart Circ Physiol. 2008;295:H154–H162. doi: 10.1152/ajpheart.01327.2007. [DOI] [PMC free article] [PubMed] [Google Scholar]
- 71.Opthof T, Coronel R, Janse MJ, Rosen MR. A wedge is not a heart. Heart Rhythm. 2007;4:1116–9. [Google Scholar]
- 72.Kanda M, Shimizu W, Matsuo K, Nagaya N, Taguchi A, Suyama K, et al. Electrophysiologic characteristics and implications of induced ventricular fibrillation in symptomatic patients with Brugada syndrome. J Am Coll Cardiol. 2002;39:1799–805. doi: 10.1016/s0735-1097(02)01867-3. [DOI] [PubMed] [Google Scholar]
- 73.Morita H, Takenaka-Morita S, Fukushima-Kusano K, Kobayashi M, Nagase S, Kakishita M, et al. Risk stratification for asymptomatic patients with Brugada syndrome. Circ J. 2003;67:312–6. doi: 10.1253/circj.67.312. [DOI] [PubMed] [Google Scholar]
- 74.Fazelifar AF, Haghjoo M, Arya A, Kazemi B, Bagherzadeh A, Nikoo MH, et al. Spontaneous alternans in Brugada ECG morphology. J Interv Card Electrophysiol. 2006;15:131–4. doi: 10.1007/s10840-006-8263-x. [DOI] [PubMed] [Google Scholar]
- 75.Tada H, Nogami A, Shimizu W, Naito S, Nakatsugawa M, Oshima S, et al. ST segment and T wave alternans in a patient with Brugada syndrome. Pacing Clin Electrophysiol. 2000;23:413–5. doi: 10.1111/j.1540-8159.2000.tb06773.x. [DOI] [PubMed] [Google Scholar]
- 76.Tada T, Kusano KF, Nagase S, Banba K, Miura D, Nishii N, et al. Clinical significance of macroscopic T-wave alternans after sodium channel blocker administration in patients with Brugada syndrome. J Cardiovasc Electrophysiol. 2008;19:56–61. doi: 10.1111/j.1540-8167.2007.00967.x. [DOI] [PubMed] [Google Scholar]
- 77.Morita H, Nagase S, Miura D, Miura A, Hiramatsu S, Tada T, et al. Differential effects of cardiac sodium channel mutations on initiation of ventricular arrhythmias in patients with Brugada syndrome. Heart Rhythm. 2009;6:487–92. doi: 10.1016/j.hrthm.2009.01.031. [DOI] [PubMed] [Google Scholar]
- 78.Calloe K, Cordeiro JM, Di Diego JM, Hansen RS, Grunnet M, Olesen SP, et al. A transient outward potassium current activator recapitulates the electrocardiographic manifestations of Brugada syndrome. Cardiovasc Res. 2009 Mar 1;81(4):686–94. doi: 10.1093/cvr/cvn339. [DOI] [PMC free article] [PubMed] [Google Scholar]
- 79.Delpón E, Cordeiro JM, Núñez L, Thomsen PEB, Guerchicoff A, Pollevick GD, Wu Y, Kanters JK, Larsen CT, Burashnikov A, Christiansen M, Antzelevitch C. Functional effects of KCNE3 mutation and its role in the development of Brugada syndrome. Circ Arrhythm Electrophysiol. 2008;1:209–218. doi: 10.1161/CIRCEP.107.748103. [DOI] [PMC free article] [PubMed] [Google Scholar]
- 80.Makimoto H, Nakagawa E, Takaki H, Yamagata K, Kawata H, Okamura H, Noda T, Satomi K, Suyama K, Kurita T, Aihara N, Kamakura S, Shimizu W. Diagnostic and prognostic value of augmented ST-segment elevation at exercise testing in patients with Brugada syndrome. Circulation. 2008;118(Suppl 2):S674. [Google Scholar]
- 81.Fish JM, Antzelevitch C. Cellular mechanism and arrhythmogenic potential of T-wave alternans in the Brugada syndrome. J Cardiovasc Electrophysiol. 2008 Mar;19(3):301–8. doi: 10.1111/j.1540-8167.2007.01025.x. [DOI] [PMC free article] [PubMed] [Google Scholar]
- 82.Antzelevitch C, editor. From Bench to Bedside. Blackwell, Futura; Malden, MA: 2005. The Brugada Syndrome. [Google Scholar]