Abstract
We report on the application of scanning electrochemical microscopy (SECM) for the measurement of the ion-selective permeability of porous nanocrystalline silicon membrane as a new type of nanoporous material with potential applications in analytical, biomedical, and biotechnology device development. The reliable measurement of high permeability in the molecularly thin nanoporous membrane to various ions is important for greater understanding of its structure–permeability relationship and also for its successful applications. In this work, this challenging measurement is enabled by introducing two novel features into amperometric SECM tips based on the micropipet-supported interface between two immiscible electrolyte solutions (ITIES) to reveal the important ion-transport properties of the ultrathin nanopore membrane. The tip of a conventional heat-pulled micropipet is milled using focused ion beam (FIB) technique to be smoother, better aligned, and subsequently, approach closer to the membrane surface, which allows for more precise and accurate permeability measurement. The high membrane permeability to small monovalent ions is determined using FIB-milled micropipet tips to establish a theoretical formula for the membrane permeability that is controlled by free ion diffusion across water-filled nanopores. Moreover, the ITIES tips are rendered selective for larger polyions with biomedical importance, i.e., polyanionic pentasaccharide Arixtra and polycationic peptide protamine, to yield the membrane permeability that is lower than the corresponding diffusion-limited permeability. The hindered transport of the respective polyions is unequivocally ascribed to electrostatic and steric repulsions from the wall of the nanopores, i.e., the charge and size effects.
The fast and selective transport of molecules across porous nanocrystalline silicon (pnc-Si) membranes1 is attractive potentially for various important applications such as nanofiltration,2, 3 biomedical device development,4, 5 and nanofluidics for medical diagnostics and drug discovery.6–10 The high permeability of the molecularly thin nanoporous membrane is also essential for its successful applications as cell culture and tissue engineering substrates.11 This novel solid-state membrane features well-defined nanopores with an average diameter of ~10 nm and a length of ~15 nm. The nanopore membrane is nearly as thin as biological membranes and is ~1000 times thinner than widely used nanopore membranes such as aluminum oxide membranes and polycarbonate track etch membranes. Despite the molecular thickness, the nanopore silicon membrane with dimensions of up to 0.1 mm × 3 mm can maintain its structural integrity with >1 atm backpressure and is stable in liquid. In bulk transport experiments, the transport of small molecules through the short nanopores is fast enough to be limited by their diffusion across the stagnant layers that are adjacent to the membrane. In contrast, the solid nanopores can be nearly impermeable to large blood proteins such as bovine serum albumin (67 kDa) and immunoglobulin-γ (150 kDa), i.e., the size effect. Furthermore, small anions can be electrostatically repelled by a negatively charged native oxide layer on the membrane surface. This charge effect can be reversed to block cation transport rather than anion transport by attaching positively charged molecules on the oxide layer by employing silanization chemistry, which enables the successful modification of glass nanopores at the single pore level.12
Quantitative understanding of ion-selective permeability and its relationship to the structure of the nanopore silicon membrane is important fundamentally13 and also essential for its applications. The experimental determination of high permeability in this ultrathin membrane, however, is challenging. Recently, we employed scanning electrochemical microscopy (SECM)14, 15 to quantitatively determine the large permeability of the ultrathin pnc-Si membrane to small redox molecules using conventional Pt ultramicroelectrodes as SECM tips.16 In general, the advantage of the SECM measurement of membrane permeability resides in its selectivity to probe only a target molecule.17 Moreover, SECM can be used to induce diffusional membrane transport at a steady state without effects from convection and electroosmosis,18, 19 which greatly simplifies quantitative data analysis.20 Importantly, the SECM-induced mass transport of a target species to the membrane surface is fast enough to determine the membrane permeability that is much larger than the corresponding mass transport rate in the adjacent stagnant layers. The large permeability of the ultrathin nanopore membrane to neutral (O2 and 1,1′-ferrocenedimethanol) and cationic (Ru(NH3)63+) redox species as determined by SECM was found to be proportional to their diffusion coefficients in the aqueous solution. In contrast, permeability to a multiply charged anion, Fc(CN)64−, was lower than expected from its diffusion coefficient and decreased at lower ionic strength because of electrostatic repulsion exerted from the negatively charged oxide layer on the silicon membrane surface. These redox molecules, however, were too small to fully assess the effects of molecular size on the permeability of the nanopore membrane.
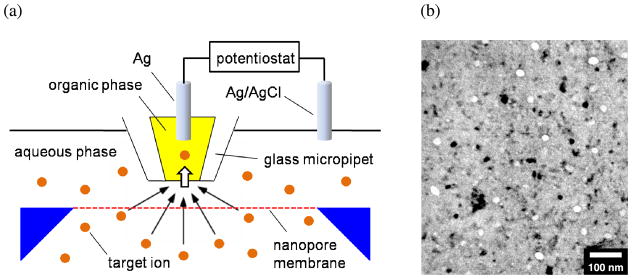
Here we measure the permeability of the pnc-Si membrane to 8 different ions with various charges and sizes (Table 1) by employing amperometric SECM tips based on the micropipet-supported interface between two immiscible electrolyte solutions (ITIES). Micropipet-supported ITIES tips allow for the selective detection of various redox-inactive ions in contrast to the conventional redox tips and have been successfully employed to probe small monovalent cations at the ITIES,21, 22 bilayer lipid membranes incorporating gramicidin channels,23 and living fibroblast cells.24, 25 In this work, ITIES tips are operated in the SECM-induced transfer mode20 to determine the ion permeability of the pnc-Si membrane at steady states. Specifically, a target ion is transferred across the micrometer-sized ITIES formed at the tip of an organic-filled pipet to induce large steady-state ion flux across the membrane just under the tip while the entire membrane is immersed in the aqueous solution of the target ion (Figure 1). The resulting amperometric tip current is numerically analyzed by the finite element method16, 19 to determine membrane permeability to the target ion.
Table 1.
Diffusion Coefficients and Hydrodynamic Radii of Target Ions
| iona | ClO4− | TMA+ | TEA+ | TPhAs+ | TPA+ | TBA+ | Arixtra10− | protamine20+ |
|---|---|---|---|---|---|---|---|---|
| D 10−6 cm2/s | 16 | 11 | 9.1 | 5.8 | 5.6 | 5.0 | 3.9 | 1.2 |
| radiusb nm | 0.15 | 0.22 | 0.26 | 0.42 | 0.43 | 0.48 | 0.62 | 2.0 |
See the experimental section for abbreviations.
Calculated from the diffusion coefficient, D, using the Stokes–Einstein equation with water viscosity of 0.89 mPa·s.
Figure 1.
(a) Scheme of ion transport across ultrathin nanopore silicon membrane as induced by a micropipet-supported liquid/liquid interface as an SECM probe. (b) TEM image of the membrane with pores (bright circles) and diffracting nanocrystals (dark spots).
Importantly, ion-selective ITIES tips developed in this work have two novel features that significantly advance the SECM approach to reveal the important ion-transport properties of the pnc-Si membrane. First, tapered glass micropipets with well defined tip geometry are fabricated by focused ion beam (FIB) technology26 to accurately and precisely determine the high membrane permeability. While FIB has been used to fabricate ultramicroelectrodes and SECM probes,27 this work is the first to demonstrate the advantage of the smooth and well-aligned surface of a FIB-milled tip for obtaining high quality SECM approach curves, which are essential for accurate and precise kinetic analysis.28 In fact, high permeability to small monovalent ions thus determined using FIB-milled micropipets allows for the experimental confirmation of a more accurate theory for the structure–permeability relationship of thin nanoporous membranes than proposed in our previous work.16 In addition, polyion-selective micropipet electrodes are applied for the first time as SECM tips. Specifically, we investigate the nanopore-mediated transport of biomedically important polyions, i.e., synthetic pentasaccharide Arixtra (~1.7 kDa and ~10 negative charges)29, 30 and polypeptide protamine (~4.5 kDa and ~20 positive charges),31, 32 to demonstrate not only the charge effect on Arixtra but also the size effect on protamine, which has a ~15–33 times smaller molecular weight than the blood proteins that showed the size effect in the previous bulk transport experiments.1
EXPERIMENTAL SECTION
Chemicals
The chloride salts of tetramethylammonium (TMA+), tetraethylammonium (TEA+), and tetrapropylammonium (TPA+), and chlorotrimethylsilane were obtained from Fluka (Milwaukee, WI). Tetrabutylammonium (TBA+) chloride hydrate, tetraphenylarsonium (TPhAs+) chloride, lithium perchlorate, and 1,2-dichloroethane (DCE) were purchased from Aldrich (Milwaukee, WI). Protamine sulfate from herring (grade III) was from Sigma (St. Louis, MO). Nitrobenzene (NB) was from J. T. Baker (Phillipsburg, NJ). The saline solution of Arixtra (7.5mg/0.6mL) was obtained from GlaxoSmithKline (Research Triangle Park, NC). All reagents were used without further purification. The tetrakis(pentafluorophenyl)borate salts33 of tetradodecylammonium (TDDATFAB) and dimethyldioctadecylammonium (DMDOTFAB) and tetradodecylammonium dimetylnaphthalenesulfonate (TDDADNNS)31 were prepared as described elsewhere. Aqueous electrolyte solutions were prepared with 18.3 M3·cm deionized water (Nanopure, Barnstead, Dubuque, IA).
Fabrication of FIB-Milled Micropipets
Borosilicate glass capillaries (o.d./i.d. = 1.0 mm/0.58 mm, 10 cm in length) were pulled using a CO2-laser capillary puller (model P-2000 Sutter Instrument Co., Novato, CA) to obtain tapered micropipets with the inner radius of 1.7 ± 0.2 μm (see Supporting Information for the pulling program). The tapered end of a micropipet was cut by the focused beam of high-energetic gallium ions using a dual beam instrument (SMI3050SE FIB-SEM, Seiko Instruments, Chiba, Japan) to obtain a smoother and better-aligned tip. A micropipet was mounted on the flat sample stage with conductive copper tape to reduce charging during imaging and milling. The alignment of the ion beam was parallel to the milled tip surface and perpendicular to the length of the capillary. The latter is important for obtaining good tip–substrate alignment in SECM experiments28 and was confirmed by SEM in the dual beam system prior to milling. A short portion of <0.5 μm from the tip was removed to avoid significant increase in the tip diameter. The resulting inner radius of FIB-milled tips was controlled in the range of 1.7–2.0 μm as determined by FIB, SEM, and SECM.
SECM Measurements
The procedures of SECM measurements with silicon nanopore membranes are detailed in Supporting Information of ref. 16. A SECM instrument with closed-loop piezoelectric motors (CHI 910B, CH Instruments, Austin, TX, USA) was used for approach curve measurements. The microscope was placed on a vibration isolation platform (model 63–533, TMC, Peabody, MA, USA). A two-electrode setup was employed with a Ag wire in a micropipet probe and a 1 mm-diameter AgCl-coated Ag wire as a reference/counter electrode. A micropipet tip was monitored by a video microscope to be positioned above a substrate for approach curve measurements. A pnc-Si membrane (500 μm × 500 μm) was cleaned and placed in an SECM cell such that the top and bottom solutions were identical (Figure 1). A nanoporous silicon membrane was fabricated on a Si wafer using standard microfabrication techniques1 and characterized as reported elsewhere.16 The surface of the surrounding Si wafer was used as an insulating substrate for tip characterization. All electrochemical experiments were performed at room temperature.
For SECM experiments, FIB-milled and non-milled micropipets were silanized by chlorotrimethylsilane.34, 35 The silanized micropipets were readily filled with an organic electrolyte solution from the back using a 10-μL syringe. The compositions of organic filling solutions are given in the following electrochemical cells
| (cell 1) |
| (cell 2) |
| (cell 3) |
where PBS stands for potassium phosphate buffer solution.
The SECM instrument was also operated in the mode of scanning ion conductance microscopy (SICM) to compare the roughness and alignment of FIB-milled and non-milled tips without an effect from liquid/liquid interfaces at the tips. Specifically, the direct current mode of SICM was employed to measure approach curves to an insulating surafce36 using non-silanized pipets filled with and immersed in 0.1 M KCl (see Supporting Information).
RESULTS AND DISCUSSION
FIB Milling of Micropipets
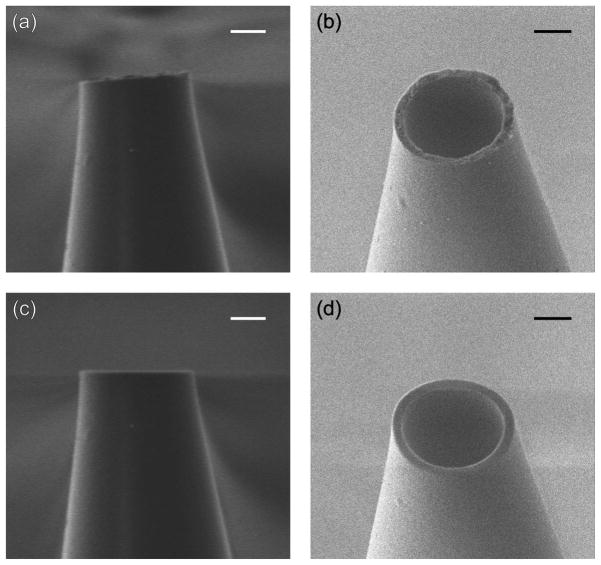
The uneven tip of heat-pulled micropipets was milled by FIB to improve their surface roughness and alignment. Before and after FIB milling, a pipet tip was imaged using the gallium-ion and electron beam microscopes of the dual beam instrument (Figure 2). Since a micropipet was not coated with a conductive film, its images were blurred by charging of the glass surface. Nevertheless, the significant roughness of an original pipet tip (typically ~100–200 nm) was clearly observed in the side view FIB image (Figure 2a). The rough surface of the whole tip was also confirmed by SEM (Figure 2b). The nanoscale surface roughness of <0.5 μm is hardly seen by optical microscopy, which is routinely used to inspect micropipet tips.32 The tip roughness, however, is significant with respect to the inner tip radius (~1–2 μm). Moreover, a pulled tip can be bent slightly from the length of a pipet (Figure 2a). Consequently, the surface roughness and imperfect alignment of a heat-pulled tip hinders its close approach to a substrate, thereby resulting in a smaller change in the tip current in SECM experiments. To overcome this limitation, the uneven tip was cut by a FIB to obtain a smoother and better-aligned tip as shown by FIB and SEM imaging of a milled tip (Figures 2c and 2d, respectively). The comparison of the FIB images of the pipet before and after milling (Figures 2a and 2c, respectively) shows that only a small portion (~350 nm) from the tapered tip was eliminated by FIB to minimize the change in the diameter of a milled tip. The improved smoothness and alignment of the FIB-milled tip of a glass micropipet was also confirmed by comparing SICM approach curves as obtained with FIB-milled and non-milled tips (see Supporting Information).
Figure 2.
A micropipet (a, b) before and (c, d) after FIB milling as observed by (a, c) FIB and (b, d) SEM imaging. Scale bars, 1 μm.
SECM Characterization of ITIES Shape at FIB-Milled Micropipets
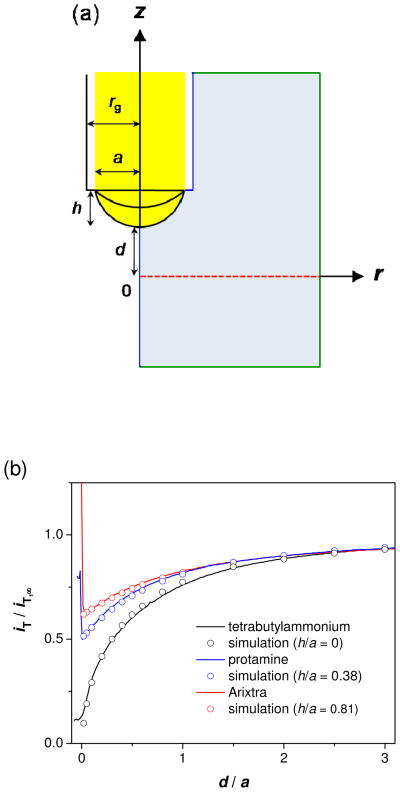
SECM approach curves to a SiO2 substrate were measured using FIB-milled pipets filled with organic electrolyte solutions to characterize the shape of the supported ITIES. The curves were compared with approach curves simulated by the finite element method (see Supporting Information) to find that the ITIES formed at the FIB-milled tip is inlaid-disk-shaped for small monovalent ions and is protruded for polyion Arixtra and protamine (Figure 3a). In SECM approach curve measurements, a Ag electrode inside an organic-filled pipet was biased at a constant potential to drive ingress ion transfer at a diffusion-limited rate. When the tip was far from the substrate, the limiting current was given by37
Figure 3.
(a) Model of SECM-induced ion transfer across a nanopore membrane (red dotted line). The black solid lines represent liquid/liquid interfaces with h/a = 0, 0.38, and 0.81 for monovalent ions, Arixtra, and protamine, respectively. The transfer of the target ions across the pipet-supported interface is diffusion-limited. The blue and green lines represent boundaries with zero normal flux and simulation space limits, respectively. The simulation space (light blue) is limited to the external solution surrounded by these boundaries while ion diffusion in the internal solution is not relevant to the tip current. (b) SECM approach curves at a SiO2 substrate for TBA+, Arixtra, and protamine in 0.1 M PBS (solid lines). The probe scan rates are 0.3, 0.23, and 0.23 μm/s, respectively. The circles for the respective ions represent approach curves simulated with impermeable membranes for a = 1.9, 1.8, and 2.0 μm.
| (1) |
where zi is the charge of the transferred ion, and D and c are its diffusion coefficient and bulk concentration in the external aqueous solution, respectively, and x depends on the geometries of the interface and tip and was obtained by the finite element simulation. When the tip was approached less than a tip diameter away from the SiO2 surface, ion diffusion to the tip was hindered by the impermeable substrate to decrease the tip current, i.e., negative feedback (Figure 3b).
A disk-shaped ITIES was formed at the tip of a FIB-milled pipet when the tip current was based on the simple transfer of the small monovalent ions listed in Table 1. The experimental approach curves of these ions fit very well with approach curves simulated for an inlaid disk interface at the tip (e.g., TBA+ in Figure 3b). The ratio of the tip inner radius, a, with respect to its outer radius, rg, was assumed to be 1.2 (= RG = rg/a) for the finite element simulation to obtain both radii from the fit. The inner and outer radii thus determined are consistent with the corresponding radii estimated from the SEM and FIB images of the tips. Moreover, eq 1 with these tip radii gives diffusion coefficients (Table 1), which agree with literature values for ClO4−,38 TBA+,39 and the other monovalent ions.40
Importantly, the disk-shaped ITIES supported by a FIB-milled pipet can be positioned closer to the substrate more consistently in comparison to the ITIES at a non-milled pipet. The current at 14 FIB-milled tips dropped to 23 ± 7% of iT,∞ before the tip current leveled off due to the contact of the SiO2 substrate with the glass orifice of the tips. This tip current corresponds to the tip–substrate distance, d, of 11 ± 7% with respect to the inner tip radius, a, i.e., ~100–200 nm for ~1–2 μm-radius tips. The rather moderate decrease in the tip current at the very short tip–substrate distance is ascribed to a thin glass wall surrounding the tip (RG = 1.2), which does not effectively suppress lateral ion flux through the gap between the tip and substrate.21 Therefore, achieving a closer tip–substrate distance is especially important in SECM approach curve experiments with a pipet tip to obtain a larger change in the tip current and also to reduce the uncertainty of the substrate position, i.e., d/a = 0, and interface geometry. In contrast, the current at 13 non-milled tips decreased only to 47 ± 14% of iT,∞ to give d of 39 ± 21% with respect to a (Figure S2). The long distance is due to the contact of the substrate with the protrusions at the rough tips. Also, the non-milled tips are less perpendicular to the pipet length to be aligned less parallel to the substrate, thereby increasing the closest tip–substrate distance.
SECM approach curves indicate that the ITIES protrudes from the orifice of a FIB-milled tip when the tip current is based on the facilitated transfers of Arixtra and protamine. For the respective ions, the tip current decreased only to ~60 and ~50 % of iT,∞ and then increased sharply as the tip approached to the insulating substrate (Figure 3b). The sudden increase in the tip current indicates that an interface deforms outward from the pipet orifice; the protruded interface contacts the substrate so that the inner organic solution is spread over the substrate surface, thereby increasing the effective interfacial area and tip current.41 In fact, approach curves for the polyions agree very well with the approach curves simulated for pipet-supported interfaces with sphere-cap geometry42 (Figure 3b). In this analysis, the height of the sphere cap, h, (see Figure 3a for its definition) was adjusted with respect to the tip inner radius while previously reported values were employed for the diffusion coefficients of Arixtra29 and protamine43 (Table 1). The simulation results indicate that the protrusion is more significant for Arixtra (h/a = 0.81) and dependent on ionic strength for protamine (h/a = 0.38 in 0.1 and 0.03 M PBS and 0.21 in 0.01 M PBS; see also Figure S3). We ascribe the outward deformation of an interface to the adsorption of polyions, ionophores, or their complexes during polyion transfers.29, 31, 32 The interfacial adsorption could increase the affinity of the organic phase to the aqueous phase, thereby yielding the meniscoid interface. The deformed interface is not simply due to pressures,34, 44 potentials,45 or solvents,41 because an interface is flat for the transfers of small monovalent ions at the same pressure, potential, and solvent as employed for polyion transfers. Overall, a protruded interface at a FIB-milled tip can approach to d/a ≈ 0, where the significant tip current is still obtained because of the lateral diffusion of polyions from the bulk solution to the protruded interface.
High Membrane Permeability to Small Monovalent Ions
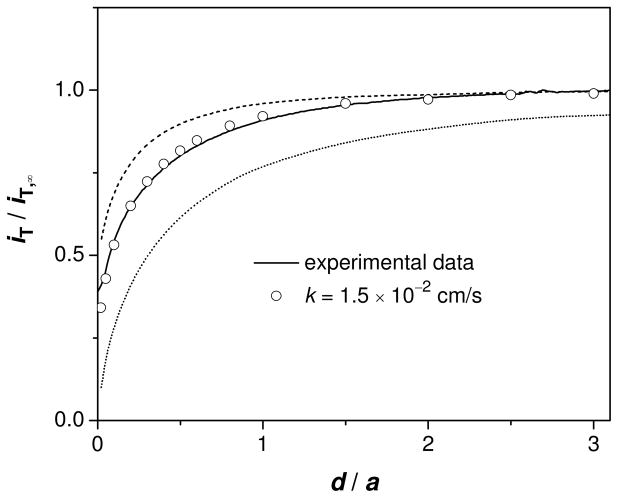
The high permeability of porous nanocrystalline silicon (pnc-Si) membranes to 6 small monovalent ions (Table 1) was measured by SECM with FIB-milled pipets. The simple transfers of these ions at the pipets filled with the DCE solution of organic supporting electrolytes (cell 1) were driven to diffusion limits and monitored amperometrically. As an organic-filled tip approached perpendicularly to a nanopore membrane in the aqueous solution, the tip current decreased gradually until the tip touched the membrane (e.g., TBA+ in Figure 4). The tip current, however, is significantly higher than the tip current based on purely negative feedback from an impermeable substrate (dotted line). The good fit of the experimental approach curve for TBA+ with a simulated approach curve gives large permeability of k = 1.5 × 10⁻² cm/s (Figure 4), which was defined by the model based on a uniformly permeable membrane (Figure S4).16 This effective permeability is much larger than the mass transfer rate of TBA+ in the stagnant layers adjacent to the membrane, D/δ = 5.1 × 10⁻⁴ cm/s, where the thickness of the stagnant layers, δ, was assumed to be 100 μm for typical bulk transport experiments.1 In contrast, the mass transfer coefficient at the 1.9 μm-radius tip, D/a = 2.7 × 10⁻² cm/s, is large enough to determine the high membrane permeability.
Figure 4.
SECM approach curve to the nanopore membrane for TBA+ in 0.1 M PBS (solid line). Probe scan rate, 0.3 μm/s. The circles represent the approach curve simulated with the k value that gives the best fit with the experimental curve. The dashed and dotted lines were simulated for freely permeable (kd = 4.2 × 10⁻² cm/s from eq 2 with l = 16 nm) and impermeable membranes, respectively. All simulated curves were obtained using (a, h/a, rg/a) = (1.7 μm, 0, 1.2).
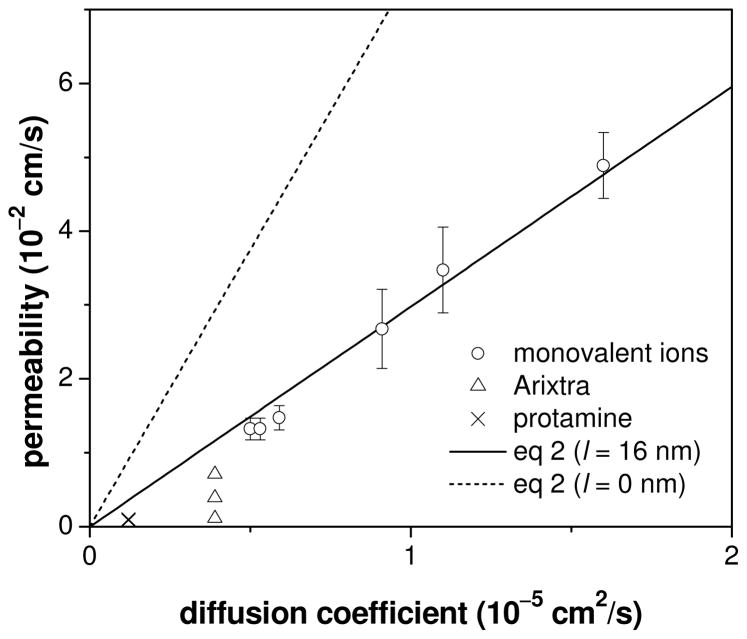
The membrane permeability to the small monovalent ions thus determined using FIB-milled tips is proportional to their diffusion coefficients in the aqueous electrolyte solution (Figure 5). This relationship was further analyzed using a heterogeneous membrane model (Figure S4), where ions are permeable only through nanopores without effects from ion size and ion–nanopore interaction. The theoretical permeability limited by free ion diffusion across water-filled nanopores, kd, is determined by the geometrical parameters of the nanopore membrane as (see Supporting Information)
Figure 5.
Plot of the membrane permeability versus the diffusion coefficients of transported ions. The corresponding diffusion coefficients are listed in Table 1. The permeability to Arixtra and protamine was measured with 0.10, 0.03, and 0.01 M PBS (see Table 2) while 0.10 M PBS was employed for monovalent ions.
| (2) |
where r̄, N, and l are the average radius, density, and length of nanopores, and σ is the porosity of the membrane. The linear fit of the plot in Figure 5 gives l = 16 nm in eq 2 with r̄ = 5.6 nm, N = 67 pores/μm2, and σ = 0.0079 as determined by TEM.16 This pore length agrees well with the membrane thickness of 15 nm determined by ellipsometry.1 The excellent agreement of eq 2 with experimentally determined permeability indicates that these monovalent ions are small enough to freely diffuse through the water-filled nanopores. Also, the pores are short enough to give the porosity term of σ/(σ + 2r̄Nl) = 0.4 in the brackets of eq 2 and, subsequently, high permeability of kd = 0.8r̄ND despite the low membrane porosity. This large ion permeability of the ultrathin nanopore membrane is controlled mainly by the access of an ion to a nanopore and is slightly compromised by its translocation through the nanopore. When the pore length is negligible, a larger kd value of 2r̄ND from eq 2 with l = 0 is determined only by the accessibility of nanopores.16 In contrast, eq 2 is equivalent to kd ≈σD/l for a thick nanopore membrane with σ ≪2r̄Nl when the translocation process controls the permeability.
It should be noted that the effect of finite pore length on permeability (eq 2) is detectable in approach curves only at short tip–substrate distances, which can be achieved using a FIB-milled micropipet. An experimental approach curve at a nanopore membrane is too negative and broad at short distances (e.g., iT/iT,∞ < 0.75 and d/a < 0.4 in the solid line of Figure 4) to be fitted with a theoretical curve for a kd value from eq 2 with l = 0 (dashed line). In contrast, the portion of the experimental curve at longer distances can be shifted laterally and fitted with the theoretical curve for l = 0, which results in the overestimation of a k value. In fact, k values for small redox molecules were overestimated in our previous study of the same nanopore membrane using a conventional 5-μm-radius Pt disk tip with RG = 8.1,16 because the current at the large tip decreased only to ~80 % of iT,∞ at the closest tip–substrate distance of d/a ≈ 0.4. The overestimated k values agreed with a simpler and less accurate formula of kd =2r̄ND, thereby underestimating the effect of finite pore length on membrane permeability.
Charge Effect on Polyanion Arixtra Transport
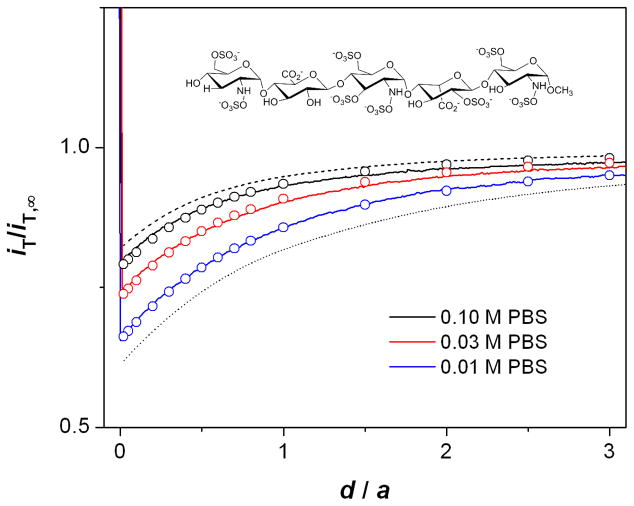
We measured approach curves for polyanion Arixtra to demonstrate the charge effect on membrane permeability. Arixtra is a synthetic anticoagulant based on a pentasaccharide with 8 sulfate and 2 carboxylate groups, which result in ~10 negative charges at pH 7 (Figure 6).29, 30 A FIB-milled pipet was filled with the NB solution of organic supporting electrolytes containing an Arixtra ionophore, DMDO, in excess (cell 2) to give well-defined limiting current based on ingress Arixtra transfer.29 As the buffer concentration decreased from 0.1 M to 0.03 M, and then to 0.01 M, approach curves with Arixtra became more negative (Figure 6). The comparison of the approach curves was made using the sharp increase in the tip current as the indicator of the contact between the protruded interface and membrane at d/a ≈ 0. A more negative approach curve at lower ionic strength corresponds to slower Arixtra transport across the nanopores. At lower ionic strength, the negative charges of both Arixtra and the natural oxide layer on the membrane surface are less screened by counter ions (K+) enhancing electrostatic repulsions between them, thereby slowing Arixtra transport.
Figure 6.
SECM approach curves to the nanopore membrane for Arixtra in 0.10, 0.03, and 0.01 M PBS (solid lines). Probe scan rate, 0.23 μm/s. The circles represent approach curves simulated with the corresponding k values in Table 2. The dashed and dotted lines were simulated for freely permeable (kd = 1.1 × 10⁻² cm/s from eq 2 with l = 16 nm) and impermeable membranes, respectively. All simulated curves were obtained using (a, h/a, rg/a) = (1.8 μm, 0.81, 1.2).
Approach curves with Arixtra at different buffer concentrations were compared with simulated approach curves to distinguish between the charge and size effects on Arixtra permeability. This kinetic analysis assumes an interface with sphere-cap geometry, which was reliably determined for FIB-milled pipets (see above). The experimental approach curves fit well with approach curves thus simulated to yield the permeability values that vary with ionic strength (Table 2). The Arixtra permeability at 0.1 M PBS is only slightly smaller than the permeability expected from eq 2 with l = 16 nm. In fact, the approach curve at 0.1 M PBS is very similar to the approach curve simulated with the corresponding kd value (red and dashed lines, respectively, in Figure 6). This result indicates that an Arixtra molecule is small enough to nearly freely diffuse through the nanopores. In contrast, Arixtra permeability at 0.01 M PBS is ~10 times smaller than the diffusion-limited permeability, which is due to the charge effect. Noticeably, rapid SECM-induced mass transport of Arixtra is necessary for the detection of the charge effect on its membrane transport in the relatively high ionic-strength solution (0.06 M), where the electrostatically hindered Arixtra transport (k = 1.1 × 10⁻³ cm/s) is still significantly faster than its mass transfer in the stagnant layers (D/δ = 3.9 × 10⁻⁴ cm/s with δ = 100 μm).
Table 2.
Dependence of Polyion Permeability on Buffer Concentration
| PBS concentration (M) | permeability (cm/s) | |
|---|---|---|
| Arixtra | Protamine | |
| 0.10 (0.60)a | 7.1 × 10⁻³ | 1.0 × 10⁻³ |
| 0.03 (0.18)a | 3.9 × 10⁻³ | 9.0 × 10⁻⁴ |
| 0.01 (0.06)a | 1.1 × 10⁻³ | 8.4 × 10⁻⁴ |
| – | 1.1 × 10⁻²b | 2.8 × 10⁻³b |
Ionic strength is given in the brackets.
Permeability calculated from eq 2 with l = 16 nm.
Size Effect on Polypeptide Protamine Transport
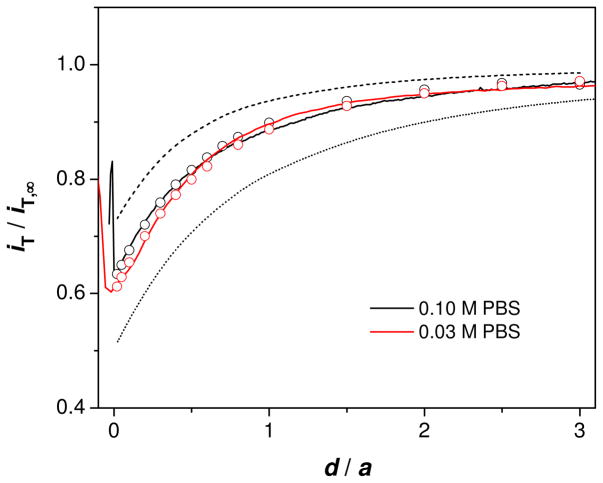
Finally, we demonstrate the effect of molecular size on membrane permeability by employing protamine, a polypeptide (~4.5 kDa) with ~20 positive charges based on arginine residues. With the excess amount of a protamine ionophore, DNNS, in the inner DCE phase (cell 3), amperometric protamine transfer across the pipet-supported DCE/water interface gives well-defined limiting current.31, 32 As the FIB-milled tip approached to the nanopore membrane, the tip current gradually decreased to ~60 % of iT,∞ and then increased sharply (0.1 and 0.03 M PBS in Figure 7 and 0.01 M PBS in Figure S3). The sharp current increase corresponds to the contact of the protruded DCE/water interface with the nanopore membrane. Moreover, the experimental approach curves fit very well with approach curves simulated for the ITIES with sphere-cap geometry (Figures 7 and S3). Noticeably, the permeability thus determined is ~3 times smaller than the theoretical diffusion-limited permeability expected from eq 2 with l = 16 nm (Table 2). This difference between the experimental and theoretical permeability is clearly detectable as different approach curves (solid and dashed lines, respectively, in Figures 7 and S3).
Figure 7.
SECM approach curves to the nanopore membrane for protamine in 0.10 and 0.03 M PBS (solid lines). Probe scan rate, 0.23 μm/s. The circles represent simulated approach curves with the corresponding k values in Table 2. The dashed and dotted lines were simulated for freely permeable (kd = 2.8 × 10⁻³ cm/s from eq 2 with l = 16 nm) and impermeable membranes, respectively. All simulated curves were obtained using (a, h/a, rg/a) = (2.0 μm, 0.38, 1.2).
It should be noted that protamine transport is not affected by the adsorption of polycationic protamine molecules on the negatively charged oxide layer of the pore wall46 when a low concentration (20 μM) of protamine is present in PBS solutions. One may expect that adsorbed protamine molecules are transported slowly or hinder the transport of other protamine molecules sterically and elecrostatically. These effects of electrostatic protamine adsorption, however, are minimal because the protamine permeability is nearly independent of ionic strength (Table 2). Moreover, nanopores are not significantly blocked by adsorbed protamine molecules because the permeability to TBA+ as obtained using an ionophore-free micropipet were unaffected by the addition of 20 μM protamine to 0.10 M PBS solution (data not shown). The successful detection of TBA+ in the presence of protamine represents the advantage of ion-selective micropipet tips.
Overall, protamine molecules are not small enough to freely diffuse across the nanopores with the average radius (5.6 nm) that is 2.8 times larger than their hydrodynamic radius (2.0 nm) as estimated from their diffusion coefficient in PBS (Table 1). This size effect on protamine permeability results from ~850 nanopores under a 2 μm-radius tip. Since the radii of the nanopores are distributed from 1.5 nm to 10 nm relatively uniformly,16 the protamine transport though smaller pores is more significantly hindered. Interestingly, the size effect was observed for protamine, which has a ~15 and ~33 times smaller molecular weight than the blood proteins, bovine serum albumin and immunoglobulin-γ, respectively, that demonstrated the size effect in the previous bulk transport experiments.1 The transport of protamine is less hindered because of its smaller size and negligible adsorption to the nanopore wall in contrast to bovine serum albumin, which adsorbs to the pnc-Si membrane.1 Therefore, the sterically hindered transport of protamine (k = 8.4 × 10⁻⁴ cm/s) is still much faster than its mass transport rate in the stagnant layers, D/δ = 1.2 × 10⁻⁴ cm/s (δ = 100 μm), thereby requiring the SECM approach for the detection of the weak size effect.
CONCLUSIONS
This SECM study of the pnc-Si membrane successfully provides quantitative information about its permeability to ions with various charges and sizes. This information is paramount for the analytical, biomedical, and biotechnology device applications of the novel nanoporous material. Ion permeability varies by two orders of magnitude in the range of 5.9 × 10⁻²–8.4 × 10⁻⁴ cm/s depending on molecular size and charge and the ionic strength of the solution, demonstrating significant selectivity. The SECM approach is required for the measurements of these permeability values, which exceed the corresponding mass transport rates in the stagnant layers adjacent to the membrane. Selectivity based on the free diffusion of small monovalent ions through the nanopores is simply dependent on their diffusion coefficients and is represented by the equation (eq 2) only with geometric parameters including the average radius, density, and length of nanopores, and membrane porosity. This relationship also indicates that the ion permeability of the ultrathin nanopore silicon membrane is mainly controlled by the access of an ion to a nanopore and only weakly affected by its translocation through the nanopore. Moreover, the size effect on permeability can be readily detected using eq 2 and distinguished from the charge effect at high ionic strength as exemplified for protamine and Arixtra. For the respective ions, permeability was decreased by factors of 3 and 10 due to the size and charge effects.
Micropipet-supported ITIES tips with two novel features were developed and applied in this study to advance the SECM approach for permeability measurement and also enhance the applicability of this powerful electroanalytical method. FIB-milled micropipets with a smoother and better-aligned tip were employed to more accurately and precisely determine the large ion permeability of the ultrathin nanopore silicon membrane. The FIB-milled tips can approach closer to a substrate to give SECM approach curves with much less uncertainties of the tip–substrate distance and geometry of a tip-supported liquid/liquid interface. The high quality tips fabricated by FIB will be useful for various kinetic studies by SECM. In addition, this work demonstrates that redox-inactive ions with large molecular weights (up to 4.5 kDa) can be used for SECM experiments by employing micropipet tips. Biological and synthetic polyions including DNAs, proteins, and dendrimers with molecular weights of up to ~20 kDa are voltammetrically or amperometrically detectable at the ITIES30 to potentially widen the range of the target molecules that can be probed by SECM using micropipet tips. Another important advantage of a pipet probe is its potential for miniaturization to nanometer scale,47 which improves the spatial48 and time28 resolutions of SECM.
Supplementary Material
Acknowledgments
This work was supported by grants from the National Institutes of Health (GM073439), and the Petersen Institute of NanoScience and Engineering at the University of Pittsburgh. We thank Prof. Henry S. White, Department of Chemistry, University of Utah, for his valuable comments on the effect of nanopore length on membrane permeability.
Footnotes
SUPPORTING INFORMATION AVAILABLE
Additional information as noted in text. This material is available free of charge via the Internet at http://pubs.acs.org.
References
- 1.Striemer CC, Gaborski TR, McGrath JL, Fauchet PM. Nature. 2007;445:749–753. doi: 10.1038/nature05532. [DOI] [PubMed] [Google Scholar]
- 2.Vandezande P, Gevers LEM, Vankelecom IFJ. Chem Soc Rev. 2008;37:365–405. doi: 10.1039/b610848m. [DOI] [PubMed] [Google Scholar]
- 3.Shannon MA, Bohn PW, Elimelech M, Georgiadis JG, Marinas BJ, Mayes AM. Nature. 2008;452:301–310. doi: 10.1038/nature06599. [DOI] [PubMed] [Google Scholar]
- 4.Kooman JP, van der Sande FM, Leunissen KML. Blood Purification. 2007;25:377–382. doi: 10.1159/000107774. [DOI] [PubMed] [Google Scholar]
- 5.Adiga SP, Curtiss LA, Elam JW, Pellin MJ, Shih CC, Shih CM, Lin SJ, Su YY, Gittard SA, Zhang J, Narayan RJ. JOM. 2008;60:26–32. [Google Scholar]
- 6.Van den Berg A, Wessling M. Nature. 2007;445:726. doi: 10.1038/445726a. [DOI] [PubMed] [Google Scholar]
- 7.Schoch RB, Han JY, Renaud P. Rev Mod Phys. 2008;80:839–883. [Google Scholar]
- 8.Han JY, Fu JP, Schoch RB. Lab Chip. 2008;8:23–33. doi: 10.1039//b714128a. [DOI] [PMC free article] [PubMed] [Google Scholar]
- 9.Kang LF, Chung BG, Langer R, Khademhosseini A. Drug Discovery Today. 2008;13:1–13. doi: 10.1016/j.drudis.2007.10.003. [DOI] [PMC free article] [PubMed] [Google Scholar]
- 10.Fu JP, Mao P, Han J. Trends Biotechnol. 2008;26:311–320. doi: 10.1016/j.tibtech.2008.02.009. [DOI] [PubMed] [Google Scholar]
- 11.Agrawal AA, Nehilla BJ, Reisig KV, Gaborski TR, Fang DZ, Striemer CC, Fauchet PM, McGrath JL. Biomaterials. 31:5408–5417. doi: 10.1016/j.biomaterials.2010.03.041. [DOI] [PubMed] [Google Scholar]
- 12.Wang G, Zhang B, Wayment JR, Harris JM, White HS. J Am Chem Soc. 2006;128:7679–7686. doi: 10.1021/ja061357r. [DOI] [PubMed] [Google Scholar]
- 13.Cervera J, Ramirez P, Manzanares JA, Mafe S. Microfluid Nanofluid. 2010;9:41–53. [Google Scholar]
- 14.Bard AJ, Mirkin MV, editors. Scanning Electrochemical Microscopy. Marcel Dekker; New York: 2001. [Google Scholar]
- 15.Amemiya S, Bard AJ, Fan FRF, Mirkin MV, Unwin PR. Ann Rev Anal Chem. 2008;1:95–131. doi: 10.1146/annurev.anchem.1.031207.112938. [DOI] [PubMed] [Google Scholar]
- 16.Kim E, Xiong H, Striemer CC, Fang DZ, Fauchet PM, McGrath JL, Amemiya S. J Am Chem Soc. 2008;130:4230–4231. doi: 10.1021/ja711258w. [DOI] [PMC free article] [PubMed] [Google Scholar]
- 17.Bath BD, White HS, Scott ER. In: Scanning Electrochemical Microscopy. Bard AJ, Mirkin MV, editors. Marcel Dekker; New York: 2001. pp. 343–395. [Google Scholar]
- 18.Tsionsky M, Zhou J, Amemiya S, Fan FRF, Bard AJ, Dryfe RAW. Anal Chem. 1999;71:4300–4305. doi: 10.1021/ac9903858. [DOI] [PubMed] [Google Scholar]
- 19.Guo J, Amemiya S. Anal Chem. 2005;77:2147–2156. doi: 10.1021/ac048370j. [DOI] [PubMed] [Google Scholar]
- 20.Barker AL, Macpherson JV, Slevin CJ, Unwin PR. J Phys Chem B. 1998;102:1586–1598. [Google Scholar]
- 21.Shao Y, Mirkin MV. J Phys Chem B. 1998;102:9915–9921. [Google Scholar]
- 22.Sun P, Zhang ZQ, Gao Z, Shao YH. Angew Chem Int Ed. 2002;41:3445–3448. doi: 10.1002/1521-3773(20020916)41:18<3445::AID-ANIE3445>3.0.CO;2-H. [DOI] [PubMed] [Google Scholar]
- 23.Amemiya S, Bard AJ. Anal Chem. 2000;72:4940–4948. doi: 10.1021/ac0004207. [DOI] [PubMed] [Google Scholar]
- 24.Zhan DP, Li X, Zhan W, Fan F-RF, Bard AJ. Anal Chem. 2007;79:5225–5231. doi: 10.1021/ac070318a. [DOI] [PubMed] [Google Scholar]
- 25.Zhan DP, Fan F-RF, Bard AJ. Proc Natl Acad Sci USA. 2008;105:12118–12122. doi: 10.1073/pnas.0805286105. [DOI] [PMC free article] [PubMed] [Google Scholar]
- 26.Yao N, editor. Focused Ion Beam Systems: Basics and Applications. Cambridge University Press; NY: 2007. [Google Scholar]
- 27.Hu J, Holt KB, Foord JS. Anal Chem. 2009;81:5663–5670. doi: 10.1021/ac9003908. and references cited therein. [DOI] [PubMed] [Google Scholar]
- 28.Sun P, Mirkin MV. Anal Chem. 2006;78:6526–6534. doi: 10.1021/ac060924q. [DOI] [PubMed] [Google Scholar]
- 29.Rodgers PJ, Jing P, Kim Y, Amemiya S. J Am Chem Soc. 2008;130:7436–7442. doi: 10.1021/ja800568q. [DOI] [PubMed] [Google Scholar]
- 30.Jing P, Kim Y, Amemiya S. Langmuir. 2009;25:13653–13660. doi: 10.1021/la902336w. [DOI] [PubMed] [Google Scholar]
- 31.Yuan Y, Amemiya S. Anal Chem. 2004;76:6877–6886. doi: 10.1021/ac048879e. [DOI] [PubMed] [Google Scholar]
- 32.Rodgers PJ, Amemiya S. Anal Chem. 2007;79:9276–9285. doi: 10.1021/ac0711642. [DOI] [PubMed] [Google Scholar]
- 33.Guo J, Amemiya S. Anal Chem. 2006;78:6893–6902. doi: 10.1021/ac061003i. [DOI] [PubMed] [Google Scholar]
- 34.Shao Y, Mirkin MV. Anal Chem. 1998;70:3155–3161. doi: 10.1021/ac980244q. [DOI] [PubMed] [Google Scholar]
- 35.Amemiya S, Yang X, Wazenegger TL. J Am Chem Soc. 2003;125:11832–11833. doi: 10.1021/ja036572b. [DOI] [PubMed] [Google Scholar]
- 36.Edwards MA, Williams CG, Whitworth AL, Unwin PR. Anal Chem. 2009;81:4482–4492. doi: 10.1021/ac900376w. [DOI] [PubMed] [Google Scholar]
- 37.Zoski CG, Mirkin MV. Anal Chem. 2002;74:1986–1992. doi: 10.1021/ac015669i. [DOI] [PubMed] [Google Scholar]
- 38.Kim Y, Amemiya S. Anal Chem. 2008;80:6056–6065. doi: 10.1021/ac8008687. [DOI] [PubMed] [Google Scholar]
- 39.Gavach C, Henry F. J Electroanal Chem. 1974;54:361–370. [Google Scholar]
- 40.Wilke S, Zerihun T. J Electroanal Chem. 2001;515:52–60. [Google Scholar]
- 41.Lin CL, Rodríguez-López J, Bard AJ. Anal Chem. 2009;81:8868–8877. doi: 10.1021/ac901434a. [DOI] [PubMed] [Google Scholar]
- 42.Lindsey G, Abercrombie S, Denuault G, Daniele S, De Faveri E. Anal Chem. 2007;79:2952–2956. doi: 10.1021/ac061427c. [DOI] [PubMed] [Google Scholar]
- 43.Yuan Y, Wang L, Amemiya S. Anal Chem. 2004;76:5570–5578. doi: 10.1021/ac0493774. [DOI] [PubMed] [Google Scholar]
- 44.Benvidi A, Lanjwani SN, Ding Z. J Electroanal Chem. 2010;641:99–103. [Google Scholar]
- 45.Dale SEC, Unwin PR. Electrochem Commun. 2008;10:723–726. [Google Scholar]
- 46.Jacobson BS, Cronin J, Branton D. Biochim Biophys Acta. 1978;506:81–96. doi: 10.1016/0005-2736(78)90436-4. [DOI] [PubMed] [Google Scholar]
- 47.Wang Y, Velmurugan J, Mirkin MV, Rodgers PJ, Kim J, Amemiya S. Anal Chem. 2010;82:77–83. doi: 10.1021/ac902244s. [DOI] [PubMed] [Google Scholar]
- 48.Laforge FO, Velmurugan J, Wang Y, Mirkin MV. Anal Chem. 2009;81:3143–3150. doi: 10.1021/ac900335c. [DOI] [PubMed] [Google Scholar]
Associated Data
This section collects any data citations, data availability statements, or supplementary materials included in this article.


