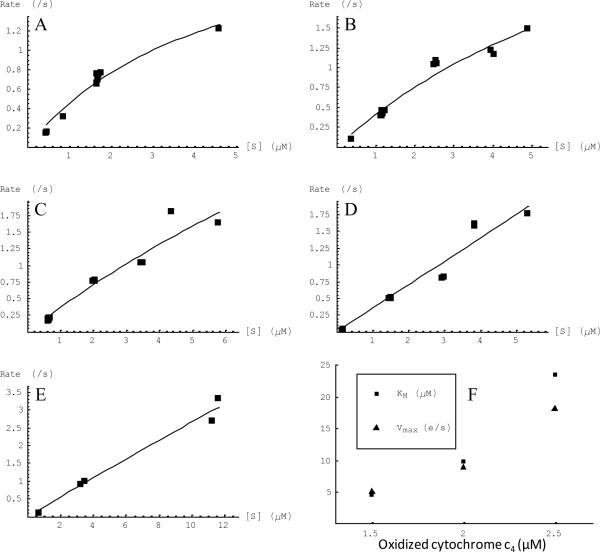
Figure 5.
The rates of oxidation of reduced cytochrome c4 by the cbb3 oxygen reductase from V. cholerae at different oxidized cytochrome c4 concentrations determined by stopped-flow spectroscopy and least square fitting. The substrate [S] refers to reduced (not total) cytochrome c4. The oxidized cytochrome c4 concentrations were (A)1.5 μM; (B) 2.0 μM, (C) 2.5 μM; (D) 3.0 μM and (E) 7.5 μM. The curves show the non-linear least square fitting of the points to Michaelis-Menten kinetics. The KM and Vmax values for 1.5 μM, 2.0 μM and 2.5 μM oxidized cytochrome c4 are plotted in (F).

