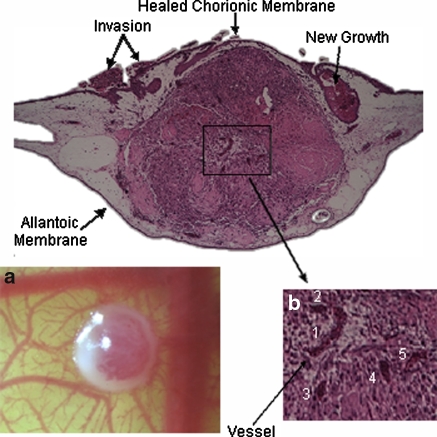
Fig. 1.
a Top view of tumor spheroid and CAM interface—a 1 mm diameter ACBT glioblastoma spheroid inside CAM (mesoderm) on live chicken embryo on day 14 EA; b H&E histological section of 1 mm diameter glioblastoma spheroid embedded in CAM. Grey area is the CAM; center region in purple denotes the tumor spheroid. Other purple regions denote tumor cells. Tumor microvasculature as a result of angiogenesis (1–5), and new tumor invaded regions are observed

