Abstract
A perspective on systems containing many action potential waves that, individually, are prone to spiral wave breakup is proposed. The perspective is based on two quantities, “predator” and “prey,” which we define as the fraction of the system in the excited state and in the excitable but unexcited state, respectively. These quantities exhibited a number of properties in both simulations and fibrillating canine cardiac tissue that were found to be consistent with a proposed theory that assumes the existence of regions we call “domains of influence,” each of which is associated with the activity of one action potential wave. The properties include (i) a propensity to rotate in phase space in the same sense as would be predicted by the standard Volterra-Lotka predator-prey equations, (ii) temporal behavior ranging from near periodic oscillation at a frequency close to the spiral wave rotation frequency (“type-1” behavior) to more complex oscillatory behavior whose power spectrum is composed of a range of frequencies both above and, especially, below the spiral wave rotation frequency (“type-2” behavior), and (iii) a strong positive correlation between the periods and amplitudes of the oscillations of these quantities. In particular, a rapid measure of the amplitude was found to scale consistently as the square root of the period in data taken from both simulations and optical mapping experiments. Global quantities such as predator and prey thus appear to be useful in the study of multiple spiral wave systems, facilitating the posing of new questions, which in turn may help to provide greater understanding of clinically important phenomena such as ventricular fibrillation.
I. INTRODUCTION
Cardiac rhythm disorders such as ventricular fibrillation are a major source of mortality in the United States. Many of these disorders may be caused by rotating action potential waves called spiral waves and their subsequent breakup into additional spiral waves. Much progress has been made on the microscopic dynamics underlying cardiac rhythm (i.e., ion channel dynamics) and intermediate-scale dynamics (i.e., individual spiral waves). However, characterization of the macroscopic dynamics, including the global behavior of multiple spiral waves, remains elusive.
Others have studied systems containing many waves. Bub et al. [1] observed a transition from no spiral waves, to small numbers of spiral centers with a constant interbeat interval, to fractured, multiple spirals in cultured cell monolayers as the plating density or intercellular connectivity was changed. Jung et al. [2] described a statistics-based method for characterizing spatiotemporal turbulence. When applied to a cellular excitable medium model or astrocyte syncytium [3], it revealed a power-law scaling of the size distribution of coherent space-time structures for the state of spiral turbulence. Xie et al. [4] studied the coexistence of stable spiral waves with independent frequencies in a heterogeneous excitable medium and concluded that multiple spiral waves could coexist because they are “insulated” from each other by chaotic regions generated by wave conduction block. Samie et al. [5] showed evidence that multiple reentrant circuits with different frequencies can exist in the heart during ventricular fibrillation.
The present study continues research on the multiple-spiral-wave system from a large-scale perspective, with the goal of identifying features that are characteristic of the system as a whole. Our goal was to develop improved intuition into the complex behavior of these systems for possible application to the study and diagnosis of cardiac tissue during fibrillation. Accordingly, we focused our study on two quantities that are defined from the state of the entire system. The two quantities bear a resemblance to the classical predator and prey quantities. Predator-prey-based models originated from studies in ecosystems, but have since been applied to diverse fields such as tumor cell dynamics [6], the immune response [7–9], epidemiology [10], and economics [11]. Even excitable media have been studied using predator-prey models, but only at the microscopic level to the best of our knowledge (e.g., Savill and Hogeweg [12], Biktashev et al. [13]). Here, we apply the predator-prey concept at the macroscopic level to the complete system. In our model, the collection of all cells within all the action potentials plays the role of the predator, while the excitable cells play the role of the prey.
The paper is organized as follows: In Sec. II, we discuss the computer simulations we use, the definitions of the predator and prey quantities, and the diagnostics employed. In Sec. III, we demonstrate that the system of spiral waves behaves quite differently depending on the amplitude of the oscillation of the predator and prey quantities. The behaviors observed are linked to electrical restitution dynamics and are labeled as “type-1” (during small amplitude oscillation) and “type-2” (when the amplitude is large). We also describe the behavior of trajectories in predator-prey phase space, including its propensity towards one sense of rotation as opposed to the other. We also show a remarkable relationship between the amplitude and frequency of the oscillation of the predator quantity that appears over both short and long time scales. In Sec. IV, we suggest possible theoretical explanations for the behavior observed. We introduce a concept we call “domains of influence” and discuss how the wave dynamics within these domains can lead to rotation in phase space, the two types of behavior, and the amplitude versus frequency relationship. Finally, in Sec. V, we offer a summary and some possible future directions.
II. METHODS
Our study is based on the data generated by two different computer simulation models of action potential propagation and on data from optical mapping experiments on canine hearts. Separate definitions for our predator and prey quantities were developed for each of these three systems, allowing them to be tailored to the nature of the action potential profiles exhibited by each. The two quantities were then studied using a variety of tools borrowed largely from the field of nonlinear dynamics.
A. Simulations
The two simulations employed in this study differ primarily in the local dynamical models used to represent the ion channel dynamics. These simulations were run with a variety of parameters to provide some confidence that key results apply generally to excitable media. In varying these parameters, we kept in mind that our primary interest was to develop insight into what could be potentially applicable to fibrillation. Thus, we concentrated on parameter regimes in which individual rotating waves are susceptible to spiral wave breakup, thought to be a necessary ingredient in the development of fibrillatory activity.
For a large number of our simulations, we employed Fenton and Karma’s 3V-SIM model [14]. Many of these simulations were conducted with a set of parameters we call the “default” parameters. These parameters were chosen to maximize the propensity for spiral waves to break as they rotated, while at the same time minimizing the tendency of the spiral wave cores to meander. These were determined for an earlier project [15] to be gfi = 1.75, τr = 33.83, τsi = 29, τo = 12.5, , uc = 0.13, uυ =0.04, ucsi = 0.861, k = 10, and D = 0.002 cm2/ms with τd = c/gfi, where c, the membrane capacitance per unit area, is equal to 1 µF/cm2. (Note that the definitions of here and in [16] are interchanged compared to the definitions in [14]. Also, note that these default parameter values differ from those in the original paper [14].) Time is in units of ms, space quantities are defined in units of cm, and conductances are in mS/cm2.
Some simulations employed the model of Fox, McHarg, and Gilmour (FMG) [17], which is a more detailed ion channel model of canine cardiac ventricular muscle. The parameters used here were the same as those described in [17] with the exception of ḠKr, which was set to 0.0068 mS/µF, half its published value. This was done to promote vigorous spiral wave breakup.
Our main interest was the dynamics of the spiral waves themselves; accordingly, for the system geometry, we employed a simple square system large enough to support many waves. The equations for both models were thus solved on a rectangular spatial grid with time advances calculated using the forward Euler method. The spatial coupling term D∇2u was approximated at each grid point (i, j) using a standard five-point differencing scheme, where u is the membrane potential. For the 3V-SIM model, we set D = 0.002 cm2/ms and used a fixed time-step size Δt = 0.1 ms, with grid spacings of Δx = Δ y = 0.03 in the x and y directions, respectively. Unless otherwise stated, the system size for the 3V-SIM simulations was 6 cm square. For the FMG model a fixed time step of Δt = 0.02 ms was used with a grid spacing Δx = Δy = 0.015 cm and diffusion coefficient D = 0.001 cm2/ms.
All simulations were started with no-flow boundary conditions (i.e., ∂u/∂n = 0, where n represents the direction normal to the boundary). A single spiral wave was initiated in the 3V-SIM system using the standard cross-field stimulation technique. In the FMG simulations spiral waves were initiated by setting a portion of the system back to the resting state while a plane wave was propagating across the system, thus creating a wave break. The wave then rotated around this point, thus creating a spiral wave. Other methods were also used to initiate a spiral wave in a few of the 3V-SIM simulations. No dependence of the long-term behavior of the system on the method used to initiate the first spiral wave was noted.
Following the creation of the spiral wave, we waited for approximately three spiral wave rotation periods, allowing the spiral wave to establish itself. Then, at time t = 650 ms (3V-SIM) or t = 600 ms (FMG), we switched the boundary conditions from no-flow to periodic [i.e., u(x = 0, y) = u(x = L, y) for all y and u(x, y = 0) = u(x, y = L) for all x, L being the system size in the x or y directions] for the remainder of the simulation. Systems with periodic boundary conditions effectively have no boundaries—action potentials that propagate out one boundary seamlessly reenter the simulation from the opposite boundary. This was done because we were not interested in the interactions between spiral waves and boundaries, only in interactions between spiral waves and themselves.
To generate many simulations within the same 3V-SIM dynamical system, we randomized how the spiral wave was started from one simulation to the next. The width of the strip associated with the second stimulus used in cross-field stimulation was randomly chosen between 33.3% and 83.3% of the total horizontal width of the simulation region. Additionally, the timing of the second stimulus was randomly chosen to be between 349.6 ms and 361.6 ms after the first stimulus. The ranges of both random choices were chosen so as to guarantee that a spiral wave would be formed.
B. Optical mapping experiments
To perform the optical mapping experiments, adult beagle canine hearts were prepared in vitro using experimental procedures that have been approved by the Institutional Animal Care and Use Committee of the Center for Research Animal Resources at Cornell University. Briefly, the right coronary artery was cannulated at its origin using polyethylene tubing. The right atrial and ventricular myocardium perfused by that artery were then excised. The preparation was then suspended in a heated tissue chamber with either the endocardial or epicardial surface of the right ventricle facing up towards the camera. Oxygenation was established through both superfusion and perfusion via the coronary artery using Tyrode solution. Following equilibration, the preparation was stained with the voltage-sensitive dye Di-4-ANEPPS (10 µM). Ventricular fibrillation was induced by rapid pacing (cycle lengths = 80–200 ms) via a bipolar electrode pressed against the surface of the preparation. For purposes of imaging, reduction of mechanical motion was accomplished either through reduction of the Tyrode calcium concentration to 0.125 mM or through the introduction of the electromechanical uncoupler blebbistatin (20 µM) [18]. Optical recordings were created using excitation light produced by 16 high-performance light-emitting diodes (Luxeon III star, LXHL-FM3C, wavelength 530 ± 20 nm), coupled to collimator lenses (Luxeon, LXHL-NX05) and driven by a low-noise constant-current source. The fluorescence emission light was collected by a Navitar lens (DO-2595, focal length 25 mm, F-stop 0.95), passed through a long-pass filter (<610 nm), and imaged by a 128 × 128 back-illuminated EMCDD array (electron-multiplied charge coupled device, Photometrics Cascade 128+). The signal was digitized with a 16-bit analog-to-digital (A/D) converter at a frame rate of 511 Hz (full frame, 128 × 128 pixels, representing a typical field of view of 6 × 6 cm2). The PCI interface provided high-bandwidth uninterrupted data transfer to the host computer.
The data were divided into records 200 time samples long. The time record of each pixel was normalized to the unit interval. A moving average of length five time samples was then calculated, and spatial averaging was applied using the four nearest neighbors. The records were then renormalized to the interval [0, 1] and subtracted from 1, so that 0 and 1 corresponded to the lowest and highest membrane potentials, respectively. This study concentrated on either the epicardial or endocardial surface of the right ventricle; accordingly, all pixels outside this region of interest were masked out prior to analysis.
C. Predator and prey quantities
We define the predator quantity D(t) to be the fraction of system cells in the excited state—that is, inside an action potential—at time t. Similarly, we define the prey quantity Y(t) to be the fraction of cells that are excitable, but not excited (i.e., not in an action potential and not refractory) at time t. The idea here is that cells in the action potential (i.e., the predator cells) are all capable of exciting (“eating”) excitable cells (i.e., the prey cells). Without prey around, predator cells will eventually die off, as is the case along the trailing edge of the action potential. Following a refractory period, dead cells will spontaneously regenerate, becoming prey cells again. This analogy suggests that the fraction of excited and excitable cells should behave roughly like the predator and prey variables in the well-known predator-prey system of ordinary differential equations; see, for example, [19].
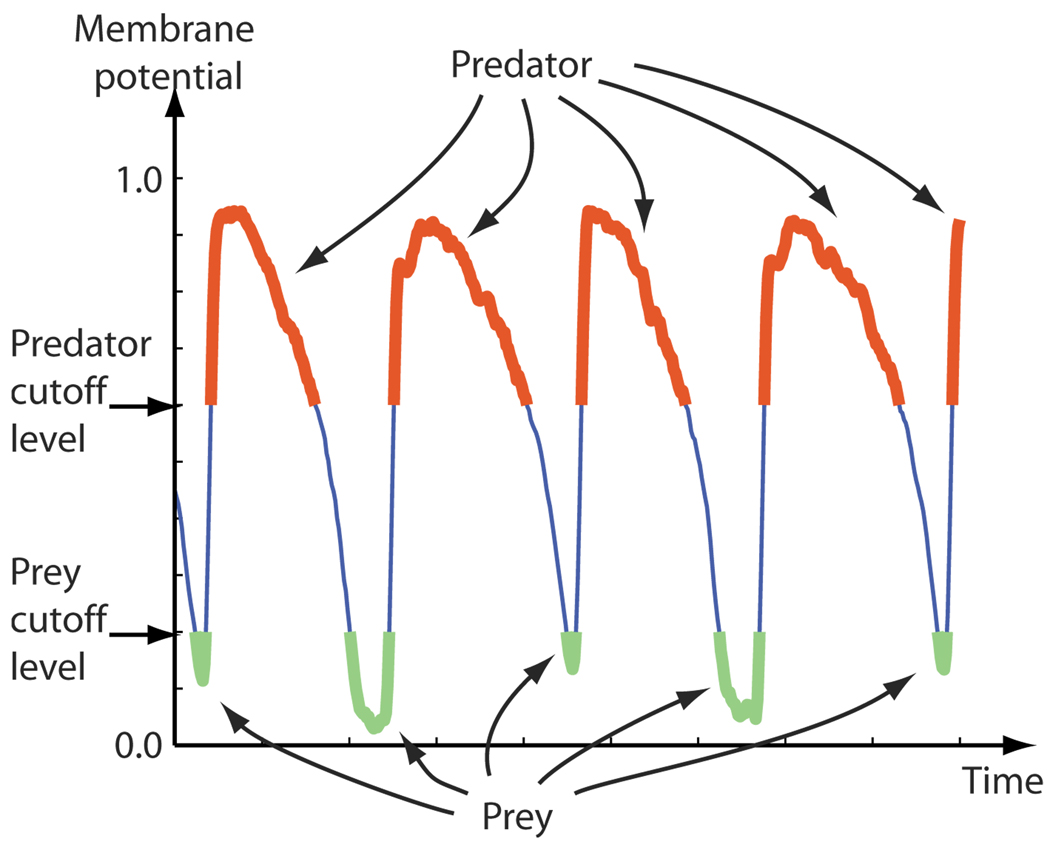
In our optical mapping data, we defined pixels to be in the predator (i.e., excited) state if their values were greater than 0.60 as illustrated in Fig. 1. The choice of 0.60 was somewhat arbitrary; we found that the dynamics of the predator quantity was generally not sensitive to the exact choice—thus, any reasonable choice for the definition of “excited” could have been used. Similarly, pixels with values less than 0.20 or 0.12, depending on the appearance of the data, were defined to be in the prey state.
FIG. 1.
(Color online) Definitions of the predator and prey states as applied to the time record of a single pixel taken from typical filtered optical mapping data. The pixel was considered to be in the predator or prey state when the optical signal, assumed to represent the membrane potential, was above or below fixed cutoff levels. Here the data were normalized and inverted so that 0.0 and 1.0 represented the minimum and maximum observed membrane potentials, respectively, for the given pixel. The predator and prey quantities D(t) and Y(t), at any given time t, were then defined to be the fraction of cells in the predator and prey states at time t.
For the 3V-SIM model, we defined cells to be in the predator state if the membrane potential u was greater than or equal to 0.7, since u ≥ 1 corresponded to a fully excited cell, while u ≈ 0 in the resting state. Similarly, when the gating variable υ was greater than 0.6 and u < 0.6, we considered the cell to be sufficiently recovered to be labeled as “excitable” and thus part of the prey population.
For the FMG model, cells with membrane potential greater than −20 mV were considered to be in the predator state. Cells were defined to be in the prey state when the membrane potential was decreasing with time and had value less than −80 mV.
D. Diagnostics
Diagnostics for this study included standard plots of the predator and prey quantities versus time, the predator and prey quantities versus each other (i.e., phase space plots), and snapshots of the membrane potential V vs x and y at various times. We also employed the following two types of diagnostics.
Phase space density
The predator and prey quantities D(t) and Y(t) were sometimes observed to spend most of their time in small regions of predator-prey (D-Y) phase space. We quantified this by calculating a phase space density quantity—i.e., an estimate of the relative fraction of time the system point spends in the various regions of phase space. The phase space was divided up into an nD by nY rectangular array of rectangular bins, each of size 1/nD by 1 / nY, where nD and nY are the number of bins in the predator and prey directions in phase space, respectively. nD = nY = 50 provided adequate resolution for our purposes. The phase-space density as a function of phase space location was then calculated from
| (1) |
where Di = i/nD, Yj = j / nY, i = 1, …, nD, j = 1, …, nY, the sum over s is a sum over Ns = 48 3V-SIM default simulations, all of which were run with the same dynamics, but with randomized initial conditions as described above, n is the time-step index, and δ(i, j) is the Kronecker delta, equal to 1 if i = j and 0 otherwise. The functions is(n) and js(n) are the values of D(nΔt)nD and Y(nΔt)nY, respectively, rounded up to the nearest integer, for the sth simulation. The sum over time steps starts with a time step chosen to be well after the switch of the system to periodic boundary conditions, while is a time step beyond which extinction of action potentials is guaranteed to occur in the sth simulation. We chose to be the first time step in the sth simulation for which u over the entire system falls below uc/2 = 0.065.
Mean time to extinction
We also observed that action potential propagation activity tends to persist for much longer periods of time when the system occupied certain regions of predator-prey phase space. To verify this assertion, we calculated the mean time to cessation of all action potential activity as a function of current phase space location. Specifically, we evaluated the following:
| (2) |
as a measure of the mean time remaining before extinction, given that the current location of the system in phase space was at (Di, Yj).
III. RESULTS
As our primary interest was to develop insight that could be potentially useful to cardiac fibrillation, we concentrated on the behavior of excitable media in a regime in which individual rotating waves were susceptible to spiral wave breakup.
A. Types of behavior exhibited by the predator and prey quantities
We found that the amplitudes of the oscillations of the predator and prey quantities varied quite significantly over time and that the type of behavior exhibited by the system and by the predator and prey quantities was generally quite different depending on how large these amplitudes were. Accordingly, we found it convenient to define two behavioral types that we will refer to as types 1 and 2, which correspond to the behavior characteristic of small- and large-amplitude oscillations, respectively. It was also not unusual to see behavior intermediate between these two types, which typically was associated with intermediate amplitudes of oscillation. The two behavioral types were particularly clear when the 3V-SIM simulations were run with the default parameters. Accordingly, in the following, we use these default 3V-SIM simulations to define both types of behavior and provide examples of each.
1. Type-1 behavior
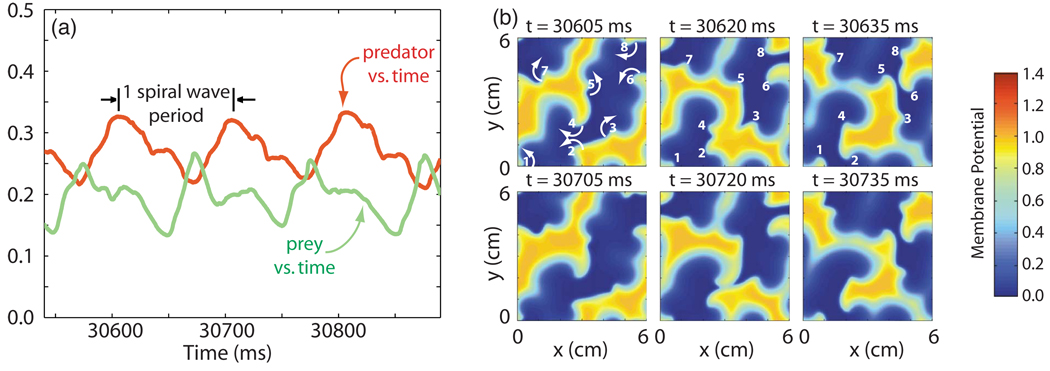
We define type-1 behavior to consist of small amplitude oscillations that possess a fair degree of repetitiveness, which appear in both the predator and prey quantities. The period of repetition closely matches the spiral wave period, as illustrated in Fig. 2(a).
FIG. 2.
(Color online) (a) Predator and prey quantities [D(t) and Y(t)] vs time during type-1 behavior in the 3V-SIM system. The spiral wave period (101 ms) is shown for reference. (b) Snapshots of the membrane potential (resting state = 0, activated state ≈ 1) in space taken at various times during the time interval shown in (a). The first frame also shows the sense of rotation of the tips of the eight spiral waves present. All three frames in the first row illustrate these rotations by marking the locations of the eight spiral wave tips (identified by the numbers 1–8). Frames in the second row, which are taken 100 ms, or almost exactly one spiral wave period (= 101 ms), later than those in the first row, show the continued, nearly identical pattern of rotation of these eight spiral waves.
The cause of this nearly repetitive pattern is clear from an examination of the underlying spatial and temporal pattern of the spiral waves. Snapshots of the membrane potential in the system at different times [Fig. 2(b)] reveal that the spatial pattern of spiral waves also repeated nearly exactly with a period equal to the spiral wave period. The existence of this pattern demonstrated that the system was often able to organize its spiral waves so their mutual interaction prevented breakup, despite a very strong tendency of isolated spiral waves in the same system to break up. Therefore, the spiral waves were able to rotate essentially unimpeded, forcing the dominant frequency exhibited by the predator and prey quantities to be closely tied to either the spiral wave rotation frequency or one of its harmonics (usually the first).
While the predator and prey wave forms repeated nearly identically within each type-1 episode, there was considerable variation in waveform from one type-1 episode to the next. This was consistent with the spiral wave patterns observed, which were nearly repetitive within each episode, but differed quite considerably between episodes.
2. Type-2 behavior
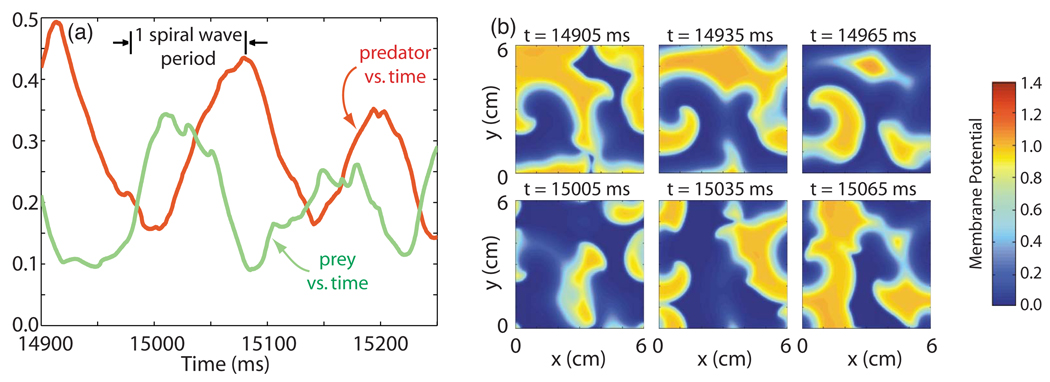
When oscillations of large mean amplitude appeared in the predator and prey quantities, we found that the underlying dynamics had quite substantially changed. As suggested by the snapshot panels in Fig. 3, the observed behavior (type 2) was no longer repetitive. Both spiral wave breakup and the extinction of individual spiral waves were now prevalent. The former appeared through the natural dynamics of spiral waves in the system, which were prone to breakup, while the latter occurred when spiral waves merged or ran into one another. Collisions between spiral wave arms took place in different locations and with different timings from one spiral wave rotation to the next. This was in distinct contrast to type-1 behavior, when collisions occurred at nearly the same time during each spiral wave period, at nearly the same location and in essentially the same manner.
FIG. 3.
(Color online) (a) Predator and prey quantities [D(t) and Y(t)] vs time during type-2 behavior in the 3V-SIM system. The time interval used is equal in duration to that used in Fig. 2(a), to allow direct comparison. The spiral wave period (101 ms) is shown for reference. (b) Snapshots of the membrane potential (resting state = 0, activated state ≈ 1) in space taken at various times during the time interval shown in (a). Frames in the second row are taken 100 ms, or almost exactly one spiral wave period (= 101 ms), later than those in the first row.
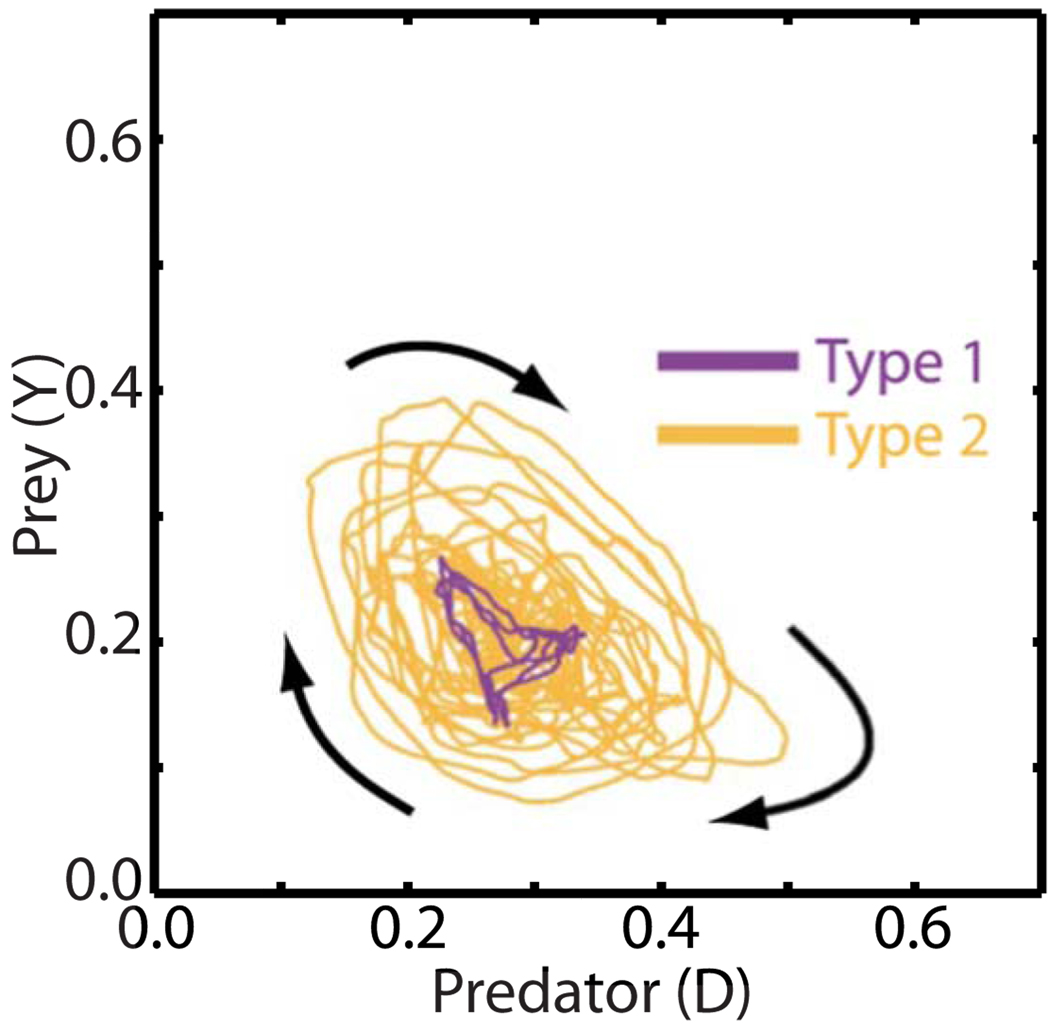
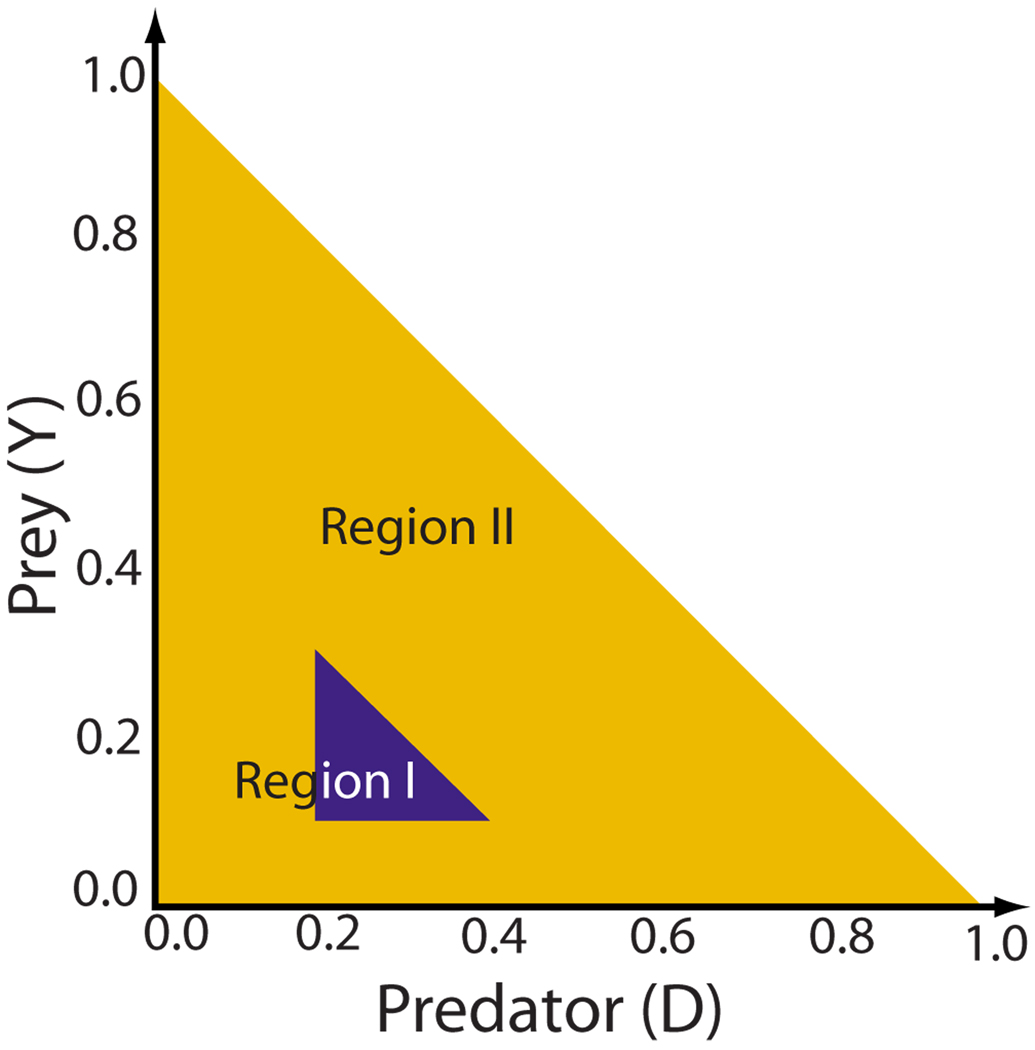
The larger amplitude of the oscillations also implied that type-2 behavior trajectories occupied a larger region of phase space than type-1 behavior, as suggested by Fig. 4. More generally, across all 3V-SIM simulations, we found that type-1 behavior was generally confined to the relatively small area marked as region I in Fig. 5, while type-2 behavior generally extended into both regions I and II. [The trajectories obtained were necessarily confined to the region-II triangle, since only within this region is it true that predator and prey quantities D(t) and Y(t) are non-negative and D(t)+Y(t) ≤ 1, properties that the predator and prey quantities must have. This last condition must be true since the predator and prey quantities are defined to be nonoverlapping fractions of the total system area.]
FIG. 4.
(Color online) Typical trajectories in predator-prey phase space during type-1 (purple) and type-2 (orange) behavior. The arrows show the dominant sense of rotation for the trajectories shown. The predator and prey data shown in Figs. 2(a) and 3(a) are short segments of the data used to produce the type-1 and type-2 trajectories, respectively, shown here.
FIG. 5.
(Color online) The triangularly shaped accessible region of predator-prey phase space may be divided up into two regions that are useful in classifying the types of predator-prey behavior observed.
Perhaps the most intriguing aspect of type-2 behavior was the frequency of the predator and prey oscillations. The observed oscillation periods, although at times somewhat difficult to measure because of substantial changes in the wave form from one cycle to the next, were definitely different from the spiral period frequency. For example, the three oscillations of the predator quantity illustrated in Fig. 3 (i.e., 3V-SIM simulations with default parameters) have periods (from left to right) of approximately 148, 135, and 113 ms, while the spiral wave rotation period was 101 ms. The corresponding oscillation frequencies are therefore 0.68Ω, 0.75Ω, and 0.89Ω, where Ω is the spiral wave rotation frequency. These frequencies are all distinctly different from the linear meandering frequency (1.3Ω) and also different from all the frequencies associated with alternans behavior in the action potential duration (APD) of the spiral waves (0.5Ω, 1.5Ω, 2.5Ω, etc.) [15]. This suggests that these “new” frequencies are associated with the dynamics of the system of spiral waves as a whole rather than with the dynamics of individual spiral waves. We also note that, in the example shown in Fig. 3(a), the oscillations with the larger amplitudes have the longer periods. This trend—that frequency tends to decrease with amplitude—was found to hold consistently across all the different systems tested.
3. Behavior of the default 3V-SIM model
A large number of simulations (48) were conducted using the 3V-SIM model with default parameters [defined in the Methods section (Sec. II)] with varying initial conditions in order to assess the range of behavior at least one excitable tissue model was capable of exhibiting. These simulations typically spent long periods of time in type-1 behavior that were interspersed with short bursts of type-2 behavior. The transitions between type-1 and type-2 behavior were particularly clear and abrupt in these simulations. This behavior was observed well after periodic boundary conditions had been imposed and transients had disappeared, suggesting that the behavior was inherent in the dynamics of the multiple spiral waves themselves.
All simulations entered type-2 behavior after an initial transient caused by the initiation of spiral waves and conversion to periodic boundary conditions. In 44 of the 48 default 3V-SIM simulations, spiral wave activity terminated spontaneously within 3.7 s, with activity lasting less than 2.0 s in most cases. However, in the remaining four simulations the system transitioned into type-1 behavior, which lasted for several seconds. All four systems then reverted back to type-2 behavior. Wave activity subsequently ceased in two of the systems. The remaining two systems reverted back to type-1 activity. Both systems then eventually converted back to type-2 behavior, which was followed by termination of spiral wave activity.
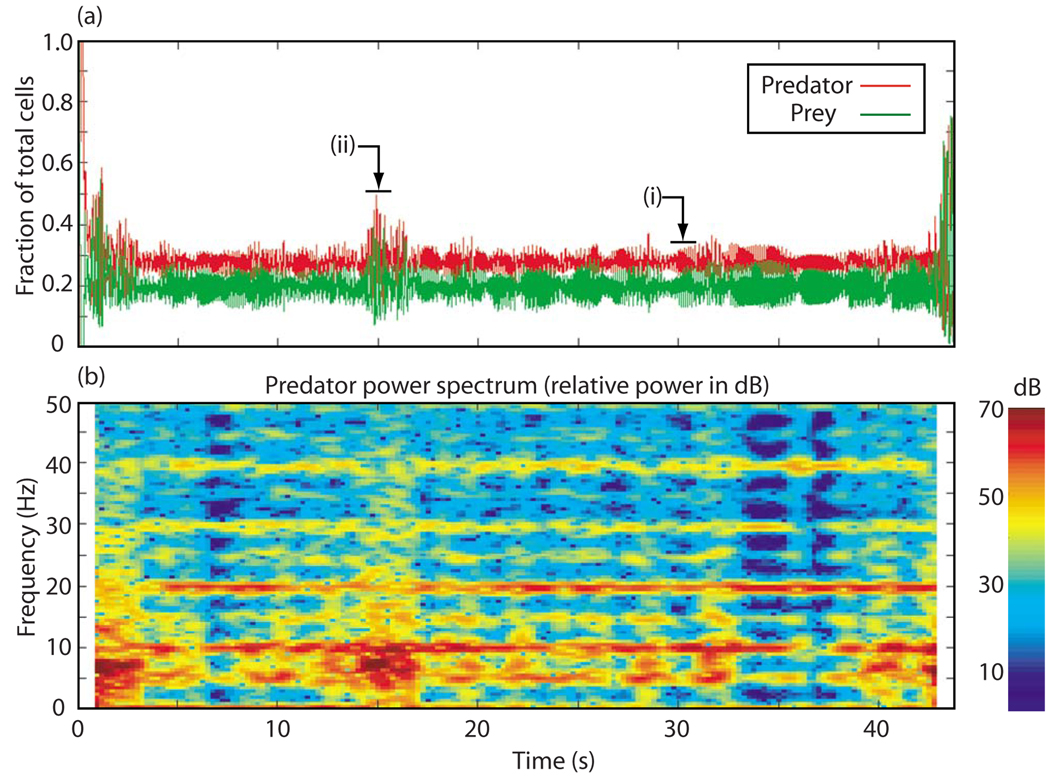
Figure 6 shows one of these long-lived, but otherwise representative, simulations. Episodes of type-2 behavior are clearly apparent in Fig. 6(a), appearing as bursts of large amplitude oscillation in both the predator and prey quantities. The episodes appear near the beginning and at the end of the recording, and also between about t =14 and 16 s. The remainder of the record shows type-1 behavior. The two labels [(i) and (ii)] indicate the time periods from which the data for Figs. 2 (type-1 behavior) and 3 (type-2 behavior) were extracted.
FIG. 6.
(Color online) (a) Predator and prey histories for one of the longer 3V-SIM runs showing transitions back and forth between type-1 and type-2 behavior and (b) power spectrum of the predator quantity vs time for the same run. System size: 6 cm × 6 cm. .
The power spectrum of the predator quantity is shown in Fig. 6(b). We observe that, during type-1 activity, most of the power is concentrated around the spiral wave frequency (10 Hz) and its harmonics at 20, 30, and 40 Hz. This is to be expected of behavior that is nearly repetitive over intervals equal to the spiral wave period. There is additionally some power at 5 Hz and its harmonics, apparently due to APD alternans activity.
In contrast, during type-2 activity, most of the power is concentrated below the spiral wave frequency, consistent with the lower-frequency oscillations associated with type-2 behavior. We also note that the power in the harmonics of the spiral wave frequency at 20, 30, and 40 Hz largely disappears during these times and is instead spread more broadly over the frequency spectrum. This is consistent with the lack of repetitiveness observed during type-2 episodes.
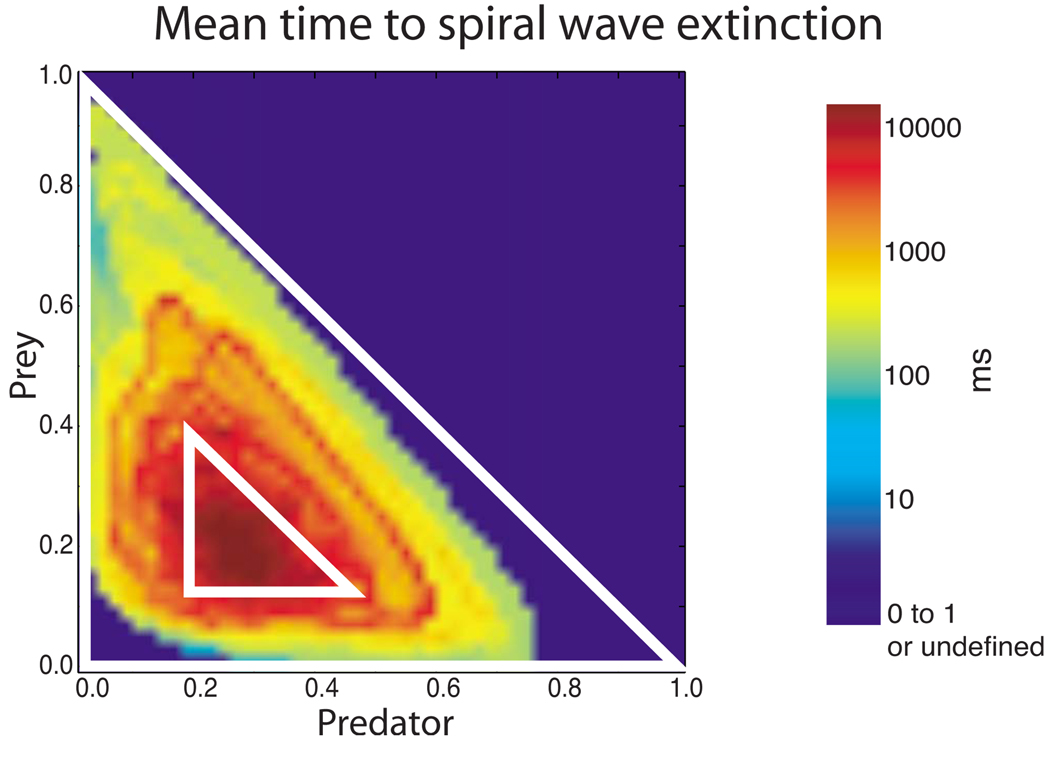
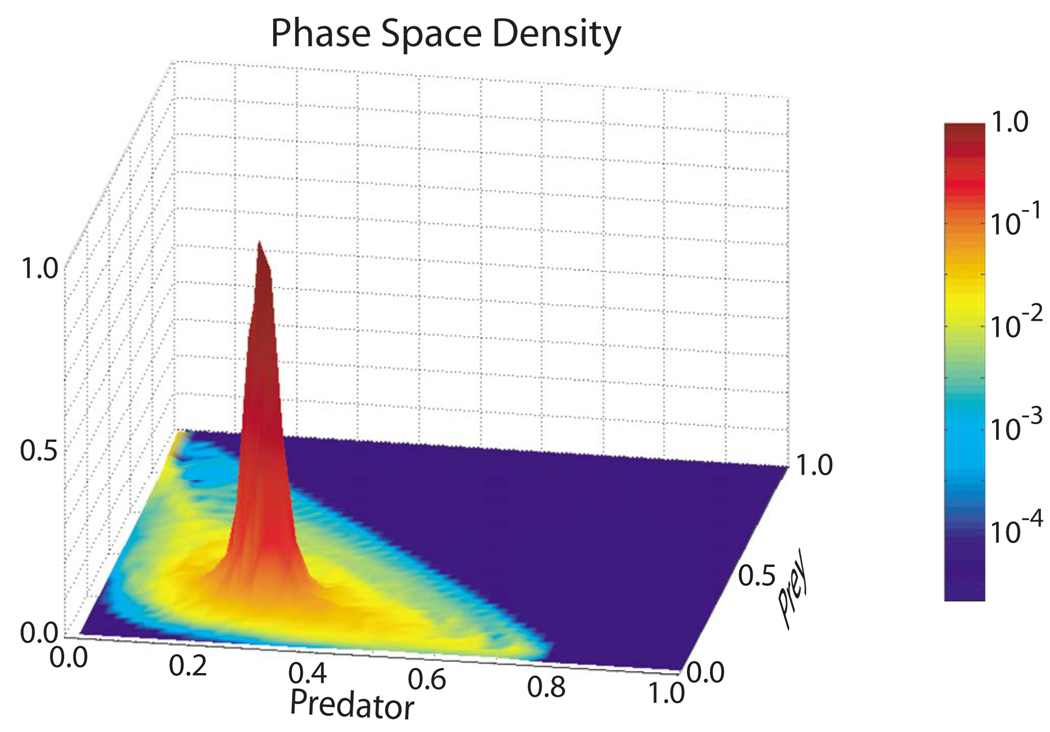
When the system was exhibiting type-2 behavior, it had a significant chance of suffering complete spiral wave extinction (i.e., cessation of all action potential wave propagation activity), while when exhibiting type-1 behavior, the system had little chance of undergoing spiral wave extinction in the short term. We quantified this observation by plotting the “mean time to spiral wave extinction” as a function of location in phase space. Figure 7 shows that the spiral activity of systems found in a small region centered around the point predator = 0.3, prey = 0.2, survived at least one order of magnitude longer than those systems located in most of the rest of the triangularly shaped accessible phase space. This small region corresponds closely to region I in Fig. 5, the region that is home to type-1 behavior. The mean remaining lifetime of the system decreased dramatically as one moved away from this small region in any direction. Lifetimes for systems found in and close to region II were up to 4 orders of magnitude shorter than those found in the center of region I. These relatively long times to spiral wave extinction for systems in region I may be explained by the relatively long periods of time systems in region I stayed in region I. As illustrated in Fig. 8, the mean time spent in region I was at least 1 order and up to 4 orders of magnitude greater than the mean time spent elsewhere in the accessible phase space.
FIG. 7.
(Color online) Mean time to extinction (in ms) as a function of current location in predator-prey phase space. The data used for the calculation were taken from the 48 3V-SIM simulations with identical parameters and randomized starts for the initial spiral wave, as described in the Methods section (Sec. II). Regions I (smaller triangle) and II (larger triangle) from Fig. 5 are shown for reference.
FIG. 8.
(Color online) Fraction of time spent in various regions of predator-prey phase space (i.e., phase space density) plotted as a function of the predator and prey variables, calculated using the same data used for Fig. 7. The phase space density is normalized to the maximum phase space density.
4. 3V-SIM model with different parameters
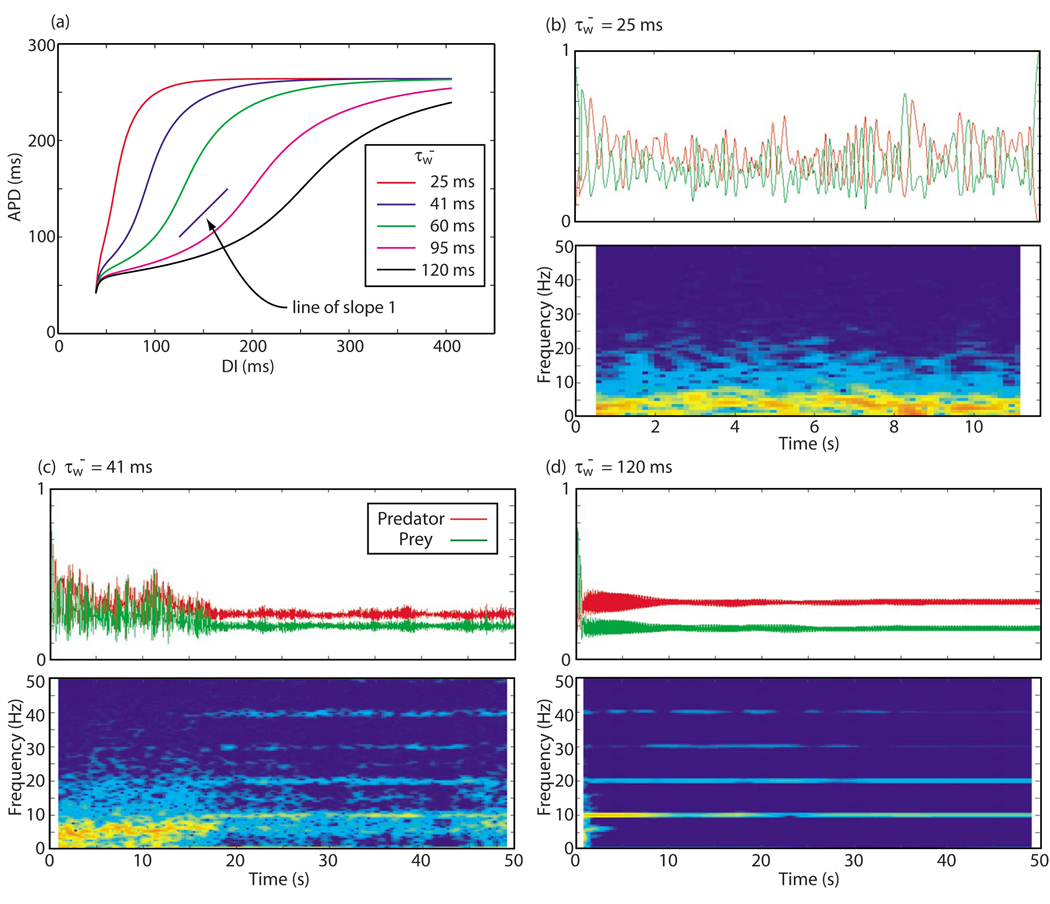
We found that the tendency for the system to exhibit type-2 versus type-1 behavior was affected by the steepness of the APD restitution function. Variation of the simulation parameter conveniently allowed us to modify the steepness of this function without changing other key properties of the system. As shown in Fig. 9(a), quantities such as the minimum value of the preceding diastolic interval (DI) for which action potential propagation is possible (40 ms), the maximum APD possible (265 ms), and the conduction velocity restitution function (not shown) are not affected by changes in . In particular, the slope of the APD restitution function could be adjusted to be greater or less than 1, the key value at which alternans begins to occur [20] in the local dynamics of models lacking substantial memory, such as this one. We observed that, at low values of , when the APD restitution function was steeply sloped with the main part of the slope greater than 1, the behavior was completely dominated by type-2 activity until termination of all wave activity occurred [Fig. 9(b)]. As was increased, the slope decreased, and type-1 behavior tended to appear more frequently and for longer periods. In Fig. 9(c), we see large-amplitude oscillations of both predator and prey quantities for t < 17 s, with most of the power appearing below the spiral wave frequency of 10 Hz, as was typical of type-2 behavior. Thereafter, the oscillation amplitude decreased and most of the power was concentrated at the spiral wave frequency and its harmonics, characteristic behavior for type-1 behavior. The case of the flattest restitution function, Fig. 9(d), was dominated by type-1 behavior almost from the very beginning.
FIG. 9.
(Color online) Behavior of the predator and prey quantities for APD restitution curves with different slopes. (a) The APD-DI restitution curves for 3V-SIM dynamics for five different values of the parameter . A line of slope 1 is shown for reference. The remaining panels show the predator and prey histories and predator power spectrum vs time for three of these restitution curves: (b) , (c) , and (d) , from 15-by-15 cm 3V-SIM simulations.
5. FMG simulations
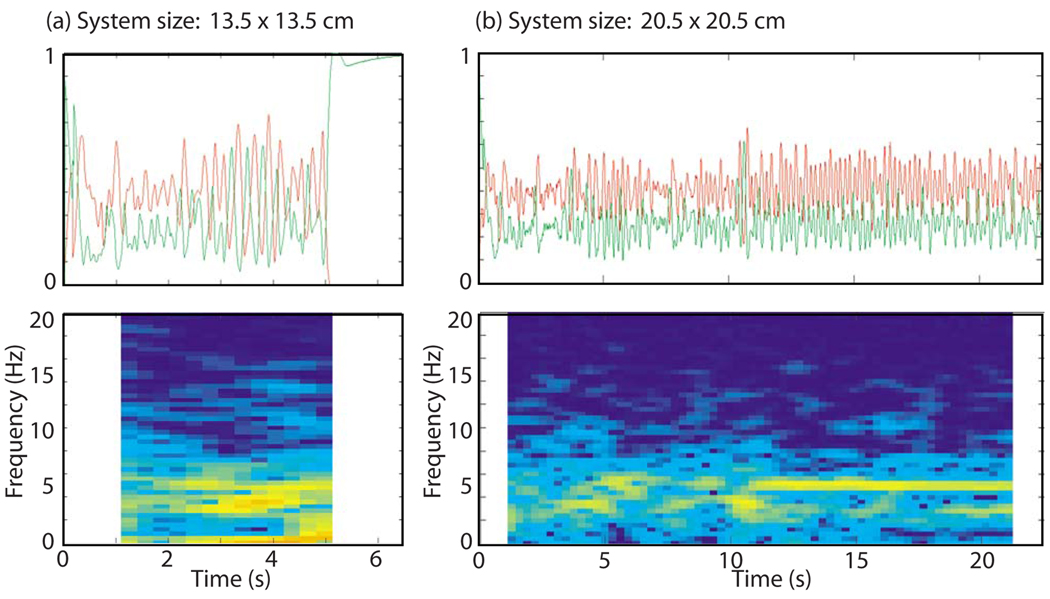
The behavior of the predator and prey quantities was similar in simulations employing the more detailed and more complex FMG model. We again observed both type-1 and type-2 behavior. As before, type-1 behavior was characterized by small-amplitude oscillations of both the predator and prey quantities at the spiral wave rotation frequency (5 Hz), as illustrated in Fig. 10. Type-2 behavior appeared as isolated bursts in this system [between t = 2.5 and 4.25 s in Fig. 10(a) and for a short period of time between 10.5 and 11 s in Fig. 10(b)].
FIG. 10.
(Color online) Predator (red) and prey (green) histories and predator power spectrum vs time for (a) a shorter FMG run with system size 13.5 cm × 13.5 cm and (b) a longer FMG run with system size 20.5 cm × 20.5 cm.
B. Phase shift between the predator and prey quantities
A clear, characteristic feature of both type-1 and type-2 behaviors was their propensity to trace out clockwise-rotating orbits in predator-prey phase space, as shown in Fig. 4. To quantify these observations, the number of clockwise (cw) versus counterclockwise (ccw) rotations around a calculated reference point was determined for several trajectories. The reference point (D0, Y0) was chosen as the mean value of (D(t), Y(t)) over time periods long compared to the spiral wave period. An ambiguity always existed as to whether the trajectory had rotated clockwise or counterclockwise in between successive data points. We resolved this ambiguity by always taking the smallest angle in absolute value as the angle through which the trajectory rotated. We added together all the positive angle changes to yield the total ccw rotation; likewise, summing the absolute values of all the negative angle changes yielded the total cw rotation. We then defined the parameter r to be the ratio of total cw to total ccw rotation. Table I shows the results of this calculation for several trajectories taken from distinct 3V-SIM and FMG simulations and from experimental optical mapping data exhibiting type-2 behavior. (type-1 behavior also appears to have been present in recent optical mapping experiments; these will be described in future publications.) We found that cw rotation was favored over ccw rotation in every simulation examined but one for a variety of values of the parameter in the 3V-SIM simulations and in all the experimental data.
TABLE I.
Ratio r of the total cw to total ccw rotation and the slope γ of the least-squares fit of log(instantaneous period) vs log(instantaneous amplitude) obtained from several episodes of simulation and optical mapping data. The type(s) of behavior and the value of the parameter (for the 3V-SIM simulations) for each episode are also provided.
| Type of data | Observed type of behavior | r | log(inst. period)/ log(inst. amplitude) |
||
|---|---|---|---|---|---|
| 3V-SIM simulations | 25 | Type 2 | 5.47 | 0.538 | |
| 25 | Type 2 | 0.84 | 0.532 | ||
| 25 | Type 2 | 1.24 | 0.564 | ||
| 25 | Type 2 | 1.09 | 0.545 | ||
| 40 | Type 2 | 8.61 | 0.527 | ||
| 40 | Type 2 | 6.27 | 0.542 | ||
| 40 | Type 2/type 1 | 8.28 | 0.538 | ||
| 40 | Type 2/type 1 | 2.75 | 0.529 | ||
| 41 | Type 2/type 1 | 1.68 | 0.522 | ||
| 41 | Type 2/type 1 | 1.53 | 0.514 | ||
| 41 | Type 2/type 1 | 1.60 | 0.522 | ||
| 41 | Type 2/type 1 | 1.56 | 0.539 | ||
| 60 | Type 1 | 1.99 | 0.529 | ||
| 60 | Type 1 | 1.50 | 0.515 | ||
| 60 | Type 1 | 1.53 | 0.522 | ||
| 60 | Type 1 | 1.55 | 0.539 | ||
| 95 | Type 1 | 1.72 | 0.516 | ||
| 95 | Type 1 | 1.64 | 0.506 | ||
| 95 | Type 1 | 2.06 | 0.519 | ||
| 95 | Type 1 | 1.82 | 0.508 | ||
| FMG simulations [Fig. 10(a)] | Type 2/type 1 | 4.33 | 0.46 | ||
| [Fig. 10(b)] | Type 2/type 1 | 3.96 | 0.48 | ||
| Optical mapping | Type 2 | 1.42 | 0.509 | ||
| Type 2 | 1.80 | 0.483 | |||
| Type 2 | 1.33 | 0.474 | |||
| Type 2 | 1.44 | 0.483 | |||
| Type 2 | 1.49 | 0.479 | |||
| Type 2 | 1.36 | 0.475 |
C. Relationship between period and amplitude
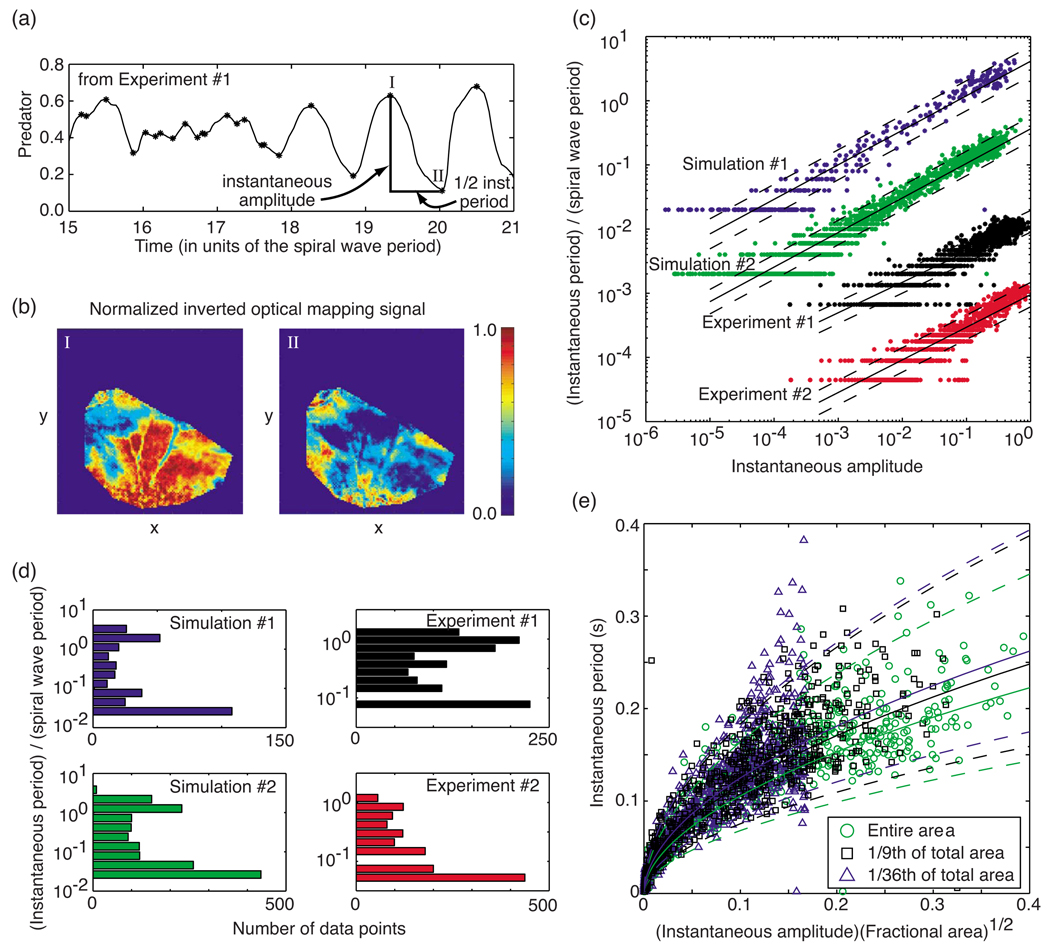
Figures 2(a), 3(a), 6, 9, and 10 all suggest that there is a correlation between the amplitude and frequency of the predator and prey oscillations, with the frequency tending to decrease as the amplitude increases. Since any behavior apart from type-1 behavior exhibits oscillation periods that vary substantially from one period to the next, we sought measures of oscillation period and amplitude that could be defined over time intervals commensurate with these periods, to study this relationship. We found quantities based on the local extrema of the predator quantity to be appropriate. Specifically, as illustrated in Fig. 11(a), we located all the local maxima and minima for the time record of the predator quantity. Panel (b) of Fig. 11 shows patterns and the degree of activation, obtained from an optical mapping experiment, at a typical maximum and minimum, those marked as “I” and “II” in panel (a). We defined the instantaneous period T associated with each time interval connecting two adjacent extrema (which always must be one maximum and one minimum) to be twice this time interval. The corresponding instantaneous amplitude A was defined as the difference in the value of the predator quantity between this local maximum and minimum. These definitions for the instantaneous period and amplitude also have the advantage of being meaningful quantities in our proposed explanation of the results, which we detail in the next section.
FIG. 11.
(Color online) (a) Definitions of instantaneous period and amplitude illustrated using a portion of experiment No. 1 data (see below). Asterisks mark the calculated local extrema of the data. (b) Optical mapping snapshots of the membrane potential (red = activated) in a right ventricular endocardial preparation taken at the two times marked as “I” and “II” in panel (a). (c) Instantaneous periods T relative to the spiral wave period plotted vs the corresponding amplitudes A of the predator quantity for two simulations (simulation No. 1, ; simulation No. 2, ) and two experiments (experiment No. 1, right ventricular epicardial preparation perfused with low-calcium (0.125 mM) Tyrode solution; experiment No. 2, right ventricular endocardial preparation with blebbistatin 20 µM added to normal Tyrode solution to reduce mechanical motion. Slopes of the least-squares fit of log(T) vs log(A): simulation No. 1, 0.538; simulation No. 2, 0.538; experiment No. 1, 0.474; experiment No. 2, 0.509. The bottom three data sets were offset downwards by 1, 2, and 3 orders of magnitude from the simulation No. 1 data set, for clarity. (d) Distribution of data vs the instantaneous period (relative to the spiral wave period; logarithmic binning) for the same simulations and experiments as in (a). (e) Instantaneous period T vs instantaneous amplitude A of the predator quantity multiplied by the square root of the fraction of total area used to calculate the predator quantity. Three data sets are shown, all from the same simulation (), with the predator quantity calculated from the entire simulation region (green circles), 1/9th of the region (black “+’s”), and 1/36th of the region (blue triangles). The log-log fits least-squares slopes were found to be 0.538, 0.539, and 0.535, respectively. In both (c) and (e), the solid lines depict the least-squares fit; the dashed lines mark unit standard deviation departures from each fit.
As shown in Table I, when the instantaneous periods and amplitudes obtained from 20 3V-SIM simulations, 2 FMG simulations, and 6 optical mapping experimental recordings were plotted logarithmically versus one another, we observed straight-line relationships, with least-squares calculations of all 26 slopes γ falling between 0.46 and 0.57 and most falling between 0.47 and 0.54. Typical data from the 3V-SIM simulations and optical mapping experiments are shown in Fig. 11(c). The instantaneous periods showed a tendency to be distributed in a bimodal distribution when plotted versus the logarithm of the periods, with the two peaks in the distribution occurring close to the ends of the range of periods observed [Fig. 11(d)]. We also found that, when the instantaneous periods and amplitudes were calculated on the basis of the predator quantities obtained from various rectangular subsets of the total simulation area, the same power-law dependence (T ~ A1/2) was present. Furthermore, when T was plotted versus (σobs/σtot)1/2A, where σobs/σtot is the rectangular area of observation as a fraction of the total simulation area, the data were found to overlap, as shown in Fig. 11(e). This suggests that the instantaneous period T scales as [(σobs)1/2A]γ, where γ ≈ 0.50.
IV. DISCUSSION AND ANALYSIS
This study focuses on the dynamics of spiral waves at the level of many spirals, all rotating and interacting within a larger system, rather than at the level of individual spirals. Our results show that the behavior at this level is in general very complicated. Nevertheless, when the predator and prey quantities are calculated, a number of patterns emerge. We find that these systems tend to display one of two characteristic types of behavior, summarized in Table II, or display characteristics somewhere between these two types. Furthermore, we observe that this is not a static situation, but rather, the systems are able to move back and forth through a spectrum of behavior between type-1 and type-2 behavior. One of the systems we studied, the default 3V-SIM simulation system (with ), demonstrated this property particularly clearly, switching back and forth between “pure” type-1 and type-2 behavior quite abruptly (Fig. 6), making it a convenient system to study. We now attempt to provide explanations for what is happening during type-1 and type-2 behavior, and why these two behavioral types have the properties that we observe.
TABLE II.
Summary of the characteristics of the two types of predator-prey behavior
| Type I | Type II | |
|---|---|---|
| Characteristic frequency | Multiple of the spiral wave frequency |
A spread of frequencies associated with global dynamics with a general shift to frequencies lower than the spiral wave frequency |
| Oscillation amplitude | Small | Large |
| Underlying wave pattern | Nearly repetitive | Non-repetitive |
| Phase space region occupied | Regions I only | Both Regions I and II |
| Tendency towards cw rotation in phase space | Mild | Strong |
A. Domains of influence
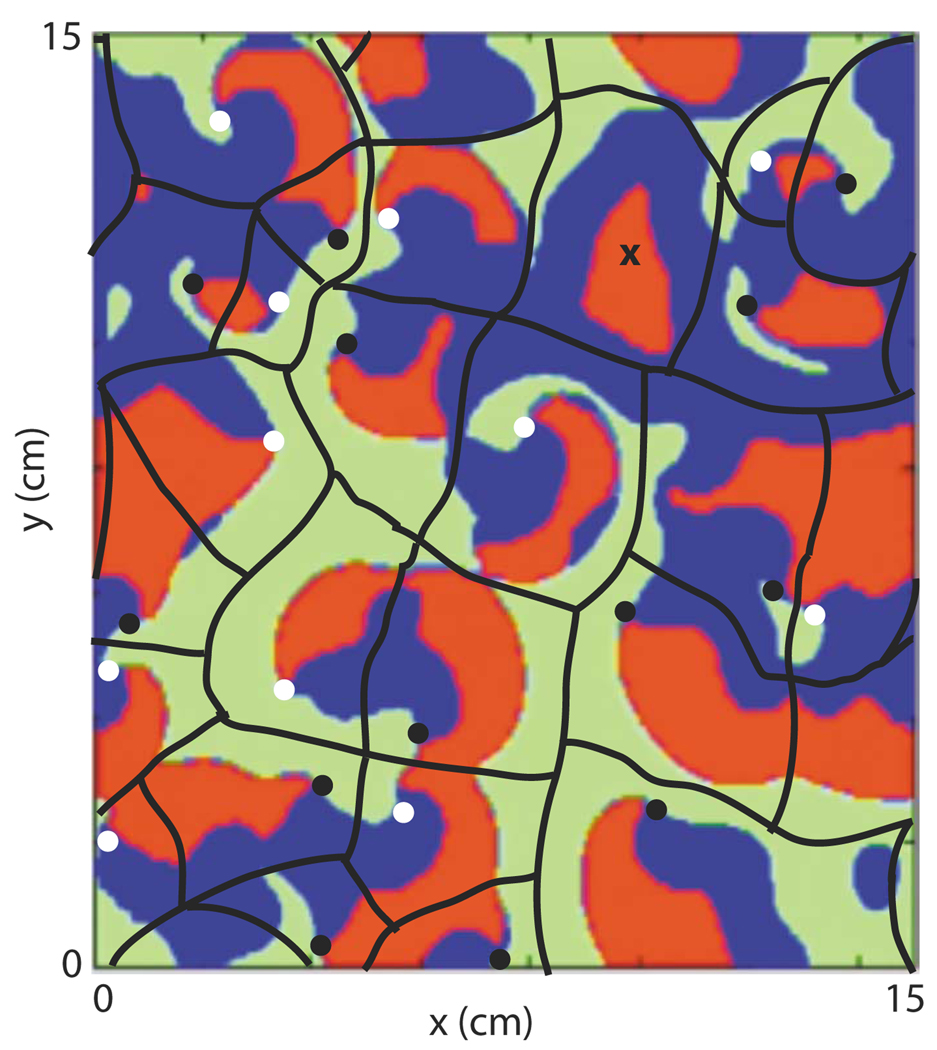
We speculate that these two types of behavior differ because of differing patterns of action potential propagation in subregions within the system that we will refer to as “domains of influence.” We define the domain of influence of a particular action potential wave as the region within which it propagates without interference from other waves. While this definition is hopefully clear, it is not always obvious how to identify these domains, particularly in simulations exhibiting type-2 behavior or in experimental data. Thus, the presence of these domains is a hypothesis that we attempt to support through consistency of the observed behavior of the predator and prey quantities with a theory based on these domains. An example of how these domains might be drawn for a particular configuration of action potentials, taken from type-2 behavior during a 3V-SIM simulation, is shown in Fig. 12.
FIG. 12.
(Color online) An example of how the domains of influence might be drawn for a particular pattern of action potential propagation. The background color image is a snapshot of a large (15 cm × 15 cm) 3V-SIM simulation () taken during type-2 behavior. Red = predator (action potential) regions; green = prey regions; blue = neither predator nor prey. Black and white dots mark spiral wave tips rotating in the clockwise and counterclockwise directions, respectively. The black lines mark the boundaries of the domains of influence. Domains located near the edges of the system continue through the periodic boundaries to the opposite side of the system. Note that each domain contains exactly one spiral wave, except the one marked with the “X” which contained two spiral waves until they annihilated one another shortly before the time of this snapshot. The boundaries drawn are not definitive, but rather represent the authors’ best guess of an average of where the adjacent spiral waves had collided, will collide, and/or would have collided had not breakup or some other disrupting event occurred.
As we have seen, type-1 behavior is characterized by the settling of the multiple spiral wave system into a highly repetitive pattern with the period of repetition almost exactly equal to the spiral wave period. Examination of the system underlying type-1 behavior reveals the presence of many well-defined spiral waves, each with its own center of rotation that moves very slowly, if at all, as a function of time [Fig. 2(b)]. In this case, the domains of influence are the regions occupied by each of the rotating spiral waves. Collisions between neighboring spiral waves occur, by definition, on the borders between these domains. This type of pattern could be created by initiating a large number of stable spiral waves that would also be stable in isolation—however, here, we are more interested in spiral waves that would tend to break up by themselves, but collectively form a pattern that prevents the breakup of individual waves. As opposed to the former pattern [e.g., Fig. 9(d)], which, when memory and electrotonic current modifications [21] can be neglected, requires an APD restitution function slope less than 1, we have shown here that the latter pattern can occur even when a portion of the restitution function has slope greater than 1 [e.g., Figs. 6 and 9(c)].
Type-2 behavior, in contrast, is much more dynamic and seems to occur with increasing frequency as the steepest part of the APD restitution function is chosen increasingly greater than 1. While at any one time the system still contains many waves that appear to be, at that instant, rotating, their rotation tends to be short lived. The waves are either terminated or are broken up through collision with other waves, or are deflected through these interactions, leaving them to travel in new directions or to begin rotating around a new center. These disruptions can occur before the wave has had a chance to complete even one spiral wave rotation. Thus, the domains of influence of these waves can be created and destroyed over time scales as short as the spiral wave period and can change rapidly in spatial extent during their brief existence.
B. Frequency power spectrum of type-1 and type-2 behavior
The power spectra obtained from both the simulations and the experiments show two types of patterns corresponding to the two types of behavior: during type-1 behavior, there is a tendency for power to congregate around the spiral wave frequency and its harmonics [Figs. 6(b), 9(c), 9(d), 10(a), and 10(b)], while when the system is exhibiting type-2 behavior the tendency is for power to spread out both above and especially below the spiral wave frequency [Figs. 6(b), 9(b), 9(c), and 10(b)]. These two power spectrum patterns are consistent with the types of behaviors we hypothesize are taking place within the domains of influence; that is, during type-1 behavior, waves are primarily executing spiral wave rotation within their respective domains of influence, and thus most of the power will be expected to be concentrated around the spiral wave frequency and its harmonics. In contrast, during type-2 behavior, waves execute only a portion of a spiral wave rotation or are propagating in some more complicated pattern within their domains. Thus, in this case, we would expect the power spectrum to be characterized by frequencies that are commensurate with the inverse of the lifetimes of the domains of influence or by the typical time it takes for the resident wave to cross its domain. These frequencies could extend above the spiral wave rotation frequency when the domains last shorter than a spiral wave period or when the wave takes less than a spiral wave period to traverse its domain. This situation is typical of the experimental data, where the behavior is type-2-like, and transit times of waves across the entire preparation are small compared to the spiral wave rotation period. In contrast, frequencies would be expected to be found more often below the spiral wave frequency when the system is composed largely of waves that take more than one spiral wave period to cross their domains. This scenario is more typical of many of our 3V-SIM simulations, where study of the system during type-2 behavior reveals the presence of waves that are traveling relatively long distances across the system.
1. Self-organization during type-1 behavior
Perhaps the most important question we can ask about type-1 behavior has to do with the nature of the self-organization the system exhibits. When individual spiral waves are not prone to breakup, the ability for the system to maintain a particular spatial pattern of spiral waves from one spiral wave rotation period to the next is not all that surprising—without breakup, we generally only see drifting and/or meandering of the spiral wave centers, both of which are slow processes compared to spiral wave rotation. The existence of type-1 behavior is much more surprising when breakup is an inherent property of individual spiral waves. In this case, the system must somehow organize its spiral waves so that their mutual interaction inhibits their tendency to break up, as we saw in the 3V-SIM simulations. The process by which this occurs is, at the moment, unknown, although we can make some modest observations. We see, for example, that during type-1 behavior the arm of each spiral appears to collide with other waves repeatedly at a location where breakup might otherwise be expected to occur. We can speculate, therefore, that breakup is being inhibited by these repeated collisions.
Once we accept the near-repetitive spatial pattern of type-1 behavior, it is not too difficult to understand most of the other type-1 properties. If type-1 behavior were exactly repetitive from one spiral wave period to the next, then all dynamical quantities, including the predator and prey quantities, would also be necessarily repetitive with the same period. Thus, it is not surprising that the near repetition of type-1 behavior would yield near-repetitive behavior in the predator and prey quantities and that the period of repetition would be the spiral wave period. Also, we should not be too surprised that the oscillation amplitude of the predator and prey quantities is relatively small, since simple rotation of a spiral wave would be expected to have a smaller impact on the fraction of tissue activated at any one time, in contrast to the larger fluctuation one would anticipate resulting from annihilation and formation of action potential waves, as routinely takes place during type-2 behavior.
2. Type-2 behavior as a less organized, “searching” mode
Type-2 behavior appears to lack the same degree of the self-organization and near-repetitive dynamics present in type-1 behavior; thus, the spatial pattern of spiral waves is free to change during type-2 behavior, allowing the system to sample one pattern of spiral waves after the next. We can therefore think of a system exhibiting type-2 behavior as being engaged in a “searching” mode, as it looks for opportunities to either coalesce into self-organization (type-1) or progress into behavior that will lead to complete action potential extinction. We have seen that systems involved in type-2 behavior are actually able to change spiral wave patterns fairly quickly, perhaps even on a time scale approaching the spiral wave period (cf. Fig. 3). This allowed the system to conduct its search relatively rapidly, sampling new spatial patterns of spiral waves in quick succession. Furthermore, for our default 3V-SIM system, it seemed fairly easy for type-2 behavior to find spiral wave patterns that self-organized into the nearly repetitive behaviors characteristic of type-1 behavior. It also seemed relatively easy for type-2 behavior to generate patterns of spiral waves that involved near total activation of the tissue, corresponding to a high value of the predator quantity, or near total recovery of the tissue (high prey value), both of which corresponded to entering into region II in Fig. 5. This translated into large amplitudes in the oscillation of the predator quantity and also increased the tendency for type-2 behavior to end in extinction of all spiral wave activity [e.g., the ends of the simulations shown in Figs. 6(a), 9(b), and 10(a)]. These tendencies explain the large disparities in the mean time to spiral wave extinction (Fig. 7) and phase space densities (Fig. 8) we obtain for type-1 versus type-2 behavior.
C. Clockwise rotation in phase space
We believe the observed tendency towards clockwise rotation in predator-prey phase space, when it occurs, is based on the fact that rotation will always appear when both dynamical variables are oscillatory with the same frequency and the phase shift between the two variables is something other than a multiple of π (180°). This type of behavior is common in the analysis of electronic signals, where the rotating pattern is generally called a Lissajous figure (e.g., [22]). In our case, we suggest that the observed clockwise rotation is caused by approximately oscillatory behavior of both the predator and prey quantities, with the predator quantity lagging behind the prey quantity by less than half an oscillation period.
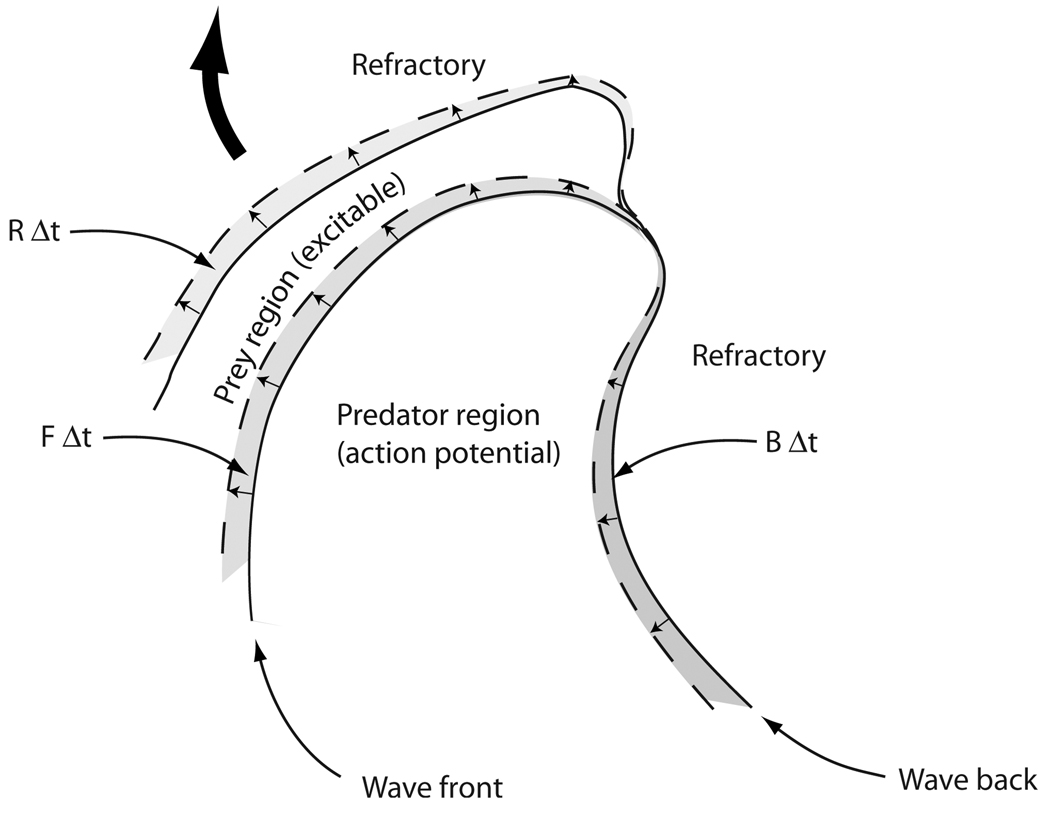
We can make a simple argument for why this type of relationship should often exist between the predator and prey quantities. Every point on the boundary of every region containing cells in the “predator” state is either moving outward into the surrounding medium or is retracting inward into the predator region, as portrayed in Fig. 13. We consider points in the former category to be part of the wave front, while those in the latter are part of the “wave back.” The predator regions themselves may be thought to be regions of activation—that is, the regions occupied by action potentials. During a short period of time Δt, the area occupied by predator cells is increased by the area traversed by the wave front and decreased by the area traversed by the wave back, as suggested by Fig. 13. Thus, if F is the area per unit time swept out by all the predator region wave fronts, B the corresponding quantity for the predator region wave backs, and D the area of the predator region, then D satisfies the differential equation
| (3) |
FIG. 13.
Changes in the areas of the predator and prey regions during a time interval Δt occur on the boundaries of these regions. An area FΔt is added to the predator region and subtracted from the prey region as the predator region (alias, the action potential) advances into the prey region (containing excitable tissue). Predator area BΔt is lost on the trailing edge of the action potential, while prey area RΔt is regained along its boundary with refractory tissue as the latter recovers. Here F, B, and R are the rates at which the corresponding areas are gained or lost per unit time.
A similar equation holds for the prey region:
| (4) |
where Y is the area of the prey region and R is the area per unit time being added to the prey region as a result of recovery of tissue from the refractory state back into the excitable (i.e., prey) state. This occurs over portions of the boundaries of the prey regions; over the remainder of the prey boundaries, the action potential (i.e., predator) region is intruding. We note that the area being added to the predator region is essentially the same as the area being taken away from the prey region, as action potentials advance into prey regions. Thus, the loss of prey region area per unit time is simply −F—that is, minus the area per unit time being added to the predator regions, as suggested by Fig. 13. This accounts for the last term in Eq. (4).
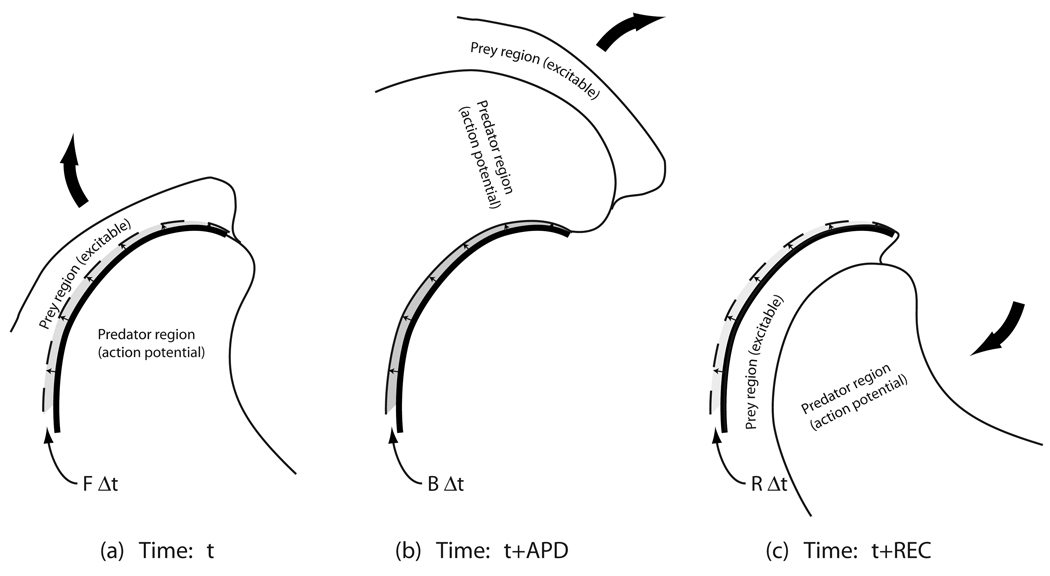
Over most of the system, we can expect the wave backs to follow behind the wave fronts. Thus the locations and propagation velocities of the predator wave fronts at a given time t generally become the approximate locations and velocities of the wave backs at times approximately equal to the local value of the APD later [Figs. 14(a) and 14(b)]. It is therefore a reasonable approximation that the area being added per unit time to the predator region at a given time t resulting from wave-front propagation is the area being subtracted from the predator region on the wave back at the later time t+APD. Thus, we have that B(t+APD) ≈ F(t). A similar statement may be made of the addition and removal of the prey region area: R(t+REC) ≈ F(t), where REC is the time recovery occurs, measured relative to the time of activation at the same location [Fig. 14(c)]. These statements, of course, are not strictly true—such patterns would not be expected to hold near the centers of spiral wave rotation or in the vicinity of spiral wave breakup. Also, APD and REC are not normally constant, either in time or in space, so that snapshots of wave fronts and wave backs at the later time will never perfectly coincide. Nevertheless, it is reasonable to expect that these relationships hold approximately over most of the system most of the time, corresponding to the vast majority of the system being occupied by well-formed, normally propagating action potentials waves, at any given time.
FIG. 14.
Illustration of the implications of wave backs and the leading edges of the prey region following and mimicking the propagation of wave fronts. The location of the wave front at time t (represented by the thick line in all three panels) is the location of the wave back at the later time t+APD [panel (b)], which is also the location of the leading edge of the prey region at time t+REC [panel (c)]. Thus, the area swept out by the wave front between times t and t+Δt [FΔt in panel (a)] is the same area swept out by the wave back between times t+APD and t+APD+Δt [BΔt in panel (b)] which is the same as that swept out by the leading edge of the prey region between times t+REC and t+REC+Δt [panel (c)].
Assuming that Eqs. (3) and (4) are approximately correct, we can argue that, if the area swept out by the wave front oscillates roughly sinusoidally in time, as we have observed in our 3V-SIM spiral wave breakup simulations, then the predator and prey quantities D(t) and Y(t) will not simply oscillate 180° out of phase with one another, as one might at first expect. Instead, the prey quantity is delayed relative to out-of-phase behavior, leading to roughly circular, clockwise rotating trajectories in predator-prey phase space (the x direction corresponding to predator, y corresponding to prey).
This is perhaps most easily shown by representing F(t) as a sine function:
| (5) |
where a, b, and are Ω constants. As argued above, we then have that B(t) and R(t) are time-delayed versions of F(t):
| (6) |
and
| (7) |
Substituting into Eqs. (3) and (4) and integrating, we find that
| (8) |
| (9) |
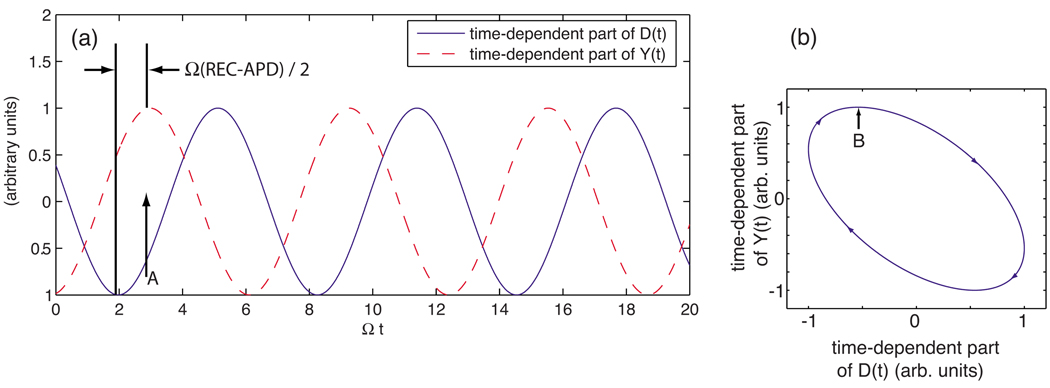
The factors sin[Ω(APD/2)] and sin[Ω(REC/2)] are both positive, as long as both the APD and recovery time (REC) are less than the period of oscillation, 2π/Ω. Thus, since REC is always longer than APD, we see that the time-dependent part of the prey quantity Y(t) is always delayed by the time interval (REC − APD)/2 relative to −D(t), the out-of-phase version of the predator quantity. In particular, each maximum in the prey quantity is delayed by (REC−APD)/2 relative to the corresponding minimum in the predator quantity, leading to the relative phasing of the sinusoidal oscillations between the predator and prey quantities shown in Fig. 15(a). In turn, Fig. 15(a) shows that D(t) is increasing as the maximum in Y(t) is attained [point A in Fig. 15(a)], implying that the trajectory in D-Y phase space must appear as shown at point B in Fig. 15(b). Other portions of the trajectory may be constructed in a similar fashion at the other extrema of D(t) and Y(t), yielding the clockwise rotation of the system point as it moves along its trajectory in D-Y phase space, as depicted in Fig. 15(b).
FIG. 15.
(Color online) (a) Qualitative illustration of the phase shift in time of the oscillatory part of the prey variable Y(t) compared to that of the predator variable D(t). (b) Phase space trajectory of (D(t), Y(t)) when the peak in Y(t) lags behind the minimum in D(t).
The typical positioning of the predator behind, and in pursuit of, the prey is not just a familiar image. In the preceding derivation, it is an important assumption—and it is also what is actually happening within the domain of each spiral wave, in the simulations and presumably in the experiments, with the predator action potential chasing (or moving into) the excitable tissue prey.
Another assumption used in this derivation—that of sinusoidal behavior at the spiral wave frequency—was not found to be universally true in the simulations. It was not unusual for the predator and prey quantities to deviate substantially from this behavior. In fact, during type-1 behavior, we even found predator and prey wave forms that more closely resembled two complete sinusoidal oscillations per spiral wave period than one. Nevertheless, a majority of the time, we found that the peaks and valleys of the predator wave form tended to lag behind those of the prey by less than half a spiral wave period, leading to the observed dominance of clockwise rotation in predator-prey phase space.
D. Dependence of instantaneous period on amplitude
The origin of the approximate dependence of the instantaneous period on amplitude as T ~ A1/2 in both the simulations and experiments remains unclear. However, we have been able to devise a simple system that reproduces this quantitative dependence and also exhibits qualitative similarities to other observed statistical features. We simply model the local predator quantity Di in the ith domain as
| (10) |
where C is a constant, ϕi(t+Δt) = ϕi(t)+2πΔt/Ti(t), and Δt = 2 ms. The time-varying periods Ti(t) were calculated independently for each domain according to the following:
| (11) |
where r is randomly chosen with equal probability between 0 and 1, and ri(t) varies slightly to either side of 0.5, so as to always favor return of T(t) to a value of about 0.0316 (= 10−1.5). Specifically, r0(t) = [ln T(t) − ln Tmin]/(ln Tmax − ln Tmin), where Tmax and Tmin were chosen to be 10−1.5+100 and 10−1.5−100, respectively. In other words, each of the domain predator quantities oscillates with an amplitude proportional to the square of its period, and these periods vary slowly and randomly about a value of 10−1.5 and independently of one another.
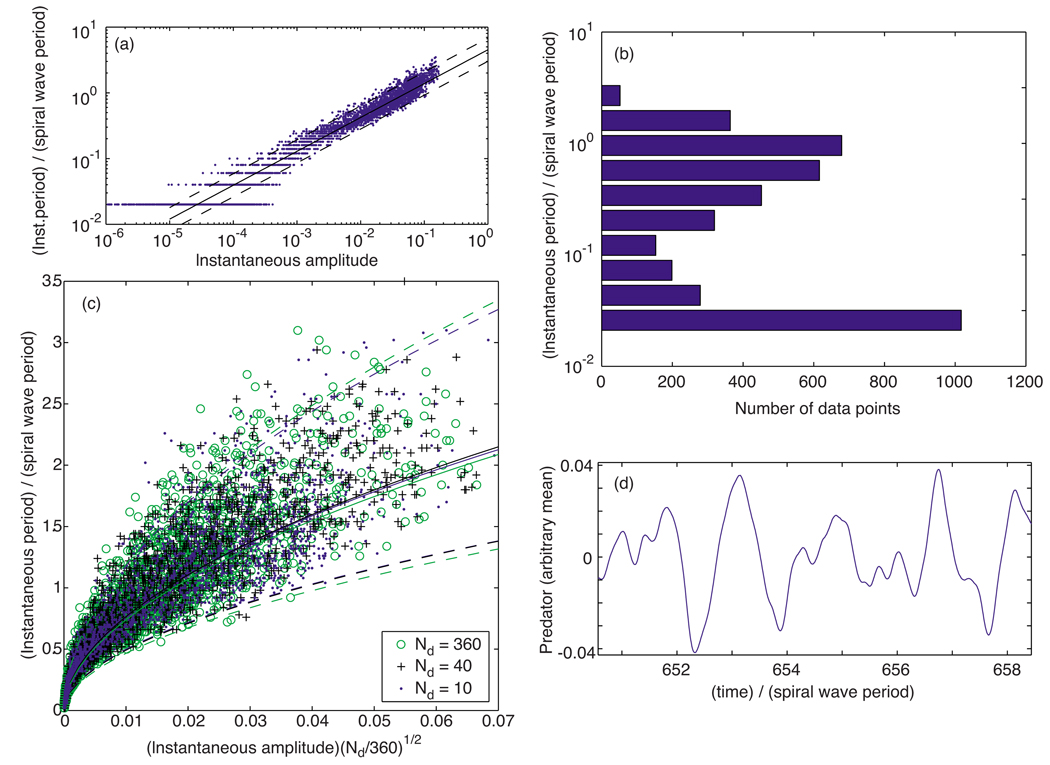
When simulations of this simple model were conducted, the results in Fig. 16 were obtained. As shown in Fig. 16(a), calculation of the instantaneous periods and amplitudes gives the same T ~ A1/2 dependence obtained from the spiral wave simulations and optical mapping experiments. We also find that the distribution of the data in amplitude-period space is not unlike that seen in the main simulations and experiments. In particular, we see a flare in the spread of instantaneous amplitudes for the smaller periods. The distribution of data versus the logarithm of the periods [Fig. 16(b)] also bears qualitative resemblance to the corresponding distribution in the main simulations and experiments [Fig. 11(d)]. Specifically, we see that both graphs show the tendency for most of the periods to congregate at both ends of the main range over which the period varies, in a bimodal distribution. The data were also found to overlap [Fig. 16(c)] for different numbers of domains, Nd, when plotted versus the amplitude times , just as in the experiments and simulations [cf. Fig. 11(e)]. Finally, we also observe qualitative similarities in the wave form of the predator quantities. Comparing Fig. 16(d) with Figs. 2(a) and 3(a), we observe that both display smooth, sinusoidal-like undulations, with smaller short-period oscillations often superimposed on a larger, longer-period pattern. Qualitatively similar wave forms are also observed in the experimental predator data (not shown).
FIG. 16.
(Color online) Data from a simple domain-based model. (a) Instantaneous periods T relative to the spiral wave period plotted vs the corresponding amplitudes A of the predator quantity for Nd = 30. Calculated least-squares slope: 0.515. (b) Distribution of data vs the instantaneous period (relative to the spiral wave period, logarithmic binning) for the same model run as in (a). (c) Instantaneous period T vs instantaneous amplitude A of the predator quantity multiplied by the square root of Nd for three different values of Nd: Nd = 10 (blue dots), 40 (black “+’s”), and 360 (green circles). The log-log fit least-squares slopes were found to be 0.534, 0.531, and 0.523, respectively. (d) Typical behavior of the global predator quantity as a function of time t taken from the Nd = 30 run. In both (a) and (c), the solid lines depict the least-squares fit; the dashed lines mark unit standard deviation departures from each fit.
If we assume that this model is indeed representative of what is happening, the next question to answer is, what type of dynamics might underlie such a model? The answer is unclear at present. However, we can make the following observations and speculations. First, the proportionality of the amplitude of the individual domain predator quantities Di(t) to the square of the periods Ti(t) suggests that the amplitude of the oscillation of these predator quantities’ second derivative, d2Di(t)/dt2, is approximately independent of the periods, since d2Di(t)/dt2 ≈ − 4π2Csin ϕi(t), from Eq. (10), if we can assume a small time step Δt and slow variation in the periods [1/Ti(t)](dTi/dt) ≪ 1. Plots of the second time derivatives of both individual Di(t)’s and the total predator quantity from simulations of Eq. (10) confirm the approximate constancy of these amplitudes, once fluctuations above 1/10th the Nyquist frequency are filtered out. Second, if the area inside a spiral wave, and thus, the area used to calculate one of the Di’s, can be represented as [xfront(t) − xback(t)]l/S, where the x direction is oriented in the direction of propagation of the wave, xfront and xback are the wave-front and wave-back locations, respectively, l is the length of the wave front, and S is the area of the domain, then d2Di(t)/dt2 would then be proportional to d2xfront/dt2 − d2xback/dt2—that is, the difference between the wave-front and wave-back accelerations. These changes in velocity of the wave front and wave back, in turn, are often thought to be governed by the DI encountered by the wave front as it propagates. Thus, the acceleration of the wave front, for example, is given by
| (12) |
where υ(DI) is the wave-front velocity, dependent on the preceding DI (i.e., conduction velocity restitution function), and υ′(DI) is the slope of this function. Both υ(DI) and υ′(DI) can be expected to be characterized by “typical” values during the continual, rapid activation of tissue that dominates spiral wave turbulence. This leaves us to try to understand the nature of the gradient of DIs in such a system. Severe gradients in DIs are thought not to exist in systems entertaining action potential propagation—they are quickly eroded over a number of different length scales, discussed by Echebarria and Karma [23]. Thus, we can suppose that patterns of multiple spiral waves will become increasingly complex until gradients in DIs up to this theoretical value are reached and would subsequently level off. Thus, there is some rationale for the existence of a characteristic amplitude for the oscillation of the (d2Di/dt2), although obviously this argument remains highly speculative.
V. SUMMARY AND CONCLUSIONS
Summarizing, the use of “predator” and “prey” dynamical variables has provided us with diagnostic tools that we can use to characterize the behavior of systems containing many interacting spiral waves. These quantities are so named because the dominant sense of rotation in phase space is the same as that found in predator-prey dynamical systems and occurs for similar reasons. Study of these quantities has allowed us to identify two characteristic types of behavior we call type 1 and type 2, with the behavior of all the simulations and optical mapping experiments we studied falling into of one of these categories, or in transition between these two categories. The two types of behavior possessed a number of different distinguishing characteristics, including the degree of repetitiveness of wave propagation patterns in time, the distribution of spectral power, and inferred dynamical organization. Type-2 behavior also exhibited a strong correlation between the time intervals between consecutive extrema in the predator time history and the change in the value of the predator quantity that occurs within these time intervals. These characterizations led to the development of a theory based on the summation of behavior of the dynamics within the “domains of influence” of the individual waves present in the system. While we at present cannot say that this theory is either complete or correct, it does yield behavior consistent with all the characteristics observed, and thus is a starting point towards additional understanding of this complex system.
This study demonstrates that quantities such as predator and prey can raise important, new questions that shed new light on multiple spiral wave systems that might otherwise not be posed. Among these are the following: What dynamics is involved in the transitions between type-1 and type-2 behaviors, and when and why do such transitions occur? Why should the nonrepetitive behavior associated with type-2 behavior also be correlated with larger amplitude oscillations in the predator and prey quantities? What actually is responsible for the square-root dependence between instantaneous amplitude and instantaneous period? What is happening during those time intervals when the trajectory does not rotate clockwise in phase space? What new dynamics are responsible for the new frequencies observed during type-2 behavior? The answers to these questions will hopefully result in new insight into the large-scale dynamics of these systems.
ACKNOWLEDGMENTS
This work was supported in part by the National Institutes of Health under Grants No. HL075515–S03, HL075515–S04 (F.H.F.) and HL075515 (R.F.G.). This research also was supported in part by the National Science Foundation through TeraGrid resources provided by Pittsburgh Supercomputing Center.
Footnotes
PACS number(s): 87.19.Hh, 87.10.−e, 87.18.Nq, 05.65.+b
References
- 1.Bub G, Shrier A, Glass L. Phys. Rev. Lett. 2005;94:028105. doi: 10.1103/PhysRevLett.94.028105. [DOI] [PubMed] [Google Scholar]
- 2.Jung P, Wang J, Wackerbauer R, Showalter K. Phys. Rev. E. 2000;61:2095. doi: 10.1103/physreve.61.2095. [DOI] [PubMed] [Google Scholar]
- 3.Jung P, Cornell-Bell A, Madden KS, Moss F. J. Neurophysiol. 1998;79:1098. doi: 10.1152/jn.1998.79.2.1098. [DOI] [PubMed] [Google Scholar]
- 4.Xie F, Qu Z, Weiss JN, Garfinkel A. Phys. Rev. E. 2001;63:031905. doi: 10.1103/PhysRevE.63.031905. [DOI] [PubMed] [Google Scholar]
- 5.Samie FH, Berenfeld O, Anumonwo J, Mironov SF, Udassi S, Beaumont J, Taffet S, Pertsov AM, Jalife J. Circ. Res. 2001;89:1216. doi: 10.1161/hh2401.100818. [DOI] [PubMed] [Google Scholar]
- 6.Sarkar RR, Banerjee S. Math. Biosci. 2005;196:65. doi: 10.1016/j.mbs.2005.04.001. [DOI] [PubMed] [Google Scholar]
- 7.Lello J, Norman RA, Boag B, Hudson PJ, Fenton A. Am. Nat. 2008;171:176. doi: 10.1086/525257. [DOI] [PubMed] [Google Scholar]
- 8.Pilyugin SS, Antia R. Bull. Math. Biol. 2000;62:869. doi: 10.1006/bulm.2000.0181. [DOI] [PubMed] [Google Scholar]
- 9.Hauben E, Roncarolo MG, Draghici E, Nevo U. Transpl Immunol. 2007;18:122. doi: 10.1016/j.trim.2007.05.006. [DOI] [PubMed] [Google Scholar]
- 10.Bairagi N, Roy PK, Chattopadhyay J. J. Theor. Biol. 2007;248:10. doi: 10.1016/j.jtbi.2007.05.005. [DOI] [PubMed] [Google Scholar]
- 11.Anderton CH. Rev. Dev. Econ. 2003;7(1):15. [Google Scholar]
- 12.Savill NJ, Hogeweg P. Theor Popul. Biol. 1999;56:243. doi: 10.1006/tpbi.1999.1431. [DOI] [PubMed] [Google Scholar]
- 13.Biktashev VN, Brindley J, Holden AV, Tsyganov MA. Chaos. 2004;14:988. doi: 10.1063/1.1793751. [DOI] [PubMed] [Google Scholar]
- 14.Fenton F, Karma A. Chaos. 1998;8:20. doi: 10.1063/1.166374. [DOI] [PubMed] [Google Scholar]
- 15.Allexandre D, Otani NF. Phys. Rev. E. 2004;70:061903. doi: 10.1103/PhysRevE.70.061903. [DOI] [PubMed] [Google Scholar]
- 16.Fenton FH, Cherry EM, Hastings HM, Evans SJ. Chaos. 2002;12:852. doi: 10.1063/1.1504242. [DOI] [PubMed] [Google Scholar]
- 17.Fox JJ, McHarg JL, Gilmour RF., Jr Am. J. Physiol. Heart Circ. Physiol. 2002;282:H516. doi: 10.1152/ajpheart.00612.2001. [DOI] [PubMed] [Google Scholar]
- 18.Fedorov VV, Lozinsky IT, Sosunov EA, Anyukhovsky EP, Rosen MR, Balke CW, Efimov IR. Heart Rhythm. 2007;4:619. doi: 10.1016/j.hrthm.2006.12.047. [DOI] [PubMed] [Google Scholar]
- 19.Blanchard P, Devaney RL, Hall GR. Differential Equations. Pacific Grove, CA: Brooks/Cole; 1997. [Google Scholar]
- 20.Guevara MR, Ward G, Shrier A, Glass L. Proceedings of the 11th Computers in Cardiology Conference; Los Angeles: IEEE Computer Society; 1984. p. 167. [Google Scholar]
- 21.Cherry EM, Fenton FH. Am. J. Physiol. Heart Circ. Physiol. 2004;286:H2332. doi: 10.1152/ajpheart.00747.2003. [DOI] [PubMed] [Google Scholar]
- 22.Radio Amateur’s Handbook. 54th ed. Newington, CT: American Radio Relay League; 1977. p. 524. [Google Scholar]
- 23.Echebarria B, Karma A. Phys. Rev. Lett. 2002;88:208101. doi: 10.1103/PhysRevLett.88.208101. [DOI] [PubMed] [Google Scholar]


