

Abstract
Recent advancements in magnetic resonance imaging (MRI) have enabled clinical imaging of human cortical bone (HCB), providing a potentially powerful new means for assessing bone health with molecular-scale sensitivities unavailable to conventional X-ray-based diagnostics. In HCB, MRI is sensitive to populations of protons (1H) partitioned among water and protein sources, which may be differentiated according to intrinsic nuclear magnetic resonance (NMR) properties such as chemical shift and transverse and longitudinal relaxation rates. Herein, these NMR properties were assessed in HCB donors from a broad age range, and four distinct 1H populations were consistently identified and attributed to five microanatomical sources. These findings show that modern HCB MRI contrast will be dominated by collagen-bound water, which can also be exploited to study HCB collagen via magnetization transfer.
Keywords: NMR, MRI, relaxometry, bone collagen, bone water, bone pore
INTRODUCTION
As the skeleton ages, the risk of fracture increases. This increasing propensity to fracture is not solely due to the well documented loss of bone mass with aging, but also to a deterioration in strength and toughness of bone (bone quality) (1). Clinical measurements of bone mass by gold-standard dual energy X-ray absorptiometry (DEXA) are relatively insensitive to soft tissue characteristics in bone such as water molecule distribution, which has been conclusively linked to the energy dissipation mechanisms of the bone matrix (2-8) and likely plays a pivotal role in bone quality. Unlike X-ray based imaging modalities, magnetic resonance imaging (MRI) is highly sensitive to the water microenvironment in tissue, as well as other molecular sources of 1H, and offers the potential to non-invasively evaluate bone quality. While conventional MRI methods are not suitable for imaging cortical bone because of its low proton density and short transverse relaxation time constants (T2), so-called ultra-short echo time (uTE) and related MRI methods have opened clinical MRI to hard tissue imaging (9-11). Recently these methods have produced high quality images of human cortical bone (HCB) (10,12) and raised the question of what bone characteristics can be derived from such images. Presented herein is a phenomenological and biophysical characterization of the uTE MRI-visible 1H nuclear magnetic resonance (NMR) signal of HCB. Specifically, unique contributions to the net HCB NMR signal are determined for both bound and mobile water, lipids, and bone matrix collagen. Knowledge of these signal contributions and their NMR properties is critical for future development and interpretation of cortical bone MRI and may form the foundation for a novel diagnostic of bone health.
Cortical bone is a complex composite of nano- and micro-structural components including type-I collagen, calcium phosphate mineral deposits, inter-osteonal lipids, and porous spaces such as haversian canals and the lacunar-canalicular system, which generally occur in repeating units of osteons (Fig. 1) (13-15). It is likely that each of these tissue components includes one or more distinct proton micro-environments, which differ according to their local chemical, magnetic and electrical milieu. For example, the collagen component is host to both macromolecular-adsorbed water and covalently-bound backbone protons, while mineral and porous spaces contain water with varying degrees of motional restriction, and lipids can be found in the cement line spaces between osteons (14). These proton micro-environments are too small to be spatially resolved with clinical MRI, but their 1H NMR signal contributions may be resolved by decomposing the net NMR signal into chemical shift and relaxation components. Presented here is a series of NMR measurements at 4.7 T, relevant signal decompositions, and physical manipulations of HCB specimens from cadaveric donors to identify common signal components and their micro-anatomical origins.
FIGURE 1.
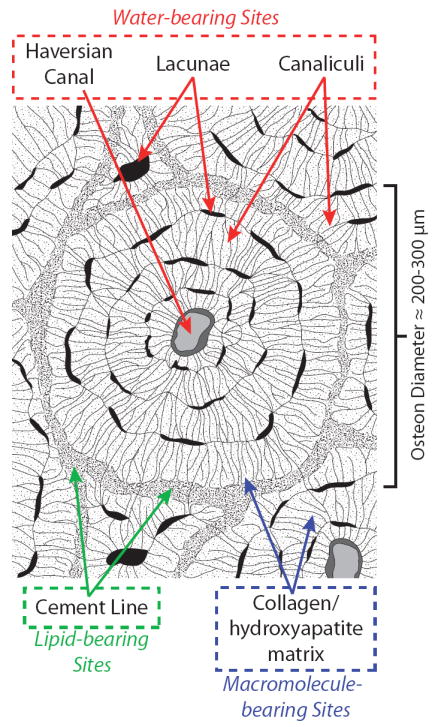
Bone matrix schematic. Expected biophysical distribution of osteonal water, lipid, and macromolecule-bearing proton sites in human cortical bone are identified in red, green, and blue, respectively. The primary nano- and microstructures housing each of these sites are given in dashed boxes.
METHODS
Human cortical bone preparation
The Musculoskeletal Tissue Foundation (Edison, NJ), a non-profit tissue allograft bank, and the Vanderbilt Donor Program (Nashville, TN) supplied human femurs from six cadaveric donors (four male, two female, aged 21-94 years old, mean ± standard deviation: 60 ± 31 years) under instruction to not provide tissue from donors who had tested positive for a blood borne pathogen (e.g., HIV or Hepatitis C). One HCB specimen was extracted from the medial mid-shaft of each donor’s right femur and was machined to 15×5×5 mm dimensions via end mill. During dimensioning, care was taken to remove endosteal and periosteal surfaces such that the final specimens for NMR measurement were pure cortical bone. Specimens were stored in phosphate-buffered saline at -20 °C between processing and NMR measurements, and specimens were thawed at 4 °C approximately 18 hours prior to NMR measurements. Immediately prior to NMR measurements, thawed specimens were removed from PBS and blotted dry to remove the large amount of pooled surface water that remained. Specimens endured no more than three freeze-thaw cycles, and separate experiments found that up to six freeze-thaw cycles had negligible impact on the NMR properties. Final HCB dimensions were measured with digital caliper for volume determination.
μCT
μCT was performed on 2×4×4 mm HCB specimens (harvested adjacent to NMR specimen femoral sites) with a Scanco μCT 40 scanner (Scanco Medical, Switzerland) at 6 μm isotropic resolution, which was sufficient to image the Haversian canal and vascular porosity. The osteons of the cortical specimen were aligned with the scanning axis using the standard tube. At a resolution of 6 um voxel size (isotropic), a portion of each specimen (2.4 mm in length) was scanned acquiring 1000 projections per 180°. X-ray source settings did not vary among the specimens. After reconstruction, the Scanco thresholding procedure segmented bone tissue from air or soft tissue. Applying the Scanco evaluation software to the cortical bone, we quantified porosity, defined as one minus cortical bone volume per total volume.
NMR measurements
The HCB specimens were initially assessed with measurements of their 1H NMR resonance spectra and transverse relaxation (T2) decays, probing NMR signal decay features that dominate uTE MRI contrast. NMR measurements were performed in a Varian 4.7T horizontal bore magnet with a Direct Drive Receiver (Varian Medical Systems, Palo Alto, CA). An in-house loop-gap style RF coil was used with Teflon structural support, which gave negligible background 1H signal (≈ 1% of net HCB signal). Pulse sequences used 90° excitation pulses of ≈ 8 μs duration and (where relevant) 180° refocusing/inversion pulses of ≈ 16 μs duration. Free induction decays (FIDs) were collected at 5MHz bandwidth and 20Hz nominal spectral resolution from a pulse-acquire sequence, with an 8μs dead time after excitation to allow for coil ringing to subside. Four excitations were averaged using cyclops phase cycling scheme. Resonance spectra were calculated from FIDs by discrete Fourier transform and manual phasing. To characterize T2, Carr-Purcell-Meiboom-Gill (CPMG) (16) measurements with a total of 10000 echoes were collected at 100 μs echo spacing (first echo at TE = 100 μs), yielding data which were fitted with a T2 spectrum (details below). Four excitations were averaged using a 90(x,-x,x,-x)/180(y,y,-y,-y) phase cycling scheme. Echo spacing was minimized while avoiding spin locking effects, which manifested as prolonged apparent T2s when echo spacing < 100 μs. In all measurements, HCB specimens were placed with osteonal direction orthogonal to Bo to avoid altering any potential magic angle effects across measurements.
Further investigation of both the FID and CPMG signal included three additional NMR studies: 1) Inversion recovery-prepared CPMG (IR-CPMG), 2) T2-T2 relaxation exchange spectroscopy (REXSY) (17), and 3) dynamic study of FID and CPMG signal responses to D2O immersion. The IR-CPMG measurements involved an inversion-recovery (IR) preparation with variable recovery time preceding a CPMG acquisition, as described above. Twenty-four recovery times, log-spaced between 1 ms and 10 sec, were used for each sample and the resulting data were fitted with a 2D T1-T2 spectrum (18) (details below). The REXSY measurements involved a CPMG-like preparation with variable number of echoes (NE) followed by a storage/mixing period then a CPMG acquisition, as described above. Thirty-two different CPMG preparations were used with echo spacing of 100μs and NE pseudo-log spaced between 1 and 1000. For all acquisitions, the mixing period was 200 ms, and the resulting data were fitted with a T2-T2 spectrum. REXSY measurements used an addition phase cycle of the storage pulse (to store T2-prepared magnetization on the ± z axis during the mixing period), resulting in a total of 4 averaged excitations. (For further details on using REXSY for exchange measurements see (19)). Finally, after all aforementioned NMR measurements, specimens were placed in an isotonic D2O solution to study effects of proton-deuteron exchange on NMR properties for determination of proton origins. This solution was made by mixing a volume of 99.9% isotopic purity D2O (Sigma-Aldrich Corp., St. Louis, MO) with the appropriate mass of PBS electrolyte tablets (MP Biomedicals, Solon, OH) to yield 1x PBS. Each bone specimen was immersed in a volume of isotonic PBS that was 100x larger than the specimen volume, and immersed specimens were maintained on a 60 RPM shaker table at 4 °C until steady state was achieved (as determined by monitoring NMR resonance spectra). Final NMR measurements were then collected for comparison to initial measurements.
NMR Data Fitting
After phasing, real-valued NMR resonance spectra were fitted to a sum of three Lorentzian lineshapes with a constrained Levenberg–Marquardt algorithm. For each spectrum, visual inspection provided initial guesses of linewidths and frequency offsets so as to improve algorithm convergence, and final inspections of residuals and mean square errors verified proper fitting.
The 10000 CPMG echo magnitudes were down-sampled in a pseudo-log fashion to 1024 echoes and fitted to a sum of 128 decaying exponential functions (with time constants log-spaced between 20 μs and 10 sec) in a non-negative least-squares sense, subject to a minimum curvature constraint, which produced a so-called T2 spectrum (20). IR-CPMG data were reduced by singular-value decomposition (21) prior to two-dimensional non-negative least squares fitting (18) to the aforementioned range of decaying exponentials, producing a so-called T1-T2 spectrum. REXSY data were processed in a similar manner, yielding T2-T2 spectra. All data processing was performed with MATLAB (The Mathworks, Natick, MA). Results are presented as mean ± one standard deviation across samples.
In order to quantitatively compare the absolute signal amplitudes of T2 spectra across specimens and days, a 20 μL H2O reference sample with long T2 (≈ 2.5 s) was included in each CPMG measurement. This reference sample, together with its known molar 1H density and the known HCB specimen volumes, enabled the calculation of proton concentrations in the bulk bone specimens for each CPMG relaxation component by comparing integrated areas of each T2 spectral component to the area of the marker. No such reference was used during resonance spectrum measurements, but the inter-measurement standard deviation of the reference sample’s signal intensity was 4.8 %, so it was concluded that the absolute amplitudes of the resonance spectral components were reliable to approximately this degree of precision.
RESULTS
FID-derived NMR resonance spectra (Fig. 2, A and B) revealed three distinct signal components, as determined by Lorentzian fitting: two relatively narrow-band, slow-relaxing chemically-shifted components were consistently observed atop a broad-band, fast-relaxing component. In all specimens, the narrow-band component linewidths were < 5 ppm and the broad-band component linewidths were > 100 ppm, giving clear discrimination between slow- and fast-relaxing species. The dominant narrow-band component accounted for 57.7 ± 3.9 % of the total FID signal. The second narrow-band component was consistently chemically shifted from the first component by −4.0 ± 0.2 ppm and represented 4.6 ± 3.2 % of the FID signal. The broadband component accounted for the remaining 33.7 ± 2.5 % of the FID signal and had a −33 ± 6.8 ppm chemical shift from the dominant narrow-band component. T2*s of 736 ± 46 μs, 1700 ± 470 μs, and 11.8 ± 1.1 μs for the on-resonant narrow-band, off-resonant narrow-band, and broad-band components, respectively, were calculated from the components’ linewidths.
FIGURE 2.

Wideline NMR and multiexponential T2 spectroscopy of human cortical bone specimens. NMR spectroscopy of human cortical bone specimens over narrow (A) and broad (B) bandwidths generally showed three frequency components in all samples: an off-resonant, narrow-band frequency component at -4.0±0.2 ppm (fat shifted) and on-resonant narrow-band and broad-band components. Spectra in (B) are magnified 15-fold in the vertical axis of (A) and are vertically cropped for display purposes. Multiexponential T2 spectroscopy of human cortical bone (C) reveals two well-defined T2 pools at 57±4 μs and 416±35 μs and a broad distribution of T2 components spanning 1 ms to 1000 ms. All spectra were normalized to maximum intensity (A, B) or total integrated area (C).
Fig. 2C shows CPMG-derived T2 spectra from each HCB specimen, demonstrating two distinct sub-millisecond relaxation components and a broad collection of signals spanning the millisecond-second T2 domain, which hereafter is collectively considered a third T2 component for discussion purposes. The two sub-millisecond components had T2s of 57 ± 4 μs and 416 ± 35 μs, with respective CPMG bone signal fractions of 16.1 ± 1.3 % and 60.8 ± 5.3 %. The long-lived third T2 component accounted for the remaining 23.0 ± 6.5 % of the CPMG signal. Comparing these signal fractions to the concomitantly-measured T2 marker (see NMR Data Fitting) gave proton concentrations of 6.6 ± 1.5, 24.8 ± 5.8, and 9.2 ± 2.3 mol 1H/Lbone for the ≈ 60 μs, ≈ 400 μs, and long-lived T2 components, respectively. Note that typical CPMG data signal-to-noise ratio was ≈ 7000 (integrated spectral area divided by the standard deviation of the residuals from the T2 spectrum fit), which was ample to fit the observed 60 μs T2 component. In preliminary studies, general characteristics of both resonance and T2 spectra did not change substantially between 0.5 T and 9.4 T static magnetic field strengths (data not shown), so the three FID and three CPMG signal components should be relevant to all mainstream laboratory and clinical HCB NMR.
For all HCB specimens, T1-T2 spectra from IR-CPMG measurements (Fig. 3) showed T1 values ranging from ≈ 350 ms for the two short-lived T2 components to ≈ 1 s for much of the long-lived T2 component. A bi-exponential T1 relaxation for the ≈ 400 μs T2 component was consistently observed, characteristic of magnetization transfer (MT) between this component and a shorter-T2 proton pool (22). Observable T2 proton pools participating in this MT were identified from REXSY T2-T2 spectra (Fig. 4). The main diagonal in the T2-T2 spectrum is analogous to the 1D CPMG-derived T2 spectrum, while off-diagonal signals arise from an exchange of magnetization between T2 components during the 200 ms mixing period (similar to EXSY experiments in chemical-shift resolved studies (23)). As such, REXSY consistently indicated exchange between the two short-lived T2 components (≈ 60 μs and ≈ 400 μs). No significant exchange involving the long-lived T2 signals was observed in any of the HCB samples.
FIGURE 3.
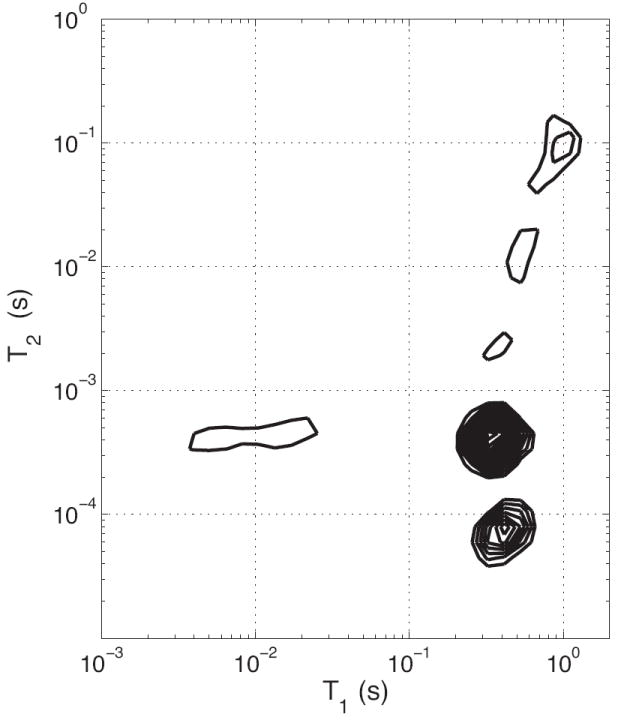
2D T1-T2 Spectra. Typical results from IR-CPMG data are shown, wherein the T1 relaxation time(s) for each T2 component may be identified after a 2D inverse Laplace transform. Note that all T2 components are monoexponential in T1 except for the 400 μs T2, which results from magnetization transfer with a shorter-lived T2 component.
FIGURE 4.
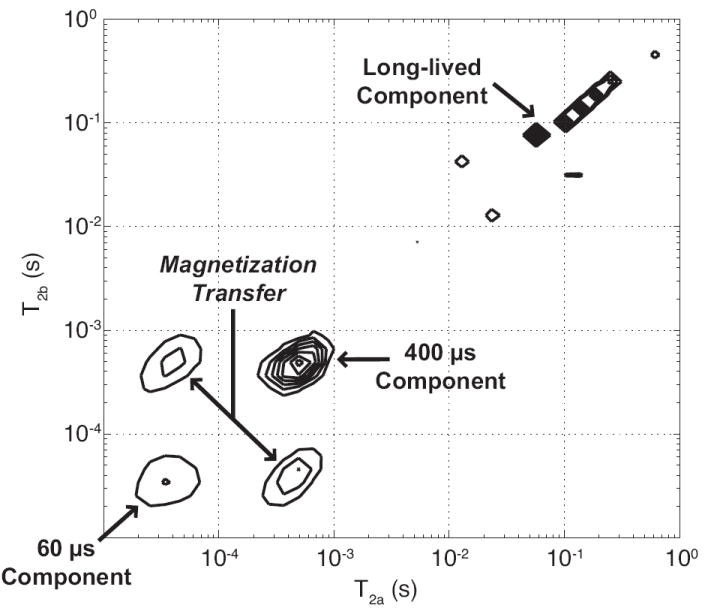
2-D exchange spectroscopy (REXSY) representative of all HCB specimens. Each of the three T2 components appear on the main diagonal (running lower-left to upper-right), which represents stationary nuclear spins that do not transit between pools during the 200 ms REXSY mixing period and thus maintain a fixed T2. Off-diagonal cross peaks, observed between the two short-lived T2 components, indicate spins that exchange via magnetization transfer mechanisms. Thus, the protons relaxing with T2 ≈ 60 μs and ≈ 400 μs are in molecular contact during the mixing period but effectively remain isolated from the long-lived protons.
Resonance and T2 spectra from a representative HCB specimen undergoing prolonged D2O immersion are shown in Fig. 5, A and B. Since the D2O deuteron is undetectable in 1H NMR measurements and may freely exchange with various protons in bone, these spectra demonstrate a combination of 1H signal components that wash out with D2O (i.e., water and chemically exchangeable protons such as amines and hydroxyls) and those that do not (methylene protons). Of the three resonance spectra components, the dominant on-resonant narrow-band component was the only component that was nearly completely washed out (> 95 %). The off-resonant narrow-band component was unaffected by D2O immersion, as was 83 ± 2 % of the broad-band component (17 ± 2 % washed out). Likewise, the only T2 component effectively removed by D2O was the ≈ 400 μs T2. (> 98 % washed out). The ≈ 60 μs T2 component was unaffected by D2O immersion (to within the tolerances associated with CPMG data fitting), and 58 ± 12 % of the long-lived T2 component was removed by D2O.
FIGURE 5.

Effects of D2O immersion on resonance and multiexponential T2 spectra of HCB specimens. Resonance (A) and T2 spectra (B) are shown at various time points for one representative HCB specimen undergoing D2O immersion. Resonance spectra, shown in grey and black, were fitted to the sum of three lorentzian components, which are overlaid in red, blue, and green. T2 spectra are divided into ≈ 60 μs (black), ≈ 400 μs (cyan), and long-lived (magenta) components for comparison to the three resonant components.
DISCUSSION
In animal (24-26) or human (27-31) cortical bones, previous studies have identified various subsets of the six NMR components observed herein but have not entirely agreed upon or thoroughly explored their biophysical origins. In particular, the large, sub-millisecond T2 component has been attributed to both macromolecular-bound water (25,27-31) and porous water of the lacunae and canaliculi (12,26). Because this signal will dominate most standard uTE MRI scans of cortical bone, understanding its biophysical origin and relation to all other signal components is important for interpreting cortical bone MRI. By comparing results from our combination of studies, we have reasoned the biophysical origins of all the FID and CPMG signal components. These assignments and relevant data are summarized in Fig. 6 and the rationale is outlined as follows.
FIGURE 6.

Postulated biophysical origins of NMR signal relaxation components in HCB. The signal contributions of FID (top) and CPMG (bottom) components to various biophysical proton sources (middle) are indicated by connecting arrows with the same color scheme as in FIGURE 5. FID and CPMG signals are first decomposed into three discrete T2* and T2 relaxation components, respectively, with relevant parameters shown in rounded rectangles. Via D2O immersion studies and 2-D exchange spectroscopy experiments, these relaxation components can then be assigned to specific proton sources (see Discussion). All components removed by D2O immersion are enclosed in the shaded area. If a component arises from more than one proton source, the pendant arrows transect approximate signal fractions (%) or proton concentrations (mol 1H/Lbone) to indicate the component’s distribution among sources.
Based on its chemical shift, endurance through D2O immersion, and relatively slow relaxation rate, the off-resonant FID component must arise from mobile methylene protons—most likely found on lipids (as similarly concluded by Fernandez-Seara, et. al. (6)). The line width of this component (≈ 1 ppm) corresponds to a T2* ≈ 1.6 ms; therefore, it must be present as a fraction of the long-T2 component (≈ 45 %) that also survives D2O immersion. Aside from the lipid signal, most of the remaining signal that survives D2O immersion—the broadband FID and short-lived CPMG components—must, by nature of their very short T2/T2* signals, be derived from relatively immobile methylene protons. The vast majority of these protons must belong to collagen macromolecules, which represent > 90 % of the organic mass in HCB (15). Note that both the broadband FID and short-lived CPMG components may arise from the same collagen molecules, but they likely do not originate from the same protons due to the ≈ 70 000 s-1 difference in their relaxation rates (1/T2* and 1/T2), which is too large to be entirely caused by static magnetic field variations and must arise from different molecular dynamics. It is conceivable that the faster-relaxing FID broadband protons occupy methylene sites on the semi-crystalline collagen triple helix backbone while the slower-relaxing ≈ 60 μs T2 CPMG protons arise from more mobile collagen methylene, such as side chain positions and the amorphous domains between crystalline regions. While previous cortical bone studies have not distinguished these two signal components, a study of dentin—a bone-like material—found two FID components with T2* ≈ 12 and 60 μs (32).
In contrast to the signal that survives D2O, the signal that washes out during D2O immersion must be a combination of water and non-water exchangeable protons (NWEPs, i.e. exchangeable protons that are not found on water). NWEPs in HCB arise chiefly from amides/hydroxides in collagen and hydroxides in bone minerals, and NWEP abundance can be estimated as follows: assuming that HCB collagen, on average, can be represented by the well-studied model sequences poly(Gly-Pro-Pro) (33) and poly(Pro-Hyp-Gly) (34), only 6-12% of collagen protons are exchangeable with D2O, representing 0.4-0.75% of total collagen mass. Given that one mL of HCB contains an average of 0.48g organic content (35)—greater than 90% of which is collagen (15)—the expected concentration of exchangeable collagen protons in bone is on the order of 1.7-3.2 mol 1H/Lbone. A similar analysis of bone mineral, using 1.2g mineral/mL bone (35) and a 0.042% weight fraction of exchangeable hydroxide protons (formulated from (36)), gives an expected concentration of 0.5 mol 1H/Lbone. Thus, collagen and mineral sources together give a total NWEP abundance of approximately 2-4 mol 1H/Lbone. Since NWEPs originate from rather immobile proton sites and are expected to be fast relaxing, it is likely that the fraction of the broadband FID component removed by D2O (≈ 6 % of the total FID signal) accounts for the entire NWEP population. However, it is possible that some of the NWEPs may contribute to the longer-lived FID and CPMG spectral components, but given that an average of 29.5 ± 7.2 mol 1H/Lbone signal was removed from CPMG spectra, we can conclude that this longer-lived signal is predominantly water. Unlike NWEPs, the so-called crystal water protons—ultra-fast-relaxing water in HCB mineral crystal lattice vacancies (37)—must be confined to the small fraction of the broadband FID component removed by D2O, although the relative contributions of NWEPS and crystal water to this broadband fraction cannot be determined from the measurements herein. With this interpretation, the range of water volume fractions (assuming 1 g/ml water density) found in our 6 HCB specimens was 17.3 - 35.6 %, which is similar to that found from a cohort of pre- and post-menopausal volunteers and renal osteodystrophy patients (12).
The water signal can be further decomposed into two sub-populations: collagen-bound water (again, collagen being the predominant macromolecule) and relatively free water in porous spaces. Based on μCT at 6 μm isotropic resolution, Haversian canal porosity of the HCB specimens in this study was 4.0 ± 1.0 %, and we estimate a similar volume of lacunar-canalicular pores (14), making the total average pore volume of the samples ≈ 8 %, or ≈ 9 mol 1H/Lbone. We expect the pore water to have a longer T2 than the bound water, and ≈ 1/2 of estimated pore water volume can be accounted for by the 5.1 ± 2.2 mol 1H/Lbone that washed out of the long-T2 component. The remaining pore water may be included in the ≈ 400 μs T2 CPMG component (accounting for no more than ≈ 15 % of it) and/or some of this water may have been wicked inadvertently from the larger pores during sample handling. Thus, including possible contributions of both NWEPs and porous water, the remainder of the ≈ 400 μs T2 CPMG component must be at least ≈ 70 % collagen-bound water (or 17.4 - 24.8 mol 1H/Lbone). This assignment is roughly consistent with literature estimates of 0.48 g collagen per mL of HCB (35) and 0.49 g water bound per gram collagen in bone, which together equate to an expected bound-water proton concentration of ≈ 26 mol 1H/Lbone.
The assignments of the ≈ 60 μs and ≈ 400 μs components to collagen methylene protons and collagen-bound water, respectively, are also consistent with the observation of exchange between these components seen in our RESXY measurements (Fig 4). Interestingly, the observation that REXSY demonstrates exchange between these two components but only the ≈ 400 μs T2 component is removed by D2O indicates that the observed magnetization exchange is mediated by a through-space, dipole-dipole interaction rather than chemical exchange, which further supports our biophysical assignments. It also is noteworthy that our biophysical assignments in HCB are similar to previous findings in human dentin (32) (determined through 1H NMR relaxometry and sample dehydration), with one particular exception: the ≈ 60 μs decay component in dentin was attributed to a mixture of hydroxide and water, in addition to protein. At least one other study has identified very-short lived water in bone mineral (37); however, it disappeared with dehydration and so we presume it would be washed out with D2O. Herein, we conclude that the 60-μs T2 component is predominantly protein-derived because it survives D2O immersion.
Finally, it should be noted that the broad age range of the HCB donors herein allowed the study of common relaxation features across presumably diverse physiological states. Interestingly, relaxation rates among all the donors were similar, indicating that the chemical nature of various bone proton milieux persist during aging. The dominant source of variability observed among donors was in the relaxation component pool sizes; for example, the oldest and most visibly osteoporotic donor had a larger long-lived T2 component (Fig 2c, turquoise line) than the other donors. However, a thorough analysis of the inter-donor relaxation differences would require a significantly larger number of donors, which is beyond the scope of this work but is the subject of future study.
CONCLUSIONS
In summary, 1H NMR signal from human cortical bone was found to exhibit a broad distribution of transverse relaxation components attributable to known bone proton sources (Fig. 6) as follows: i) T2* ≈ 12 μs, derived ≈ 80 % from collagen backbone methylene protons and the remainder from non-water exchangeable protons (amide/hydroxide) and possibly adsorbed mineral water, ii) T2 ≈ 60 μs, derived predominantly from collagen side-chain or otherwise mobile methylene protons, iii) T2 ≈ 400 μs, derived predominantly from water bound to the collagen responsible for the 12 μs T2* and 60 μs T2 components, iv) T2 ≈ milliseconds-second, derived ≈ 60 % from pore water and ≈ 40 % from lipid methylene protons. These findings indicate that modern uTE MRI of cortical bone is dominated by signal from water bound to bone matrix collagen, and that commonly-used long-T2 suppression techniques for enhancing bone contrast will suppress signal from lipids and pore space water that may be of biological/clinical interest. Also, while some short-T2 signals in HCB may be difficult to quantify directly, the interaction between their underlying proton pool and the dominant water signal offers the potential to probe prohibitively fast-relaxing HCB signals through magnetization transfer contrast. Finally, there was considerable variability in the lipid and pore water content across the diverse (albeit small number of) human cortical bone samples studied herein, indicating these two metrics may contain the useful information on bone quality and health.
Acknowledgments
The authors would like to acknowledge financial support from the NIH, Grant # EB001744, and the NSF, Grant # 0448915.
References
- 1.Johnell O, Kanis JA, Oden A, Johansson H, De Laet C, Delmas P, Eisman JA, Fujiwara S, Kroger H, Mellstrom D, Meunier PJ, Melton LJ, O’Neill T, Pols H, Reeve J, Silman A, Tenenhouse A. Predictive value of BMD for hip and other fractures. J Bone Miner Res. 2005;20(7):1185–1194. doi: 10.1359/JBMR.050304. [DOI] [PubMed] [Google Scholar]
- 2.Bembey AK, Bushby AJ, Boyde A, Ferguson VL, Oyen ML. Hydration effects on the micro-mechanical properties of bone. J Mater Res. 2006;21(8):1962–1968. [Google Scholar]
- 3.Nyman JS, Roy A, Shen XM, Acuna RL, Tyler JH, Wang XD. The influence of water removal on the strength and toughness of cortical bone. J Biomech. 2006;39(5):931–938. doi: 10.1016/j.jbiomech.2005.01.012. [DOI] [PMC free article] [PubMed] [Google Scholar]
- 4.Yan JH, Daga A, Kumar R, Mecholsky JJ. Fracture toughness and work of fracture of hydrated, dehydrated, and ashed bovine bone. J Biomech. 2008;41(9):1929–1936. doi: 10.1016/j.jbiomech.2008.03.037. [DOI] [PubMed] [Google Scholar]
- 5.Sasaki N, Enyo A. Viscoelastic properties of bone as a function of water-content. J Biomech. 1995;28(7):809–815. doi: 10.1016/0021-9290(94)00130-v. [DOI] [PubMed] [Google Scholar]
- 6.Fernandez-Seara MA, Wehrli SL, Takahashi M, Wehrli FW. Water content measured by proton-deuteron exchange NMR predicts bone mineral density and mechanical properties. J Bone Miner Res. 2004;19(2):289–296. doi: 10.1359/JBMR.0301227. [DOI] [PubMed] [Google Scholar]
- 7.Bembey AK, Oyen ML, Bushby AJ, Boyde A. Viscoelastic properties of bone as a function of hydration state determined by nanoindentation. Philos Mag. 2006;86(33-35):5691–5703. [Google Scholar]
- 8.Nyman JS, Ni QW, Nicolella DP, Wang XD. Measurements of mobile and bound water by nuclear magnetic resonance correlate with mechanical properties of bone. Bone. 2008;42(1):193–199. doi: 10.1016/j.bone.2007.09.049. [DOI] [PMC free article] [PubMed] [Google Scholar]
- 9.Balcom BJ, MacGregor RP, Beyea SD, Green DP, Armstrong RL, Bremner TW. Single-point ramped imaging with T-1 enhancement (SPRITE) J Magn Reson Ser A. 1996;123(1):131–134. doi: 10.1006/jmra.1996.0225. [DOI] [PubMed] [Google Scholar]
- 10.Idiyatullin D, Corum C, Park JY, Garwood M. Fast and quiet MRI using a swept radiofrequency. J Magn Reson. 2006;181(2):342–349. doi: 10.1016/j.jmr.2006.05.014. [DOI] [PubMed] [Google Scholar]
- 11.Gatehouse PD, Bydder GM. Magnetic resonance imaging of short T-2 components in tissue. Clin Radiol. 2003;58(1):1–19. doi: 10.1053/crad.2003.1157. [DOI] [PubMed] [Google Scholar]
- 12.Techawiboonwong A, Song HK, Leonard MB, Wehrli FW. Cortical bone water: In vivo quantification with ultrashort echo-time MR imaging. Radiology. 2008;248(3):824–833. doi: 10.1148/radiol.2482071995. [DOI] [PMC free article] [PubMed] [Google Scholar]
- 13.Olszta MJ, Cheng XG, Jee SS, Kumar R, Kim YY, Kaufman MJ, Douglas EP, Gower LB. Bone structure and formation: A new perspective. Mater Sci Eng R. 2007;58(3-5):77–116. [Google Scholar]
- 14.Cowin SC. Bone poroelasticity. J Biomech. 1999;32(3):217–238. doi: 10.1016/s0021-9290(98)00161-4. [DOI] [PubMed] [Google Scholar]
- 15.Weiner S, Wagner HD. The material bone: Structure mechanical function relations. Annu Rev Mater Sci. 1998;28:271–298. [Google Scholar]
- 16.Meiboom S, Gill D. Modified Spin-Echo Method for Measuring Nuclear Relaxation Times. Rev Sci Instrum. 1958;29(8):688–691. [Google Scholar]
- 17.Callaghan PT, Arns CH, Galvosas P, Hunter MW, Qiao Y, Washburn KE. Recent Fourier and Laplace perspectives for multidimensional NMR in porous media. Magnetic Resonance Imaging. 2007;25(4):441–444. doi: 10.1016/j.mri.2007.01.114. [DOI] [PubMed] [Google Scholar]
- 18.English AE, Whittall KP, Joy MLG, Henkelman RM. Quantitative 2-dimensional time correlation relaxometry. MagnResonMed. 1991;22(2):425–434. doi: 10.1002/mrm.1910220250. [DOI] [PubMed] [Google Scholar]
- 19.Dortch RD, Horch RA, Does MD. Development, simulation, and validation of NMR relaxation-based exchange measurements. Journal of Chemical Physics. 2009;131(16):11. doi: 10.1063/1.3245866. [DOI] [PMC free article] [PubMed] [Google Scholar]
- 20.Whittall KP, Mackay AL. Quantitative interpretation of NMR relaxation data. J Magn Reson. 1989;84(1):134–152. [Google Scholar]
- 21.Venkataramanan L, Song YQ, Hurlimann MD. Solving Fredholm integrals of the first kind with tensor product structure in 2 and 2.5 dimensions. IEEE Trans Signal Process. 2002;50(5):1017–1026. [Google Scholar]
- 22.Edzes HT, Samulski ET. Measurement of cross-relaxation effects in proton NMR spin-lattice relaxation of water in biological-systems - hydrated collagen and muscle. J Magn Reson. 1978;31(2):207–229. [Google Scholar]
- 23.Macura S, Huang Y, Suter D, Ernst RR. Two-dimensional chemical-exchange and cross-relaxation spectroscopy of coupled nuclear spins. J Magn Reson. 1981;43(2):259–281. [Google Scholar]
- 24.Turov VV, Gun’ko VM, Zarko VI, Leboda R, Jablonski M, Gorzelak M, Jagiello-Wojtowicz E. Weakly and strongly associated nonfreezable water bound in bones. Colloids Surf B. 2006;48(2):167–175. doi: 10.1016/j.colsurfb.2006.02.001. [DOI] [PubMed] [Google Scholar]
- 25.Fantazzini P, Brown RJS, Borgia GC. Bone tissue and porous media: common features and differences studied by NMR relaxation. Magn Reson Imaging. 2003;21(3-4):227–234. doi: 10.1016/s0730-725x(03)00129-2. [DOI] [PubMed] [Google Scholar]
- 26.Ong HH, Wehrli SL, Wehrli FW. Proton NMR Study of Transverse Relaxation in Rabbit and Rat Cortical Bone. J Bone Miner Res. 2008;23:S494–S494. [Google Scholar]
- 27.Ni QW, King JD, Wang XD. The characterization of human compact bone structure changes by low-field nuclear magnetic resonance. Meas Sci Technol. 2004;15(1):58–66. [Google Scholar]
- 28.Wang XD, Ni QW. Determination of cortical bone porosity and pore size distribution using a low field pulsed NMR approach. J Orthop Res. 2003;21(2):312–319. doi: 10.1016/S0736-0266(02)00157-2. [DOI] [PubMed] [Google Scholar]
- 29.Ni QW, Santos ADL, Lam H, Qin YX. Assessment of simulated and functional disuse on cortical bone by nuclear magnetic resonance. Adv Space Res. 2007;40(11):1703–1710. [Google Scholar]
- 30.Ni QW, Nicolella DP. The characterization of human cortical bone microdamage by nuclear magnetic resonance. Meas Sci Technol. 2005;16(3):659–668. [Google Scholar]
- 31.Ni QW, Nyman JS, Wang XD, De Los Santos A, Nicolella DP. Assessment of water distribution changes in human cortical bone by nuclear magnetic resonance. Meas Sci Technol. 2007;18(3):715–723. [Google Scholar]
- 32.Schreiner LJ, Cameron IG, Funduk N, Miljkovic L, Pintar MM, Kydon DN. Proton NMR spin grouping and exchange in dentin. Biophys J. 1991;59(3):629–639. doi: 10.1016/S0006-3495(91)82278-0. [DOI] [PMC free article] [PubMed] [Google Scholar]
- 33.Boryskina OP, Bolbukh TV, Semenov MA, Gasan AI, Maleev VY. Energies of peptide-peptide and peptide-water hydrogen bonds in collagen: Evidences from infrared spectroscopy, quartz piezogravimetry and differential scanning calorimetry. J Mol Struct. 2007;827(1-3):1–10. [Google Scholar]
- 34.Berisio R, Vitagliano L, Mazzarella L, Zagari A. Crystal structure of a collagen-like polypeptide with repeating sequence Pro-Hyp-Gly at 1.4 angstrom resolution: Implications for collagen hydration. Biopolymers. 2000;56(1):8–13. doi: 10.1002/1097-0282(2000)56:1<8::AID-BIP1037>3.0.CO;2-W. [DOI] [PubMed] [Google Scholar]
- 35.Gong JK, Arnold JS, Cohn SH. Composition of Trabecular and Cortical Bone. Anat Rec. 1964;149:325–331. doi: 10.1002/ar.1091490303. [DOI] [PubMed] [Google Scholar]
- 36.Cho G, Wu Y, Ackerman JL. Detection of hydroxyl ions in bone mineral by solid-state NMR spectroscopy. Science. 2003;300(5622):1123–1127. doi: 10.1126/science.1078470. [DOI] [PubMed] [Google Scholar]
- 37.Wilson EE, Awonusi A, Morris MD, Kohn DH, Tecklenburg MMJ, Beck LW. Three structural roles for water in bone observed by solid-state NMR. Biophys J. 2006;90(10):3722–3731. doi: 10.1529/biophysj.105.070243. [DOI] [PMC free article] [PubMed] [Google Scholar]