Abstract
Chromium — Cr(VI) in the form of potassium dichromate — has been shown to specifically enhance white matter signal. The proposed mechanism for this enhancement is reduction of diamagnetic Cr(VI) to paramagnetic chromium species by oxidizable myelin lipids. The purpose of the study herein was to better understand the microanatomical basis of this enhancement (i.e., the relative enhancement of myelin, intra-axonal, and extra-axonal water). Toward this end, integrated T1–T2 measurements were performed in potassium dichromate loaded (hereafter referred to as chromated) rat brains, rat optic nerve samples, and frog sciatic nerve samples ex vivo. In control optic nerve and white matter, two T1–T2 components were resolved, representing myelin and non-myelin water (intra- and extra-axonal water). Following chromation, three T1–T2 components were resolved in these same tissues. Results from similar measurements in sciatic nerve — all three components are resolvable in control and chromated samples — and quantitative histological analysis suggest that this additional T1–T2 component is due to a splitting of the non-myelin water component into intra- and extra-axonal water components. This compartment-specific enhancement may provide unique contrast for MR histology as well as allow one to probe the compartmental basis of various contrast mechanisms in neural tissue.
Keywords: MRI, chromium, relaxometry, white matter, nerve
INTRODUCTION
Water from within myelin, intra-, and extra-axonal compartments of peripheral nerve can be isolated based upon multiexponential T1 and/or T2 (1-9). In cerebral white matter (10-12) and optic nerve (13,14), however, only two relaxation components are generally found: a short relaxation time component arising from myelin water and a long relaxation time component arising from a combination of intra- and extra-axonal water. The inability to resolve signals from intra- and extra-axonal water in white matter and optic nerve likely arises because each compartment exhibits similar relaxation characteristics. As a result, signal from these compartments could be isolated by preferentially altering the T1 and/or T2 of intra- or extra-axonal water using a compartment-specific contrast reagent. The resulting compartment-specific enhancement may provide unique contrast — compared to non-specific contrast reagents such as Gd-DTPA — for MR histology (15) as well as allow one to probe the compartmental basis of diffusion and magnetization transfer contrast in neural tissue.
Chromium, specifically Cr(VI) in the form of potassium dichromate, has been shown to result in white matter specific enhancement following injection into neural tissue (16). This enhancement is thought to arise due to reduction of diamagnetic Cr(VI) to paramagnetic chromium species [Cr(V) and/or Cr(III)] by oxidizable myelin lipids. That is, enhancement is “turned on” following tissue-specific reduction of Cr(VI). Though myelin lipids are thought to play a primary role, differential enhancement of intra- and extra-axonal water may occur as exchange with and/or access to paramagnetic chromium may be different for these compartments. Interestingly, enhancement has been shown to remain in vivo for up to 72 hours following intracerebroventricular (ICV) administration of potassium dichromate (16). This suggests that Cr(III), which is significantly more stable than intermediates such as Cr(V) (17), remains stably bound or complexed to oxidized compounds in white matter.
In this study, integrated T1–T2 measurements, which are sensitive to the correlated T1 and T2 within a spin group (18,19), were made on potassium dichromate loaded (hereafter referred to as chromated) rat brains ex vivo to ascertain its ability to isolate signal from intra- and extra-axonal water in white matter. Additional studies were performed in optic nerve, a commonly used model for white matter. This model was chosen for this study because the time needed to homogeneously distribute reagents is expected to be relatively short in optic nerve, allowing studies to be performed in freshly excised tissue prior to the significant changes in morphology due to autolysis. These studies were performed ex vivo because: i) they require high signal-to-noise ratio (SNR) and ii) potassium dichromate is a known carcinogen (20).
In order to further investigate the compartmental basis of contrast enhancement chromated nerve, additional relaxation measurements were made in normal and chromated frog sciatic nerve. This model system was chosen because its relaxation characteristics and corresponding compartmental origins have been relatively well characterized (1,3-7). Furthermore, each component of anatomical relevance (myelin, intra-, and extra-axonal) should be resolvable in both normal and chromated nerve, allowing inference of each compartment’s relative access to the contrast reagent. To validate our NMR-based interpretations of the compartmental distribution of chromium in nerve, spatially resolved elemental analysis was performed via synchrotron X-ray fluorescence (μXRF) microscopy. This work represents the first attempt to quantitatively characterize the compartmental relaxivity of chromium in white matter and nerve.
MATERIALS AND METHODS
Sample Preparation
Adult Sprague-Dawley rats and African clawed frogs (Xenopus laevis) were used for all studies in accordance with protocols approved by the Institutional Animal Care and Use Committee of Vanderbilt University. All studies were performed in excised rat brain, rat optic nerve, or frog sciatic nerve.
Rat Brain
Rats were euthanized via CO2 inhalation. Following euthanasia, brains were excised, dried of excess fluid, and loaded with either potassium dichromate (chromated brains, n = 8) or Gd-DTPA (Gd-enhanced brains, n = 2).
Chromated brains were prepared by immersion in 85 mM potassium dichromate (K2Cr2O7; Sigma, Taufkirchen, Germany) dissolved in phosphate buffered saline (PBS; Mediatech Inc., Herdon, VA) for 72 hrs (pH = 5). These brains were then placed into fresh PBS, washing daily for ≈ 1 week. This period was chosen because it represented the point at which most excess potassium dichromate had diffused out of the brain (determined from color of PBS at each 24-hour interval). These studies were performed in fresh tissue (i.e., without any aldehyde fixation) because aldehydes are known reductants, which, if present, would reduce Cr(VI) before reaching the targeted reductants in tissue (see Discussion for details). Gd-enhanced brains were first fixed by immersion in 10% neutral buffered formalin (VWR, West Chester, PA) for 24 hrs then washed in PBS for ≥ 48 hrs to wash out excess fixative. These brains were then immersed in 1 mM Gd-DTPA (Magnevist®; Belex, Montville, NJ) dissolved in PBS until the contrast reagent was evenly distributed throughout the brain (≥ 6 days).
Following contrast reagent loading, brains were placed in a custom-built holder and bathed in buffer solution. Chromated brains were immersed in perfluorcarbon solution (Fomblin®; Solvay Solexis, Thorofare, NJ) to prevent tissue drying without contributing proton signal, while Gd-enhanced brains were immersed in the same Gd-DTPA solution used for contrast reagent loading to ensure that contrast-enhancement was constant during each measurement.
Rat Optic Nerve
Rats were euthanized via CO2 inhalation. Following euthanasia, both optic nerves were excised from the optic chiasm to the skull, dried of excess fluid, and immersed in either potassium dichromate (chromated optic nerves, n = 4) or PBS (control optic nerve, n = 3) at room temperature.
Chromated optic nerve samples were prepared by immersion in 85 mM potassium dichromate dissolved in phosphate buffered saline for 1 hr. These optic nerve samples were then placed into fresh PBS, washing at least two times over a period of approximately 3 hrs. Control nerve samples remained in PBS during this 4-hr period. Immediately after each treatment period, samples were placed in 5-mm NMR tubes, bathed in perfluorcarbon solution, and NMR measurements were performed.
Following NMR, one control and one chromated sample was processed for μXRF microscopy. To do so, samples were fixed by immersion in 4% glutaraldehyde in 0.1 M phosphate buffer (pH 7.0), post-fixed in osmium tetroxide, and embedded in Epon. Sections (1 μm thick) were cut from these blocks and mounted onto a silicon nitride membrane. The mounted sections were then evaluated via μXRF microscopy.
Frog Sciatic Nerve
Frogs were euthanized by immersion in a 10 g/L bath of tricaine methanesulfonate (Finquel®; Argent, Redmond, WA) for 20–30 minutes. Following euthanasia, 1–2 cm segments of sciatic nerve were excised from each hind leg, yielding two samples from each frog. Samples were then cleaned of attached blood and soft tissue, dried of excess fluid, and immersed in either potassium dichromate (chromated nerves, n = 2) or amphibian Ringer’s solution (control nerves, n = 2) at room temperature.
Chromated sciatic nerve samples were prepared by immersion in 160 mM potassium dichromate dissolved in amphibian Ringer’s solution (Fisher Scientific, Rochester, NY) for 1 hour (pH = 4.6). These samples were then placed in fresh amphibian Ringer’s solution, washing four times for approximately 1½ hours. Control samples remained in amphibian Ringer’s solution during this period. Immediately after each treatment period, samples were placed in 5-mm NMR tubes and bathed in fresh amphibian Ringer’s solution, at which time NMR measurements were performed. Following NMR, one control and two chromated samples were processed for μXRF microscopy using the same procedure described for the optic nerve samples.
Note the different chromation/washing period used in brain, optic nerve, and sciatic nerve. These periods were determined for each tissue experimentally to ensure that reagents were homogenously distributed throughout the tissue and excess chromium was removed, allowing compartmental differences in enhancement to be observed.
Data Acquisition
MRI of Brain
All measurements were made at bore temperature (≈ 20°C) using a 7.0-T, 16-cm bore Varian Inova spectrometer (Varian Inc., Palo Alto, CA) equipped with imaging gradients capable of generating 27 G/cm with switching times to full amplitude of 100 μs. A 25-mm diameter Litz RF coil (Doty Scientific, Columbia, SC) was used for RF transmission and signal reception.
For each rat brain, a single 1.5-mm slice orthogonal to the corpus callosum at its intersection with the fornix was first selected from coronal fast spin-echo scout images (Fig. 1a). Integrated T1–T2 measurements were then made using an inversion-recovery prepared multiple spin-echo (IR-ME) sequence at sixteen different inversion-recovery delays (TI) ranging logarithmically between 30 ms and 2 s, acquiring 32 echoes (NE) at a spacing of 6.5 ms (TE) for each inversion time. Additional imaging parameters included a 4-s repetition time to ensure thermal equilibrium before each inversion pulse, an acquisition bandwidth of 50 kHz, a 20 × 20 mm2 field of view, a 64 × 64 acquisition matrix, and two averaged excitations (NEX). To ensure uniform inversion over the sample, a 5-ms hyperbolic secant inversion pulse was used (21). Also, spoiler gradients were placed about each 90x180y90x broadband composite refocusing pulse (22) in an alternating and descending fashion (23) in order to remove signal from unwanted coherence pathways. The spoiler gradients were calculated so as to cause a minimum phase dispersion of π/2 across one slice thickness, which was found to be sufficiently large to remove artifacts within the decay curve.
Fig. 1.
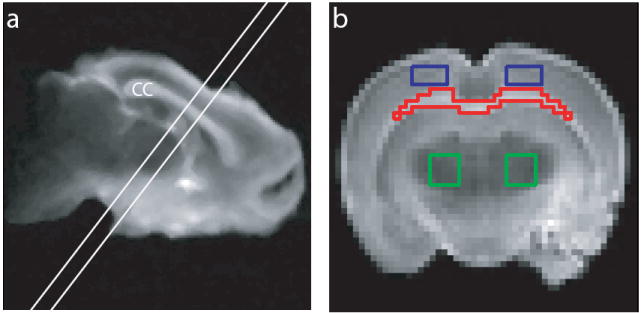
(a) Sample T2-weighted fast spin-echo coronal image, identifying a 1.5-mm slice orthogonal to the corpus callosum (cc) for T1–T2 measurements. The image was median-filtered for display purposes. (b) Resultant 1.5-mm slice from (a), identifying sample ROIs used for T1–T2 analysis. Shown are ROIs for corpus callosum (red), cortical grey matter (blue), and sub-cortical grey matter (green). Signal from contralateral ROIs in grey matter were summed prior to spectral analysis.
NMR of Nerve
All measurements were made at bore temperature (≈ 20°C) using the same spectrometer described for the rat brain studies. An in-house-built loop-gap resonator (10 mm in diameter, 20 mm long) was used for RF transmission and signal reception.
For each optic and sciatic nerve sample, integrated T1–T2 measurements were made with an inversion-recovery prepared CPMG sequence (IR-CPMG) using 24 or 32 different logarithmically-spaced TI values (the range of values for each sample was chosen to ensure that the T1 recovery curve was adequately sampled), 2000 echoes, a 1-ms TE, a four-step phase cycle, and 4 NEX. In all samples, the predelay was long enough to ensure thermal equilibrium was achieved prior to the inversion pulse.
μXRF of Nerve
Scanning X-ray fluorescence microscopy was performed at the 2-ID-D beamline of the Advanced Photon Source at Argonne National Laboratory (IL, USA) (24). The X-ray source was a 3.3-cm-period undulator, and X-rays were monochromatized by a double-crystal 111Si monochromator. A Fresnel zone plate focused the X-ray beam on the sample to a spot size of 0.3 × 0.2 μm2 (25). The flux at the focal spot was measured to be ≈ 4 × 10⁹ photons/s using an ionization chamber in place of the sample. The specimen was placed in a helium environment and mounted on an X–Y translation stage at 75° to the incident beam. An energy-dispersive silicon drift detector (SII NanoTechnology, Chiba, Japan) was used to collect X-ray fluorescence spectra from the sample while it was being scanned across the focal spot. In this way, spatial maps of many different elements were acquired simultaneously. An incident X-ray energy of 10 keV was used to excite Kα emission lines for elements from Si to Zn.
Data Analysis
T1–T2 Data
For rat brain data, region-of-interest (ROI) analysis was performed with ROIs defined within the corpus callosum, cortical grey matter, and sub-cortical grey matter (Fig. 1b). To remove bias from Rician noise, the maximum-likelihood estimator of each Rician-distributed ROI value was estimated (26). For nerve data, the non-localized CPMG data were analyzed.
In order to satisfy nonnegativity constraints imposed by non-negative least-squares (NNLS) (27) fitting, inversion-recovery data were transformed to a decay by subtracting IR-ME and IR-CPMG data from corresponding equilibrium data. The distribution of T1s and T2s, or T1–T2 spectrum, within each brain ROI or nerve sample, was then determined by fitting the transformed data y(τi,tj) to
| (1) |
in an NNLS sense (27) where Smn is the magnitude of each fitted exponential component and τi and tj are the experimental parameters TI and TE, respectively. A logarithmically spaced grid (50 × 50) of relaxation times (T1m and T2n) was used for each fit with a range spanning all expected values within each sample. An additional minimum Laplacian constraint was incorporated into these fits to regularize the solution. This constraint smoothes the T1–T2 spectra and is analogous to minimum curvature constraints (28) commonly used to regularize the inversion of one-dimensional relaxation data. The regularizer parameter, which increases the weight of this minimum Laplacian constraint at the expense of data misfit, was set within the range of values small enough to allow resolution of neighboring peaks, yet large enough to minimize spurious peaks. In order to reduce computational time, data and model dimensionality were reduced using a singular value decomposition approach prior to inversion (29).
Component relaxation times, defined as the mean relaxation time for a given component, and signal fractions, defined as the summed component signal divided by the total summed spectral signal, were calculated for observed components in each spectrum. Components not found in all samples were deemed spurious and ignored in these calculations. A short-T1 component found in Gd-enhanced samples (Fig. 2c, 3a, and 3c), which was thought to arise due to magnetization transfer (MT) effects, was also ignored in these calculations. All reported values are given as mean (±SD) across samples within a given group unless otherwise stated.
Fig. 2.
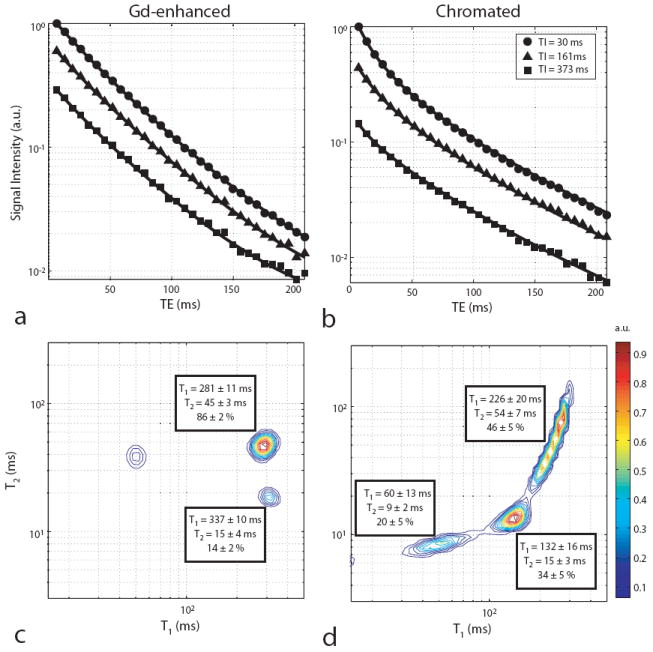
Sample normalized signal intensities (a & b) and corresponding T1–T2 spectra (c & d) for Gd-enhanced (a & c) and chromated (b & d) white matter. (a & b) Shown are the decay curves for three of the sixteen inversion times along with model fits from Eq. 1. Note the deviation from a straight line for each semi-log plot, indicative of multiexponential decay. All errorbars were smaller than the markers used for plotting and were, therefore, omitted. (c & d) The component relaxation times and signal fractions averaged across samples are shown for each T1–T2 spectrum. Spurious components along with those likely arising from MT effects [unlabeled short-T1 component in (c)] were ignored in the pool fraction calculation.
Fig. 3.
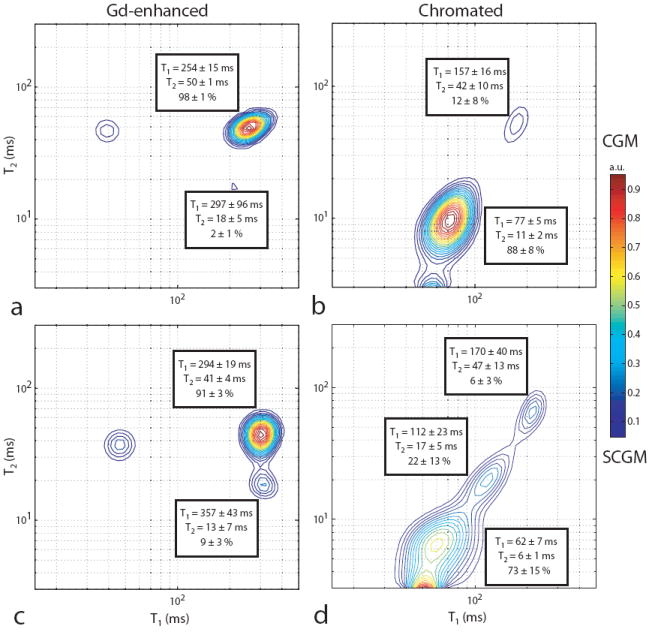
Sample normalized grey matter T1–T2 spectrum for Gd-enhanced (a & c) and chromated (b & d) brains. Spectra from cortical (CGM, a & b) and sub-cortical (SCGM, c & d) grey matter signal are shown along with the component relaxation times and signal fractions averaged across samples. Spurious components along with those likely arising from MT effects [unlabeled short-T1 component in (a & c)] were ignored in the pool fraction calculation.
μXRF
XRF spectra from each voxel were fitted using the MAPS program (30) to remove overlaps between adjacent Kα emission lines. Elemental fluorescence intensities were then converted to areal densities (μg/cm2) by comparing X-ray fluorescence intensities with those from thin film standards NBS-1832 and NBS-1833 (NIST, Gaithersburg, MD).
RESULTS
MRI of Rat Brain
Typical data from chromated and Gd-enhanced white matter along with corresponding model fits (Eq. 1) and T1–T2 spectra are shown in Fig. 2. Although inversion of these data into a relaxation spectrum is a difficult numerical problem, with sufficient SNR and appropriate regularization, reproducible results can be obtained. Data from chromated white matter had an SNR > 2000 in all cases — where SNR is defined as the echo magnitude at TE/TI = 6.5/2000 ms divided by the standard deviation of the background noise after correction for its Rayleigh bias. Simulations (results not shown) indicated this SNR to be sufficient to resolve the T1–T2 components shown in Fig. 2. The SNRs from all other ROIs and samples were of the same order of magnitude.
T1–T2 spectra from chromated white matter signal (Fig. 2d) revealed three distinct components, each with different T1 and T2 values. Across samples, mean signal fractions were 20 ± 5, 34 ± 5, and 46 ± 5% for components with short (T1 = 60 ± 13 ms, T2 = 9 ± 2 ms), intermediate (T1 = 132 ± 16 ms, T2 = 15 ± 3 ms), and long relaxation times (T1 = 226 ± 20 ms, T2 = 54 ± 7 ms), respectively. Interestingly, these spectra are similar to those previously observed in peripheral nerve (4,8,9). Also, the relative sizes of the spectral components (in order of increasing relaxation times) are in reasonable agreement with electron microscopy derived values of water content in the myelin, extra-, and intra-axonal spaces, respectively, of crayfish abdominal nerve (31) — a model tissue for mammalian white matter.
T1–T2 spectra from Gd-enhanced white matter signal (Fig. 2c) also revealed three components in total, but were biexponential in either T1 or T2, which is consistent with previous measures in normal white matter (10-12,32). The unlabeled short-T1 component in these spectra is thought to arise due to MT effects (32) (see Discussion for details), while the two long-T1 components are thought to represent distinct water compartments in white matter. Considering only signal arising from these water compartments, mean signal fractions across samples were 14 ± 2 and 86 ± 2% for short- (T1 = 337 ± 10 ms, T2 = 15 ± 4 ms) and long-T2 components (T1 = 281 ± 11 ms, T2 = 45 ± 3 ms), respectively. As in normal white matter, the long-T2 component observed in Gd-enhanced white matter is thought to represent a combination of intra- and extra-axonal water, while the short-T2 component is thought to represent myelin water.
Sample grey matter T1–T2 spectra are shown in Fig. 3 (from cortical and sub-cortical ROIs in Fig. 1). Similar to white matter, chromation of grey matter resulted in multiple relaxation components that were unique in both T1 and T2. Gd-enhanced grey matter also presented similar to its corresponding signal from white matter. The short-T2 component signal fraction found in Gd-enhanced white matter (14 ± 2%), cortical grey matter (2 ± 1%), and sub-cortical grey (9 ± 3%) matter are thought to reflect differences in myelin content within each of these ROIs.
NMR of Optic Nerve
T1–T2 spectra from control and chromated rat optic nerve are given in Fig. 4. For control optic nerve, two signal components were observed in all samples, which is consistent with studies performed by Stanisz et al. in bovine optic nerve (13,14), although a more recent study (33) has identified three signal components in rat optic nerve. Across samples, mean signal fractions were 14 ± 1 and 86 ± 1% for components with short (T1 = 987 ± 29 ms, T2 = 9 ± 1 ms) and long relaxation times (T1 = 1279 ± 48 ms, T2 = 83 ± 10 ms), respectively. Following chromation, three signal components were observed. Across samples, mean signal fractions were 10 ± 2, 54 ± 12, and 36 ± 11% for components with short (T1 = 39 ± 5 ms, T2 = 8 ± 2 ms), intermediate (T1 = 125 ± 8 ms, T2 = 25 ± 1 ms), and long relaxation times (T1 = 205 ± 17 ms, T2 = 68 ± 14 ms), respectively.
Fig. 4.
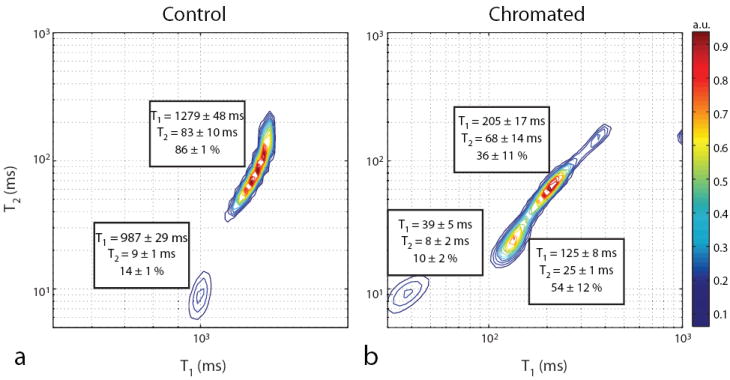
Sample normalized T1–T2 spectrum for control (a) and chromated (b) optic nerves along with the component relaxation times and signal fractions averaged across samples. Spurious components were ignored in the pool fraction calculation.
NMR of Sciatic Nerve
T1–T2 spectra from control and chromated frog sciatic nerve are given in Fig. 5. For control samples, three signal components were observed that were similar in relaxation times and signal fractions to previously published measurements (9). Three corresponding signal components were observed in chromated sciatic nerve. For each of these components, the increase in relaxation rate (R1,2 = 1/T1,2) following chromation is expected to scale linearly with the local concentration of paramagnetic chromium. Thus, the change in compartmental relaxation rates for chromated relative to control nerve (ΔR1,2) was tabulated from the relaxation times given in Fig. 5, the results of which are given in Table 1. It can be seen that the components with short and intermediate relaxation times show a significantly larger ΔR1 following chromation compared to the component with long relaxation times.
Fig. 5.
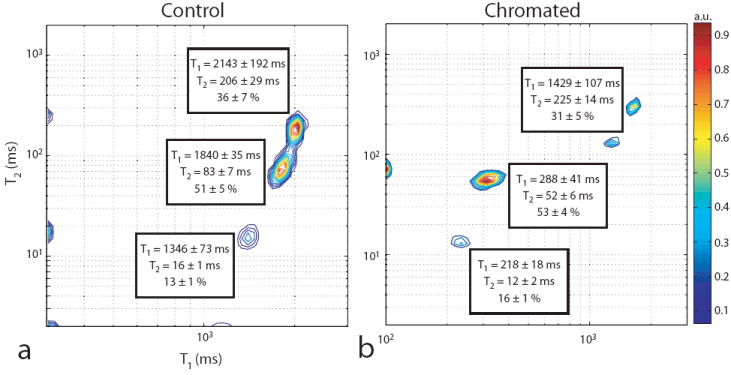
Sample normalized T1–T2 spectrum for control (a) and chromated (b) sciatic nerves along with the component relaxation times and signal fractions averaged across samples. Spurious components were ignored in the pool fraction calculation. Note, both peaks with the longest relaxation times in (b) were assigned to the same component. For display purposes, a peak arising from buffer was removed.
Table 1.
Change in component relaxation rates (ΔR1,2) for chromated relative to control peripheral nerve. Shown are the results for components with short, intermediate, and long relaxation times given in Fig. 5.
| Short | Intermediate | Long | |
|---|---|---|---|
| ΔR1 (s-1) | 3.9 ± 0.3 | 3.0 ± 0.5 | 0.2 ± 0.1 |
| ΔR2 (s-1) | 22.1 ± 17.1 | 7.1 ± 3.3 | -0.4 ± 1.0 |
μXRF
Maps of P and Cr areal density in normal and chromated sciatic nerve are shown in Fig. 6. Note the abundance of P in myelin, which was exploited to segment these maps into myelin, intra-, and extra-axonal compartments. In agreement with our T1–T2 data, Cr levels were higher in the myelin and extraaxonal (in one of the samples) compartments relative to the intra-axonal compartment in chromated sciatic nerve. From these maps, mean (± SD) compartmental Cr areal densities were tabulated for all samples, the results of which are given in Table 2. Though the absolute Cr levels were different for the chromated sciatic nerve samples, relative Cr levels in the myelin compartment were consistently ≈5-fold higher than in the intra-axonal compartment. Intersample differences in relative Cr levels in the extra-axonal space do not agree with our NMR findings. Perhaps these reflect differences in Cr washout during the histological processing of these samples.
Fig. 6.
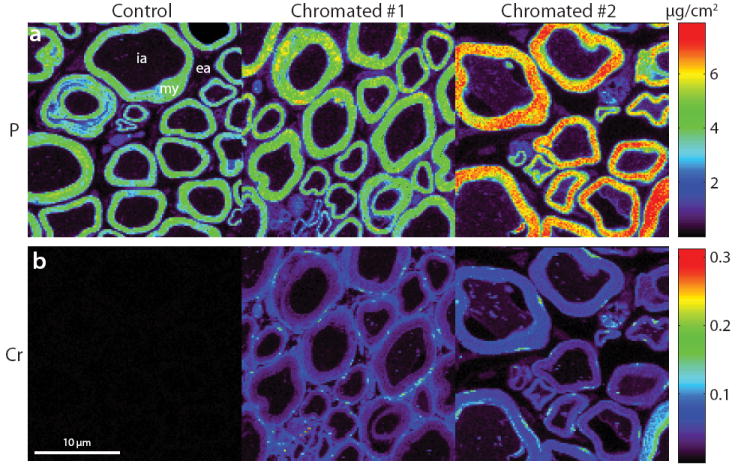
μXRF data from one control and two chromated frog sciatic nerve samples. Shown are maps of P (a) and Cr (b). In the P maps, note the abundance of P in myelin, which was exploited to manually segment these images into myelin (my), intra-axonal (ia), and extra-axonal (ea) compartments. In the Cr maps, note the high concentration of Cr in myelin (and the extra-axonal space in chromated #1) relative to the intra-axonal space in the chromated samples and the lack of Cr in the control sample.
Table 2.
Mean (± SD) Cr compartmental density (μg/cm2) for sciatic nerve obtained for the μXRF maps in Fig. 6.
| Myelin | Extra-axonal | Intra-axonal | |
|---|---|---|---|
| Control | ≪ 0.01 | ≪ 0.01 | ≪ 0.01 |
| Chromated #1 | 0.04 ± 0.01 | 0.05 ± 0.03 | 0.01 ± 0.01 |
| Chromated #2 | 0.06 ± 0.02 | 0.01 ± 0.02 | 0.01 ± 0.01 |
Given the limited resolution, segmentation of optic nerve into compartments was not possible. As a result, maps of P and Cr were overlaid to demonstrate that compartmental distribution of Cr in optic nerve. As demonstrated in Fig. 7, Cr is heterogeneously distributed across the nerve. Qualitatively, it appears that Cr is found in higher concentration in the extra-axonal relative to the intra-axonal space, though additional quantitative data are needed to substantiate this claim.
Fig. 7.
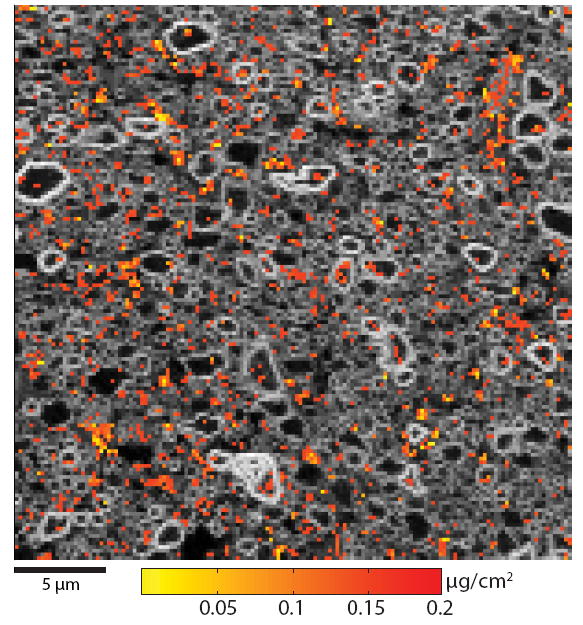
μXRF data from chromated rat optic nerve sample. Maps of P (gray) and Cr (color, windowed from 0.05-0.2 μg/cm2 for display purposes) are overlaid to demonstrate the heterogeneous distribution of Cr in chromated optic nerve.
DISCUSSION
Previous work (16) has shown that ICV administration of potassium dichromate in vivo results in relaxation changes in white matter. This enhancement is thought to arise due to reduction of diamagnetic Cr(VI) to paramagnetic chromium species [Cr(V) and/or Cr(III)] by oxidizable lipids in myelin. The purpose of the studies herein was to better understand the microanatomical basis of these relaxation changes by using multiexponential relaxation analysis, which is known to reflect the microanatomical compartition of water in nerve and white matter. In order to achieve the necessary SNR for such analysis, these studies were performed ex vivo.
In peripheral nerve, previous studies (as well as the current one) have resolved three distinct components in T1–T2 water relaxation spectra (4,8,9). A sizeable body of literature has related the short relaxation time component to myelin water (1,3-5); and two recent studies (6,7) have related the intermediate and long relaxation time components to extra- and intra-axonal water, respectively. From Fig. 5 and Table 1, it is apparent that the component with the longest relaxation times, which is thought to represent intra-axonal water, is relatively unaffected by chromation. In comparison, the other components, which are thought to reflect myelin and extra-axonal water in order of increasing relaxation times, are shifted to a greater extent. One possible explanation for this is that diamagnetic Cr(VI), which has been shown to readily cross cell membranes (20,34), is distributed throughout all nerve compartments, but is not reduced (i.e., “turned on”) within intra-axonal spaces due to a lack of available reductants. This, however, does not agree with the μXRF findings presented in Fig. 6. Another possibility is that Cr(VI) does not gain access to the intra-axonal space to the same degree as the other spaces because of the presence of the myelin sheath, which possesses a high content of polyunsaturated fatty acids susceptible to oxidation. A plausible interpretation is that Cr(VI) ions cannot penetrate through the entire thickness of the myelin sheath without being reduced. Reduced paramagnetic chromium ions are then prevented from entering the intra-axonal space because: (i) they do not readily cross cell membranes (20,34) and/or (ii) they remain bound or complexed to oxidized myelin lipids.
With this interpretation in peripheral nerve, the observations of relaxation changes in chromated white matter and optic nerve follow similarly. It is postulated that the myelin sheath reduces intra-axonal access of paramagnetic chromium, resulting in smaller contrast-enhancement of intra- relative to extra-axonal water and the ability to resolve each component. Therefore, in Fig. 2d and Fig. 4b, the spectral component with the longest relaxation times is believed to be intra-axonal water, and (similar to peripheral nerve) the two components with shorter relaxation times are believed to be myelin and extra-axonal water. This interpretation is summarized using the model shown in Fig. 8.
Fig. 8.
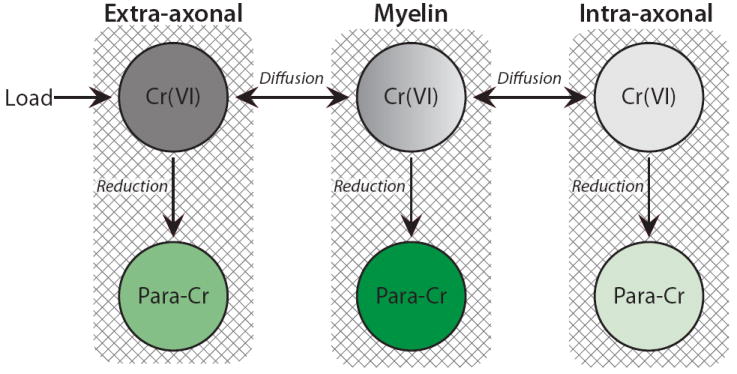
Model of the observed enhancement pattern in chromated myelinated tissue. Cr(VI) is loaded into the extra-axonal compartment and gains access to the other compartments via diffusion. The myelin sheath acts as a barrier for Cr(VI) diffusion into the axoplasm because Cr(VI) is reduced by myelin lipids as it traverses the myelin sheath. Therefore, though each individual compartment likely contains reductants, which “turn on” enhancement by reducing diamagnetic Cr(VI) to paramagnetic chromium species (Para-Cr), intra-axonal water enhancement is limited by its access to Cr(VI). In this model, the shading for each Cr(VI) sub-compartment represents its relative access to Cr(VI) (darker shading representing greater access); while the shading for each Para-Cr sub-compartment represents its relative enhancement (darker green representing larger enhancement).
Note that, unlike peripheral nerve, white matter and optic nerve intra-axonal relaxation times were significantly reduced in chromated tissue relative to normal tissue (T1 > 1 s). This indicates that in these tissues: i) some paramagnetic chromium does reach the intra-axonal space and/or ii) water exchange between the myelin and intra-axonal compartments is sufficient to alter the apparent relaxation time in the intra-axonal space. Both of these scenarios are reasonable given the thinner myelin sheath thickness in white matter and optic nerve [0.1–0.6 μm (35)] compared to peripheral nerve [0.2–2.0 μm (36)]. However, based upon our μXRF data in optic and sciatic nerve (Figs. 5 and 6), which showed higher relative Cr levels in the intra-axonal space of optic nerve than in sciatic nerve, the former of these claims seems more likely.
In chromated grey matter (Figs. 3b and 3d), a large fraction of the signal (88 ± 8 % in cortical ROIs and 73 ± 15 % in sub-cortical ROIs) was substantially reduced in T1 and T2, while the remaining signal was affected to a lesser degree. Assuming exchange is fast (on the T2 timescale) between compartments that are not partitioned by the myelin sheath, the most reasonable explanation for these multiple relaxation components is the presence of myelinated axons within the grey matter ROIs used. Thus, using the same reasoning as in white matter, the components affected to a lesser degree (i.e., with the longest relaxation times) in grey matter are thought to represent water within myelinated axons. Supporting this presumption, pool fractions for these components were of similar magnitude to electron microscopy derived estimates of water content within myelinated axons in primate visual cortex (37). Note, the reason that two longer relaxation time components were found in chromated sub-cortical grey matter (Fig. 3d) is unclear. Furthermore, some of the so-called intra-axonal component observed in chromated grey matter (as well as the myelin component in Gd-enhanced grey matter) may result from partial-volume averaging with white matter, especially considering the relatively large grey matter ROIs used (Fig 1b).
Gd-enhancement of fixed white matter resulted in a noticeably different T1–T2 spectrum compared to chromated white matter. In these samples, signal was found to be biexponential in T2, which is consistent with many studies of normal white matter that have identified a short-T2 component arising from myelin water (10-12). Previous studies have shown that Gd-chelates may be capable of crossing cell membranes in fixed tissue (38). This is supported herein by the fact that similar relaxation spectra — in terms of the number and relative contribution of components — were found in Gd-enhanced white matter as has been reported in normal white matter (10-12). Thus, it is presumed that the compartmental distribution of Gd-DTPA is driven by passive diffusion in fixed white matter, resulting in the non-specific enhancement observed.
In Gd-enhanced grey matter, similar results were obtained to those found in white matter, with a smaller contribution from the short-T2 component representing myelin water. This is in conflict with previous measurements (8) in normal grey matter that have reported monoexponential decay. These differences may be due to SNR limitations of the previous study (≈ 5× lower than the present study) coupled to the small size one would expect for this component (i.e., the fractional volume of myelinated axons is relatively small in grey matter).
The short-T1 component in the Gd-enhanced rat brain T1–T2 spectra (Figs. 2c, 3a, and 3c) is thought to arise from MT effects (32). Simply put, the relatively low power inversion pulse used is thought to invert the free water pool, while having minimal effect on the semi-solid proton pool. Exchange of magnetization between these pools then results in a biexponential recovery of the free water longitudinal magnetization. Additional studies (data not shown), showed a suppression of this component when a high power inversion pulse was used, supporting this interpretation. Although the magnitude of this component is thought to correlate to myelin content, the microanatomical origin of this component and its relationship to the myelin water fraction remains unclear. In chromated tissue, no such short-T1 component was observed, possibly because it was simply too short or too close to other spectral components to be resolved.
It should be noted that the results herein were substantially different than previously reported results in vivo (16). Watanabe et al. noted significant contrast-enhancement in white matter and only mild enhancement in grey matter in vivo after a low-dosage ICV injection of potassium dichromate. This was thought to arise because white matter has a substantially higher lipid content than does grey matter and myelin lipids possess a higher reactivity toward Cr(VI) than do grey matter reductants. In the current study, however, a larger mean contrast-enhancement was found in grey matter than in white matter (as evidenced by comparing T1 values from Figs. 2 and 3). One possible explanation for this is myelin lipid oxidation was saturated at the high concentration of potassium dichromate used herein, and Cr(VI) was reduced by the next available reductant in grey matter. Also, lipids oxidize rapidly following death, thus the distribution of available reductants, giving time for potassium dichromate to diffuse into the brain, is likely different ex vivo compared to in vivo.
Another important issue to consider in excised chromated tissue is the extent to which tissue integrity is preserved. The results shown in Figs. 6 and 7 along with light microscopy data from adjacent sections (data not shown) suggest that this integrity was preserved in optic and sciatic nerve. Similar analysis of the chromated cerebral white matter in this study, however, suggest a loss of tissue integrity during the much longer chromation and washing period used in brain. Though potassium dichromate has some value as a fixative, it is seldom used alone (39). Unfortunately, attempts to incorporate aldehyde fixatives before, during, and after chromation resulted in a non-specific enhancement pattern. This can most likely be attributed to: i) increased membrane permeability following fixation (as observed in formalin fixed Gd-enhanced tissue) and ii) reduction of Cr(VI) by the aldehydes before reaching the targeted reductants in tissue.
The ability to isolate signal from intra- and extra-axonal water in chromated myelinated tissue may be a powerful tool for studying, amongst other things, the compartmental origin of diffusion and MT in white matter and optic nerve. Furthermore, chromation may provide a means for performing MR microscopy by allowing compartmental signals to be filtered based upon differences in T1 (9), T2 , or both (40). As proof of concept, intra-axonal signal from IR-ME data was selected based upon T2, the results of which are given in Fig. 9. At TE = 71.5 ms, signal from myelin and extra-axonal water has nearly decayed to baseline, leaving only signal from intra-axonal water. Therefore, the magnitude of this image is thought to correlate with the percentage of water within myelinated axons for each voxel, supported by the high signal intensity found in both the corpus callosum and internal capsule.
Fig. 9.
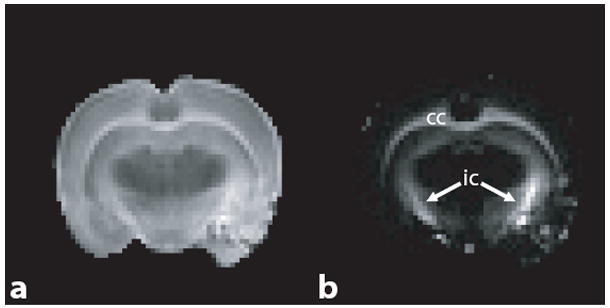
Normalized images from chromated brain at TE = 6.5 ms (a) and 71.5 ms (b). In (b), the signal from both myelin and extra-axonal water has nearly decayed to baseline, while residual signal from intra-axonal water remains. Note, that substantial signal remains within the corpus callosum (cc) and internal capsule (ic).
CONCLUSIONS
Using T1–T2 measurements, signal from intra- and extra-axonal water was resolved in chromated white matter and optic nerve. This increased anatomical resolution is thought to arise because myelin acts as a barrier for intra-axonal access to paramagnetic chromium, resulting in its smaller relative contrast-enhancement. T1–T2 measurements in frog sciatic nerve, a well-characterized three-component system, along with quantitative elemental analysis via μXRF support this postulation.
Acknowledgments
The authors would like to thank Dr. Holly Valentine for her useful consultation regarding lipid oxidation.
Grant sponsor: NIH, grant number: EB001744; NSF, CAREER award (MDD): 0448915
References
- 1.Vasilescu V, Katona E, Simplaceanu V, Demco D. Water compartments in myelinated nerve. 3. Pulsed NMR results. Experientia. 1978;34(11):1443–1444. doi: 10.1007/BF01932339. [DOI] [PubMed] [Google Scholar]
- 2.Does MD, Snyder RE. T2 relaxation of peripheral nerve measured in-vivo. Magn Reson Imaging. 1995;13(4):575–580. doi: 10.1016/0730-725x(94)00138-s. [DOI] [PubMed] [Google Scholar]
- 3.Does M, Snyder R. Multiexponential T2 relaxation in degenerating peripheral nerve. Magn Reson Med. 1996;35(2):207–213. doi: 10.1002/mrm.1910350212. [DOI] [PubMed] [Google Scholar]
- 4.Does MD, Beaulieu C, Allen PS, Snyder RE. Multi-component T1 relaxation and magnetisation transfer in peripheral nerve. Magn Reson Imaging. 1998;16(9):1033–1041. doi: 10.1016/s0730-725x(98)00139-8. [DOI] [PubMed] [Google Scholar]
- 5.Beaulieu C, Fenrich FR, Allen PS. Multicomponent water proton transverse relaxation and T2-discriminated water diffusion in myelinated and nonmyelinated nerve. Magn Reson Imaging. 1998;16(10):1201–1210. doi: 10.1016/s0730-725x(98)00151-9. [DOI] [PubMed] [Google Scholar]
- 6.Peled S, Cory DG, Raymond SA, Kirschner DA, Jolesz FA. Water diffusion, T2, and compartmentation in frog sciatic nerve. Magn Reson Med. 1999;42(5):911–918. doi: 10.1002/(sici)1522-2594(199911)42:5<911::aid-mrm11>3.0.co;2-j. [DOI] [PMC free article] [PubMed] [Google Scholar]
- 7.Wachowicz K, Snyder RE. Assignment of the T2 components of amphibian peripheral nerve to their microanatomical compartments. Magn Reson Med. 2002;47(2):239–245. doi: 10.1002/mrm.10053. [DOI] [PubMed] [Google Scholar]
- 8.Does MD, Gore JC. Compartmental study of T1 and T2 in rat brain and trigeminal nerve in vivo. Magn Reson Med. 2002;47(2):274–283. doi: 10.1002/mrm.10060. [DOI] [PubMed] [Google Scholar]
- 9.Travis AR, Does MD. Selective excitation of myelin water using inversion-recovery-based preparations. Magn Reson Med. 2005;54(3):743–747. doi: 10.1002/mrm.20606. [DOI] [PubMed] [Google Scholar]
- 10.Stewart WA, Mackay AL, Whittall KP, Moore GRW, Paty DW. Spin-spin relaxation in experimental allergic encephalomyelitis: Analysis of CPMG data using a nonlinear least-squares method and linear inverse-theory. Magn Reson Med. 1993;29(6):767–775. doi: 10.1002/mrm.1910290608. [DOI] [PubMed] [Google Scholar]
- 11.Mackay A, Whittal K, Adler J, Li D, Paty D, Graeb D. In-vivo visualization of myelin water in brain by magnetic resonance. Magn Reson Med. 1994;31(6):673–677. doi: 10.1002/mrm.1910310614. [DOI] [PubMed] [Google Scholar]
- 12.Harrison R, Bronskill MJ, Henkelman RM. Magnetization-transfer and T2 relaxation components in tissue. Magn Reson Med. 1995;33(4):490–496. doi: 10.1002/mrm.1910330406. [DOI] [PubMed] [Google Scholar]
- 13.Stanisz GJ, Henkelman RM. Diffusional anisotropy of T2 components in bovine optic nerve. Magn Reson Med. 1998;40(3):405–410. doi: 10.1002/mrm.1910400310. [DOI] [PubMed] [Google Scholar]
- 14.Stanisz G, Kecojevic A, Bronskill M, Henkelman R. Characterizing white matter with magnetization transfer and T2. Magn Reson Med. 1999;42(6):1128–1136. doi: 10.1002/(sici)1522-2594(199912)42:6<1128::aid-mrm18>3.0.co;2-9. [DOI] [PubMed] [Google Scholar]
- 15.Johnson GA, Ali-Sharief A, Badea A, Brandenburg J, Cofer G, Fubara B, Gewalt S, Hedlund LW, Upchurch L. High-throughput morphologic phenotyping of the mouse brain with magnetic resonance histology. Neuroimage. 2007;37(1):82–89. doi: 10.1016/j.neuroimage.2007.05.013. [DOI] [PMC free article] [PubMed] [Google Scholar]
- 16.Watanabe T, Tammer R, Boretius S, Frahm J, Michaelis T. Chromium(VI) as a novel MRI contrast agent for cerebral white matter: Preliminary results in mouse brain in vivo. Magn Reson Med. 2006;56(1):1–6. doi: 10.1002/mrm.20930. [DOI] [PubMed] [Google Scholar]
- 17.Liu KJ, Shi X. In vivo reduction of chromium (VI) and its related free radical generation. Mol Cell Biochem. 2001;222(1-2):41–47. [PubMed] [Google Scholar]
- 18.Peemoeller H, Pintar MM. Two-dimensional time-evolution approach for resolving a composite free-induction decay. J Magn Reson. 1980;41(2):358–360. [Google Scholar]
- 19.English AE, Whittall KP, Joy ML, Henkelman RM. Quantitative two-dimensional time correlation relaxometry. Magn Reson Med. 1991;22(2):425–434. doi: 10.1002/mrm.1910220250. [DOI] [PubMed] [Google Scholar]
- 20.Ding M, Shi XL. Molecular mechanisms of Cr(VI)-induced carcinogenesis. Mol Cell Biochem. 2002;234(1):293–300. [PubMed] [Google Scholar]
- 21.Silver MS, Joseph RI, Chen CN, Sank VJ, Hoult DI. Selective population inversion in NMR. Nature. 1984;310(5979):681–683. doi: 10.1038/310681a0. [DOI] [PubMed] [Google Scholar]
- 22.Levitt MH, Freeman R. Compensation for pulse imperfections in NMR spin-echo experiments. J Magn Reson. 1981;43(1):65–80. [Google Scholar]
- 23.Poon CS, Henkelman RM. Practical T2 quantitation for clinical applications. J Magn Reson Imaging. 1992;2(5):541–553. doi: 10.1002/jmri.1880020512. [DOI] [PubMed] [Google Scholar]
- 24.Cai Z, Lai B, Yun W, Ilinski P, Legnini D, Maser J, Rodrigues W. A hard X-ray scanning mircoprobe for fluorescence imaging and microdiffraction at the advanced photon source. Am Inst Physics Conf Proc. 2000;507:472–477. [Google Scholar]
- 25.Yun W, Lai B, Cai Z, Maser J, Legnini D, Gluskin E, Chen Z, Krasnoperova AA, Vladimirsky Y, Cerrina F, Fabrizio ED, Gentili M. Nanometer focusing of hard x rays by phase zone plates. Rev Sci Instrum. 1999;70(5):2238–2241. [Google Scholar]
- 26.Bonny JM, Renou JP, Zanca M. Optimal measurement of magnitude and phase from MR data. J Magn Reson. 1996;113(2):136–144. doi: 10.1006/jmrb.1996.0166. [DOI] [PubMed] [Google Scholar]
- 27.Lawson CL, Hanson RJ. Solving least squares problems. Englewood Cliffs, NJ: Prentice-Hall; 1974. [Google Scholar]
- 28.Whittall KP, Mackay AL. Quantitative Interpretation of NMR Relaxation Data. J Magn Reson. 1989;84(1):134–152. [Google Scholar]
- 29.Venkataramanan L, Yi-Qiao S, Hurlimann MD. Solving Fredholm integrals of the first kind with tensor product structure in 2 and 2.5 dimensions. Signal Processing, IEEE Transactions. 2002;50(5):1017. [Google Scholar]
- 30.Vogt S. MAPS : A set of software tools for analysis and visualization of 3D X-ray fluorescence data sets. J Phys IV France. 2003;104:635–638. [Google Scholar]
- 31.Menon RS, Rusinko MS, Allen PS. Proton relaxation studies of water compartmentalization in a model neurological system. Magn Reson Med. 1992;28(2):264–274. doi: 10.1002/mrm.1910280208. [DOI] [PubMed] [Google Scholar]
- 32.Gochberg DF, Gore JC. Quantitative magnetization transfer imaging via selective inversion recovery with short repetition times. Magn Reson Med. 2007;57(2):437–441. doi: 10.1002/mrm.21143. [DOI] [PMC free article] [PubMed] [Google Scholar]
- 33.Bonilla I, Snyder RE. Transverse relaxation in rat optic nerve. NMR Biomed. 2007;20(2):113–120. doi: 10.1002/nbm.1090. [DOI] [PubMed] [Google Scholar]
- 34.Travacio M, Polo JM, Llesuy S. Chromium(VI) induces oxidative stress in the mouse brain. Toxicology. 2000;150(1-3):137–146. doi: 10.1016/s0300-483x(00)00254-7. [DOI] [PubMed] [Google Scholar]
- 35.Williams RW, Chalupa LM. An analysis of axon caliber within the optic nerve of the cat: evidence of size groupings and regional organization. J Neurosci. 1983;3(8):1554–1564. doi: 10.1523/JNEUROSCI.03-08-01554.1983. [DOI] [PMC free article] [PubMed] [Google Scholar]
- 36.Friede RL, Beuche W. A new approach toward analyzing peripheral nerve fiber populations. I. Variance in sheath thickness corresponds to different geometric proportions of the internodes. J Neuropathol Exp Neurol. 1985;44(1):60–72. doi: 10.1097/00005072-198501000-00005. [DOI] [PubMed] [Google Scholar]
- 37.Peters A, Sethares C. Myelinated axons and the pyramidal cell modules in monkey primary visual cortex. J Comp Neurol. 1996;365(2):232–255. doi: 10.1002/(SICI)1096-9861(19960205)365:2<232::AID-CNE3>3.0.CO;2-6. [DOI] [PubMed] [Google Scholar]
- 38.Purea A, Webb AG. Reversible and irreversible effects of chemical fixation on the NMR properties of single cells. Magn Reson Med. 2006;56(4):927–931. doi: 10.1002/mrm.21018. [DOI] [PubMed] [Google Scholar]
- 39.Kiernan JA. Histological and histochemical methods: Theory and practice. New York: Pergamon Press; 1981. [Google Scholar]
- 40.Does MD. Relaxation-selective magnetization preparation based on T1 and T2. Magn Reson Imaging. 2005;172(2):306–311. doi: 10.1016/j.jmr.2004.11.008. [DOI] [PubMed] [Google Scholar]


