Abstract
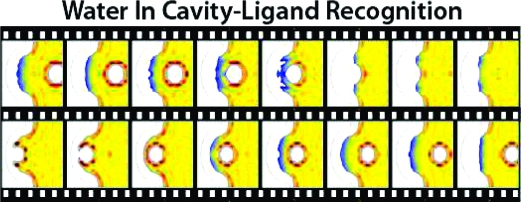
We use explicit solvent molecular dynamics simulations to estimate free energy, enthalpy, and entropy changes along the cavity−ligand association coordinate for a set of seven model systems with varying physicochemical properties. Owing to the simplicity of the considered systems we can directly investigate the role of water thermodynamics in molecular recognition. A broad range of thermodynamic signatures is found in which water (rather than cavity or ligand) enthalpic or entropic contributions appear to drive cavity−ligand binding or rejection. The unprecedented, nanoscale picture of hydration thermodynamics can help the interpretation and design of protein−ligand binding experiments. Our study opens appealing perspectives to tackle the challenge of solvent entropy estimation in complex systems and for improving molecular simulation models.
Introduction
Water typically participates in molecular recognition and association. Despite the importance of water in chemistry, biology, and nanosciences in general, our current understanding of its thermodynamic role in promoting or hampering the binding of a ligand to a receptor is still surprisingly limited.
Hydration and dewetting in model systems have been successfully investigated over varying length scales based on theory(1) and simulation,2,3 shedding transferable knowledge on the forces involved in water nonpolar confinment,4,5 including the influence of biomolecular geometry and topography.6,7 The study of model hydrophobic cavities was recently extended to hydrophobic ligand binding,8,9 encountered in biological recognition and drug design.10,11
Experiments and molecular dynamics (MD) simulations have demonstrated the general, dynamic nature of protein hydration.12−15 Water can be absent(16) or, at least transiently, present(17) in nonpolar protein cavities or exchange between the bulk solvent and polar, hydrated cavities.(18) Favorable free energy changes were calculated for tying up single, localized water molecules in the binding pockets of protein complexes.19,20 Alternative hydration scenarios all imply favorable free energy changes upon transferring water from the bulk to a hydration site or confined volume. Therefore, characterizing free energies is not sufficient to disentangle the determinants of different hydration behaviors. Substantially more fundamental, transferable information could be gained through the underlying compensating enthalpy−entropy terms (i.e., the thermodynamic signature).
Dunitz suggested that small, unfavorable entropic changes would accompany water binding to protein crystals by comparing standard entropies of anhydrous and dehydrated salts with that of bulk water.(21) Vaitheeswaran et al. proposed that the configurational entropy of water clusters decreases when occupying spherical hydrophobic cavities,(2) a similar conclusion to that obtained by Yin et al. for a nonpolar cavity in the tetrabraichion protein.(22) On the other hand, based on nuclear-magnetic-resonance data and a model for librational dynamics, Denisov et al. suggested favorable entropy changes for disordered water permeating various protein cavities.(23) Taken as a whole, these studies demonstrate that water thermodynamics is strictly dependent on the specific physicochemical properties of the confining environment. However, how such properties modulate cavity−ligand binding has not yet been addressed in this context. Is water a passive player, only embedding cavity−ligand recognition, or a driving player? Answering this question essentially requires quantifying, in addition to water occupancy and dynamics, the underlying thermodynamic signatures.
Interpreting the molecular basis of measured free energy, enthalpy, and entropy changes upon protein−ligand binding is a difficult task, due to the tight coupling between solvent and solute contributions.24,25 Yet, new experiments indeed provide strong evidence of the role of water in driving cavity−ligand binding.26,27 From a computational standpoint, the major obstacle to estimate compensating enthalpy and entropy contributions is finite sampling, thus far confining entropy calculations either to partial single-molecule ligand28,29 or receptor(30) degrees of freedom, or to systems of reduced size.31,32 In the latter case, thermodynamic signatures can be obtained using potential of mean force (PMF) calculations, e.g. for methane−methane association in water, with the appealing advantage of characterizing not only two-state, thermodynamic differences but also the profile along the association coordinate,33−35 revealing free energy, enthalpy, and entropy barriers directly related with solvent reorganization at the atomic level. Despite these important advances, water enthalpy−entropy compensation regulating molecular recognition and association remains largely unexplored, mainly due to water dynamic correlation and the nonadditive character of its thermodynamic effects (e.g., see refs (13, 35, 36)). In particular, to our knowledge PMF approaches have not yet been applied to derive thermodynamic signatures of cavity−ligand binding.
In this study, we derive complete thermodynamic signature profiles of cavity−ligand recognition using a straightforward approach based on PMF calculations and the temperature dependence of the free energy.(37) On one hand, we use the simplest possible model systems to generalize cavity−ligand association, i.e. explicitly solvated hemispherical cavities binding spherical ligands (Figure 1). On the other hand, by employing cumulative microsecond sampling, free energy, enthalpy, and entropy can be estimated including a sizable water component, thus explicitly accounting for water−water and water−solute coupling and correlating these effects with water density distribution. By cross-comparing seven systems with varying cavity and ligand physicochemical properties, our study reveals an unprecedented picture of hydration thermodynamics, opening appealing perspectives for estimating solvent entropy in complex systems and improving state-of-the-art models for molecular simulation.
Figure 1.
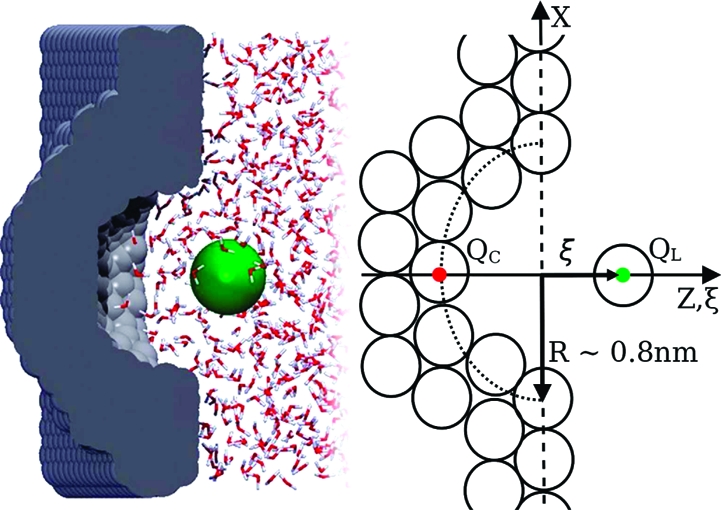
Snapshot and schematic representation of the explicitly solvated hemispherical cavities and spherical ligands used in this study. The seven systems only differ for the charges on cavity, QC, and ligand, QL. Note that (ξ = 0) corresponds to wall surface.
Methods
Molecular Model, MD Simulations, and Analysis
A detailed description of the molecular models, system preparation, and simulation setup was reported for the (N,N) system.(37) The six new cavity−ligand systems employed in this work only differ for the QC and QL unit charges attributed to one cavity particle and/or the ligand particle, as schematically drawn in Figure 1.
All systems considered contain 1030 water molecules and only differ by one charge at a time (no other interaction parameter is changed). The TIP4P water model(38) employed proved good agreement with the experimental phase diagram of water.39,40 MD simulations were performed using the CHARMM software.(41) Water density distribution maps were generated using the xfarbe software.(42)
Estimating Free Energy, Entropy, and Enthalpy Changes
Free energy changes along ξ were estimated from the potential of mean force
where kB is the Boltzmann constant, T the absolute temperature, and P(ξ) the probability of finding the ligand particle at ξ,
which can be obtained from the ligand configurational space, 𝒫(r). In this study, the umbrella sampling procedure(43) allowed effective sampling of 𝒫(r) along ξ. PMF profiles were obtained by the Weighted Histogram Analysis Method.(44) In the (NpT) ensemble, the Gibbs free energy for moving the ligand from ξ = ∞ to a given ξ value reads
Using standard expressions, the corresponding entropy can be estimated numerically through the temperature dependence of the free energy,
The corresponding enthalpy was determined as
Computational details were previously described,(37) together with the definition of decomposed interaction energies and a procedure to determine the statistical uncertainties on G, H, and − TS profiles along ξ (error bars in Figures 2−5).
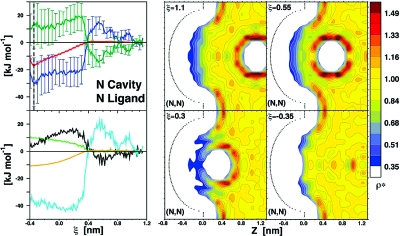
Figure 2.
Thermodynamic signature profile and water density maps along the binding coordinate ξ for a nonpolar ligand binding a nonpolar cavity (N,N). Left, top panel: Gibbs free energy, G (red), enthalpy, H (blue), and entropic term, −TS (green) are shown with their uncertainties (vertical bars). Left, bottom panel: water contribution to relative Gibbs free energy, GW (orange) and decomposed energies for ligand-water, ULW (green), cavity-water, UCW (black), and water−water, UWW (cyan) interactions. Water density (ρ*) distribution maps are shown for key snapshots along ξ using a color coding normalized with respect to bulk water, for which ρ* = 1. See Movie S1 for the corresponding dynamic hydration video.
Results
Thermodynamic Signatures of Cavity−Ligand Binding
A binding scenario, i.e. a favorable change in system free energy reached at a certain equilibrium binding distance, ξeq, was observed in five out of the seven investigated systems.
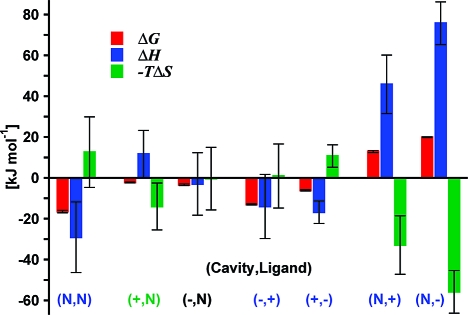
Figure 2 summarizes the results for the binding between a nonpolar cavity (N) and a nonpolar ligand (N), referred to in the following as the (N,N) system. As the ligand moves toward the cavity, the system relative Gibbs free energy, G, monotonically decreases from ξ ≈ 0.4 nm to ξeq = −0.345 nm. The corresponding changes in system enthalpy, H, and entropic term, −TS, are also displayed and show at first an increase of H (or decrease of −TS) until 0.55 nm, followed by a rapid exchange of favorable/unfavorable compensating components at ∼0.4 nm. As suggested by the water density distribution maps, this rapid exchange results from the sudden cavity dehydration induced by the approaching ligand. The corresponding large favorable enthalpy change is the dominant contribution to the overall binding thermodynamics: the favorable ΔG of −16.5 kJ mol−1 is dominated by enthalpy, ΔH = −29.1 kJ mol−1, with a counterbalancing −TΔS = 12.6 kJ mol−1 (Table 1).
Table 1. Two-State Thermodynamic Changes upon Cavity−Ligand Bindinga.
| C,L | ξeq | ΔG | ΔH | − TΔS | ΔGW | ΔUCL | ΔULW | ΔUCW | ΔUWW |
|---|---|---|---|---|---|---|---|---|---|
| N,N | −0.345 | −16.5 | −29.1 | 12.6 | −10.5 | −6 (0) | 10(0) | 4(0) | −37 |
| +,N | −0.085 | −2.3 | 11.7 | −14.0 | −1.2 | −1 (0) | 2(0) | 0(0) | 12 |
| −,N | −0.105 | −3.4 | −3.0 | −0.4 | −1.4 | −2 (0) | 1(0) | −2 (−1) | 0 |
| −,+ | −0.135 | −13.0 | −14.0 | 0.9 | 153.0 | −166 (−164) | 117(118) | 149(146) | −114 |
| +,− | −0.035 | −6.1 | −16.8 | 10.7 | 123.9 | −130 (−128) | 80(81) | 121(119) | −88 |
| N,+ | [ −0.195] | 12.9 | 45.8 | −32.9 | 15.9 | −3 (0) | 19(15) | −28 (0) | 57 |
| N,− | [ −0.195] | 19.9 | 75.7 | −55.8 | 22.9 | −3 (0) | 34(29) | −35 (0) | 79 |
ξ values are in nm; thermodynamic data are in kJ mol−1. The electrostatic components of the interaction energies are reported in parentheses. Square brackets are used for arbitrary ξ values in the case of ligand rejection. Larger ξeq values for (+,N), (−,N), (−,+), and (+,−) are due to solvent-separated binding.
The molecular origin of such hydrophobic enthalpy-driven binding can be fully understood by characterizing the individual energy contributions arising from ligand or cavity hydration, as well as water−water interactions (Figure 2 and Table 1). Cavity dehydration that dominates binding is associated with a sizable, favorable energetic change resulting from new water−water interactions formed upon expelling water molecules from the nonpolar cavity (UWW = −37 kJ mol−1). This is the major factor determining the overall water contribution to the system free energy (GW), making water the driving player in hydrophobic cavity−ligand association(37) with a ΔGW = −10.5 kJ mol−1, compared to significantly smaller direct cavity−ligand interactions ΔULC = −6 kJ mol−1. Our data imply that water entropy is more favorable for water inside the cavity than for water molecules forming more favorable (and highly correlated) water−water interactions in the bulk, in agreement with favorable entropy changes proposed for disordered water permeating nonpolar protein cavities.17,23 However, it is the favorable enthalpy overcompensation of bulk water−water interactions that drives nonpolar cavity−ligand binding in the (N,N) system.
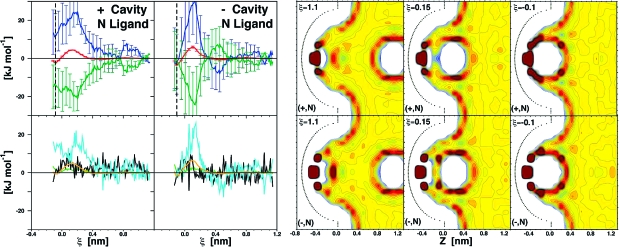
Rather different thermodynamic profiles characterize the binding of the same nonpolar ligand to cavities at the end of which either a positive or negative net charge was introduced (Figure 3, (+,N) and (−,N) systems). In both cases, G curves display characteristic barriers ((+,N) and (−,N): peaks of ∼4 and 6 kJ mol−1 at ξ = 0.135 and 0.105 nm), yet binding is overall favorable (ΔG = −2.3 and −3.4 kJ mol−1, Table 1). Interestingly, similar G curves for the two systems result from substantially different enthalpy−entropy compensation profiles. In the case of (+,N), binding is entropy driven, resulting from ΔH and −TΔS of 11.7 and −14.0 kJ mol−1. Conversely, for (−,N) the enthalpy takes over the small entropic component, being ΔH = −3.0 and −TΔS = −0.4 kJ mol−1 .
Figure 3.
Thermodynamic signature profiles and water density distribution maps along the (+,N) or (−,N) cavity−ligand binding coordinates. See Figure 2 legend for color coding as well as Movies S2 and S3 for dynamic hydration.
In contrast to the (N,N) system, due to the presence of net cavity charges, cavity hydration is preserved in both systems. Cavity water appears to be structured, and its displacement by the approaching ligand (for ξ < 0.4 nm) is entropically favorable (Figure 3). At the same time, water molecules persistently occupying the cavity bottom lose their interacting partners, and the underlying increase of UWW is the main contribution to the enthalpy-dominated G barrier. When such a barrier is crossed, further reorganization of the confined water takes place as the nonpolar ligand moves closer to the cavity wall. In both (+,N) and (−,N) cases it ends with the formation of stable single hydration shells; thus free energy minima correspond to solvent-separated — rather than direct — contact binding. The hydration shell formation is driven by enthalpy and entropically unfavorable, and the magnitude of these compensating terms depend on how different cavity charges promote water structure. Charge asymmetry in this context is discussed in the Charge Asymmetry section (Discussion).
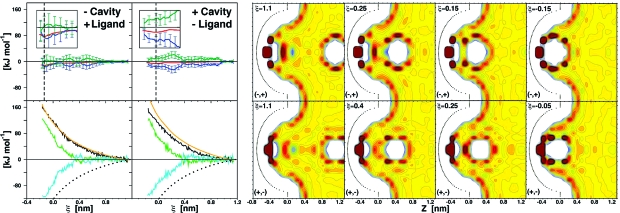
The thermodynamic determinants for charged cavities binding oppositely charged ligands were also investigated (Figure 4). Despite a strong cavity−ligand electrostatic interaction, G changes are moderate, indicating a remarkable role of water electrostatic screening. In both (−,+) and (+,−) scenarios, the favorable ΔG differences of −13.0 and −6.1 kJ mol−1 are exclusively enthalpy driven, resulting from ΔH of −14.0 and −16.8 and −TΔS of 0.9 and 10.7 kJ mol−1, respectively (Table 1). A gradual decrease of G along ξ is accompanied by fluctuating enthalpy (favorable) and entropy (unfavorable) terms (Figure 4). An oscillation period of ∼0.3 nm (i.e water molecular size) reflects the reorganization of discrete water hydration shells upon ligand binding.
Figure 4.
Thermodynamic signature profiles and water density distribution maps along the (−,+) or (+,−) cavity−ligand binding coordinates. See Figure 2 legend for color coding. In addition, the left, bottom panels report as well the change of cavity−ligand interaction energy, UCL (dotted black). See Movies S4 and S5 for dynamic hydration.
Cavity and ligand hydration is persistent throughout the binding process, as observed for (+,N) and (−,N) systems (Figures 3 and 4). GW, ULW, and UCW follow monotonically increasing profiles along ξ in both (−,+) and (+,−) systems, indicating that the unfavorable water free energy contribution largely arises from cavity−water and ligand−water interactions (Figure 4). Their changes upon binding are the largest among the seven systems considered (ΔGW = 153.0 and 123.9 kJ mol−1, ΔULW = 117 and 80 kJ mol−1, and ΔUCW = 149 and 121 kJ mol−1). Unfavorable cavity−water electrostatic interactions are overcompensated by large, direct cavity−ligand interactions (ΔUCL = −166 and −130 kJ mol−1). The second largest contribution to enthalpy-driven binding arises from creating more favorable water−water interactions (UWW = −114 and −88 kJ mol−1, respectively). The role of water in the screening of the strong cavity−ligand interactions can be explained by considering the strong dipole generated by their separated charges.
In the bulk region of both (−,+) and (+,−) systems, the overall electrostatic field is dominated by the ligand charge and orients water dipoles favorably toward the ligand, yet unfavorably for the cavity. As a result, the charged cavity interacts favorably only with the ordered water dipoles in the region between cavity and ligand. Upon cavity−ligand association this region becomes smaller, leading to a remarkable increase of UCW, which occurs as a relatively long-range effect (see Figure 4, ξ < 1.0 nm). Furthermore, as the distance between cavity and ligand charges reduces (ξ < 0.3 nm), the resulting electrostatic field gradually vanishes in the bulk; thus water molecules start to orient preferentially due to mutual hydrogen bonding rather than to the interaction with the ligand. Consistently, ULW rapidly increases mirrored by a decrease of UWW values. This interpretation is supported as well by comparison with (N,+) and (N,−) systems: in the absence of electrostatic screening significantly smaller, unfavorable ΔULW changes are observed for identical ligands (see the next section and Table 1). Charge asymmetry from our data is discussed in the Charge Asymmetry section (Discussion).
Ligand-Rejection Thermodynamics
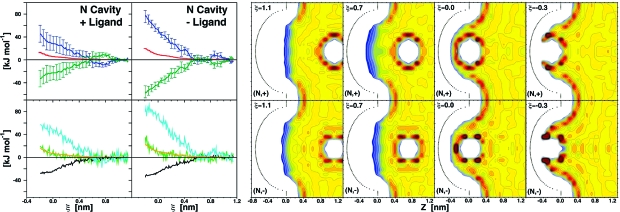
A crucial aspect of biomolecular association is its high specificity. Therefore, understanding the thermodynamic determinants is as relevant for binding as it is for rejection scenarios. Such ligand rejection is observed for (+) and (−) ligands approaching a nonpolar cavity (Figure 5). A monotonically increasing (unfavorable) profile for G in both (N,+) and (N,−) systems is accompanied by monotonically increasing H (and decreasing −TS) for ξ < 0.7 nm. Overall, binding is prevented largely because of enthalpy penalties (ΔH of 45.8 and 75.7 kJ mol−1), overcoming a large, favorable entropy compensation (−TΔS of −32.9 and −55.8 kJ mol−1).
Figure 5.
Thermodynamic signature profiles and water density distribution maps for ligand rejection along the (N,+) or (N,−) cavity−ligand coordinates. See Figure 2 legend for color coding as well as Movies S6 and S7 for dynamic hydration.
The enthalpy contribution to the unfavorable water free energy, GW, mostly arises from the loss of water−water interactions (ΔUWW values of 57 and 79 kJ mol−1). Water density distribution maps suggest that increasing UWW and progressively more favored UCW values are due to the charged ligands dragging their hydration shells deep into the nonpolar cavity. Partial ligand dehydration, evidenced by increasing ULW energies and the change of slope of G profiles, takes place at ∼0.0 nm, as the hydration shells are sterically unable to fit into the confining cavity volume. This process is substantially different compared with hydrophobic ligand dehydration in the (N,N) system (Figure 2 and Figure 5).
As expected, the removal of charged ligands from the bulk solvent is entropically favorable. Water is highly ordered around the ligands already in the bulk; thus no entropy penalty needs to be paid upon dragging the ordered hydration shells into a nonpolar cavity. Noticeable differences in enthalpy and entropy terms for a (−) vs (+) ligand support the key role of water in cavity−ligand specificity, as discussed in the Charge Asymmetry section (Discussion).
Discussion
Model Systems and Complex Biomolecular Recognition
A variety of thermodynamic scenarios and driving effects for model cavity−ligand recognition was revealed based on our simulations, as summarized in terms of the overall changes in G, H, and −TS (Figure 6). A common feature is the fundamental role of water as an active player in determining binding or rejection. Though quantitative results are system dependent, on a qualitative level more complex cases of macromolecular recognition are likely a multivariate combination of the scenarios presented herein. One can imagine that the variability of corresponding thermodynamic signatures would broaden for complex biomolecules, as a result of the multifaceted hydrophobicity of the binding partners, roughness, flexibility, and topography of the macromolecular surfaces.6,7 Experiments on two protein receptors seem qualitatively related to our model systems.
Figure 6.
Two-state thermodynamic signatures of cavity−ligand recognition. Water is clearly an active player in six out of seven cases in which ligand binding/rejection is driven either by enthalpy (blue label) or by entropy (green label). See Table 1 for corresponding values.
Sharrow et al. reported a thermodynamic analysis for six small nonpolar compounds binding the nonpolar cavity of mouse major urinary protein-I.(45) Measured thermodynamic changes closely resemble the scenario we find for the (N,N) system.(37) Musah et al. measured thermodynamic changes upon binding for an engineered heterocyclic cation-binding site.(46) This cavity, created by mutation of a hydrophobic tryptophan residue to a glycine, presents a buried, negatively charged aspartic acid residue crucial for binding and displays similar volume and hydration to those of our (−, +) model system.(18) Among the seven systems investigated, the latter is the most closely related to the experimental data of enthalpy-driven binding. However, a more extensive, direct comparison of our data with water thermodynamics in protein−ligand binding is hampered by the complexity of experimental interpretation.47−49
Charge Asymmetry
How differently do opposite charges affect water structure? How does such charge asymmetry influence molecular association? Water thermodynamics depends on solute charge asymmetry (e.g., see refs (31, 50−53)), occasionally with unexpected macroscopic consequences.(54) A quantitative interpretation of ion hydration thermodynamics is still widely debated in the current literature.(55) However, the interpretation of structure-making and structure-breaking trends is well consolidated. For this reason we use it here to explain evident charge asymmetry from our data.
We can interpret charge asymmetry considering the different dipole orientation of the first two hydration shells. Water molecules preferentially orient their oxygen atoms toward a positive charge or their hydrogen atoms (and dipoles) toward a negative charge. Small ions of high charge density are structure forming (kosmotropes), i.e. increasing the enthalpy (decreasing the entropy) of surrounding water with respect to bulk. In contrast, large monovalent ions of low charge density are structure breaking (chaotropes) with contributions of opposite sign.50,51 The (+) ligand employed in our simulations has similar parameters to those of the chaotropic Cs+ cation, the (−) ligand intermediate between Cl− and F− anions, which are moderately kosmotropic.(55)
The most evident thermodynamic effects of charge asymmetry were observed for the (N,+) vs (N,−) systems overall. As suggested by Collins et al.,(51) we notice qualitative differences within the first two hydration shells as the ligand moves from ξ = 1.1 nm toward the cavity (Figure 5). For the (+) ligand the reorganization of its second hydration shell is accompanied by an unfavorable entropy change, as expected for a chaotropic ion for which hydration is stabilized by entropy. On the contrary, for the (−) ligand such reorganization requires an unfavorable enthalpy change, as expected for a kosmotropic ion whose hydration is enthalpy stabilized. It is worth noting that, at this initial stage, enthalpy−entropy compensation is perfect; i.e., no free energy change occurs. Charge asymmetry in the (N,+) vs (N,−) systems is also evident as the final ligand dehydration takes place. Water interaction is stronger with a (−) vs (+) ligand because water hydrogen atoms can more closely approach the charge than oxygen atoms. Consistently, the (−) ligand appears to be generally better hydrated and a comparatively higher enthalpy penalty has to be paid upon its dehydration (Table 1). The corresponding favorable change in entropy is also larger for the (−) vs (+) ligand, but insufficient for enthalpy compensation, leading to an overall more positive free energy change upon dehydration. This is in line with previously reported data of ionic hydration.(52)
Comparison between (+,N) and (−,N) scenarios shows interesting asymmetry for water reorganization upon binding (Figure 3, ξ < 0.135 and 0.105 nm, respectively). In the (+,N) system the favorable decrease of UWW inverts its slope (increases from 0.1 to ξeq = −0.085 nm), while in the (+,N) system water reorganization is accompanied by the monotonic decrease of enthalpy until ξeq = −0.105 nm. Possibly, the positively charged cavity confers to the approaching nonpolar ligand properties characteristic of a chaotropic ion (i.e., a structure-breaking effect on water). Thus, cavity water reorganization requires a larger entropy penalty for (−,N) vs (+,N) association (Figure 3).
Charge asymmetry in the (−,+) and (+,−) systems is evident in the proximity of the bound states (see Figure 4, inset panels). In the (−,+) system, the G minimum at ξeq = −0.135 nm results from an H minimum and a −TS maximum corresponding to an optimal hydration shell between cavity and ligand. Conversely, in the (+,−) system this is not the case, consistently with the interpretation that the kosmotropic nature of the (−) ligand weakens near the (+) cavity charge, thus reducing the enthalpy-dominated order of the surrounding water molecules.
Conclusion
We used a straightforward computational approach and extensive sampling to derive complete thermodynamic signatures of model cavity−ligand recognition. Free energy, enthalpy, and entropy estimates were obtained along the association coordinate for a set of seven systems with varying cavity and ligand physicochemical properties. This approach gives access to coupled solute−solvent thermodynamics along the association coordinate, thus allowing investigation of the fundamental link of molecular recognition thermodynamics with cavity and ligand hydration/dewetting.
Qualitatively different cavity−ligand binding scenarios and driving effects were revealed, despite the simplicity of the model systems employed, and will help the interpretation and design of new protein−ligand binding experiments. A common feature is the — generally underestimated — key role of water as an active player in determining ligand binding or rejection. We discussed our data also in the context of the asymmetric nature of water thermodynamics for opposite charges. Remarkably, our results suggest that overall cavity−ligand recognition and binding propensity do not need to be (or are not limited to) the result of direct cavity−ligand interactions. For example, water−water interactions play a key role as well in the electrostatic binding of an oppositely charged cavity and ligand through water electrostatic screening. Due to this effect, the resulting overall free energy change is of similar magnitude for hydrophobic and electrostatic-driven binding. In more complex biomolecular association, involving multivariate combinations of the scenarios derived herein, water could determine the subtle balance among driving forces of different physical natures, thus broadening the array of available binding mechanisms.
Our approach could be generalized to tackle the challenge of solvent entropy estimation in complex biological systems and drug design, starting from host−guest systems of treatable size. Overall, this study suggests that the understanding of cavity−ligand recognition relies on an improved description of water thermodynamics and opens excellent possibilities for developing new implicit solvent and coarse-grained models toward gaining a more realistic representation of solvation properties. In particular, a novel level-set variational implicit solvent model(56) is being parametrized based on our data.
Acknowledgments
This work was supported, in part, by the National Institutes of Health, the National Science Foundation, and the Howard Hughes Medical Institute. We thank the Center for Theoretical Biological Physics (NSF Grant PHY-0822283) for the computing resources employed and Dr. Joachim Dzubiella for a critical reading of the manuscript.
Supporting Information Available
Video clips for all described systems showing changes in water density distribution as the ligands move along the reaction coordinate. This material is available free of charge via the Internet at http://pubs.acs.org.
Funding Statement
National Institutes of Health, United States
Supplementary Material
References
- Lum K.; Chandler D.; Weeks J. D. J. Phys. Chem. B 1999, 103, 4570–4577. [Google Scholar]
- Vaitheeswaran S.; Yin H.; Rasaiah J. C.; Hummer G. Proc. Natl. Acad. Sci. U.S.A. 2004, 101, 17002–17005. [DOI] [PMC free article] [PubMed] [Google Scholar]
- Wallqvist A.; Berne B. J. J. Phys. Chem. 1995, 99, 2893–2899. [Google Scholar]
- Chandler D. Nature 2005, 437, 640–647. [DOI] [PubMed] [Google Scholar]
- Rasaiah J. C.; Garde S.; Hummer G. Annu. Rev. Phys. Chem. 2008, 59, 713–740. [DOI] [PubMed] [Google Scholar]
- Liu P.; Huang X.; Zhou R.; Berne B. J. Nature 2005, 437, 159–162. [DOI] [PubMed] [Google Scholar]
- Giovambattista N.; Lopez C. F.; Rossky P. J.; Debenedetti P. G. Proc. Natl. Acad. Sci. U.S.A. 2008, 105, 2274–2279. [DOI] [PMC free article] [PubMed] [Google Scholar]
- Setny P. J. Chem. Phys. 2008, 128, 125105. [DOI] [PubMed] [Google Scholar]
- Setny P.; Wang Z.; Cheng L.-T.; Li B.; McCammon J. A.; Dzubiella J. Phys. Rev. Lett. 2009, 103, 187801. [DOI] [PMC free article] [PubMed] [Google Scholar]
- Li Z.; Lazaridis T. Phys. Chem. Chem. Phys. 2007, 9, 573–81. [DOI] [PubMed] [Google Scholar]
- Homans S. W. Drug Discovery Today 2007, 12, 534–539. [DOI] [PubMed] [Google Scholar]
- Pal S. K.; Peon J.; Bagchi B.; Zewail A. H. J. Phys. Chem. B 2002, 106, 12376–12395. [Google Scholar]
- Mittal J.; Hummer G. Proc. Natl. Acad. Sci. U.S.A. 2008, 105, 20130–20135. [DOI] [PMC free article] [PubMed] [Google Scholar]
- Fenimore P. W.; Frauenfelder H.; McMahon B. H.; Young R. D. Proc. Natl. Acad. Sci. U.S.A. 2004, 101, 14408–14413. [DOI] [PMC free article] [PubMed] [Google Scholar]
- Ebbinghaus S.; Kim S. J.; Heyden M.; Yu X.; Heugen U.; Gruebele M.; Leitner D. M.; Havenith M. Proc. Natl. Acad. Sci. U.S.A. 2007, 104, 20749–20752. [DOI] [PMC free article] [PubMed] [Google Scholar]
- Qvist J.; Davidovic M.; Hamelberg D.; Halle B. Proc. Natl. Acad. Sci. U.S.A. 2008, 105, 6296–6301. [DOI] [PMC free article] [PubMed] [Google Scholar]
- Ernst J. A.; Clubb R. T.; Zhou H. X.; Gronenborn A. M.; Clore G. M. Science 1995, 267, 1813–1817. [DOI] [PubMed] [Google Scholar]
- Baron R.; McCammon J. A. Biochemistry 2007, 46, 10629–10642. [DOI] [PubMed] [Google Scholar]
- Hamelberg D.; McCammon J. A. J. Am. Chem. Soc. 2004, 126, 7683–7689. [DOI] [PubMed] [Google Scholar]
- Michel J.; Tirado-Rives J.; Jorgensen W. L. J. Am. Chem. Soc. 2009, 131, 15403–15411. [DOI] [PMC free article] [PubMed] [Google Scholar]
- Dunitz J. D. Science 1994, 264, 670. [DOI] [PubMed] [Google Scholar]
- Yin H.; Hummer G.; Rasaiah J. C. J. Am. Chem. Soc. 2007, 129, 7369–7377. [DOI] [PubMed] [Google Scholar]
- Denisov V. P.; Venu K.; Peters J.; Horlein H. D.; Halle B. J. Phys. Chem. B 1997, 101, 9380–9389. [Google Scholar]
- Cooper A. Biophys. Chem. 2005, 115, 89–97. [DOI] [PubMed] [Google Scholar]
- Searle M. S.; Westwell M. S.; Williams D. H. J. Chem. Soc., Perkin Trans. 1995, 2, 141–151. [Google Scholar]
- Barratt E.; Bingham R. J.; Warner D. J.; Laughton C. A.; Phillips S. E. V.; Homans S. W. J. Am. Chem. Soc. 2005, 127, 11827–11834. [DOI] [PubMed] [Google Scholar]
- Leung D. H.; Bergman R. G.; Raymond K. N. J. Am. Chem. Soc. 2008, 130, 2798–2805. [DOI] [PubMed] [Google Scholar]
- Irudayam S. J.; Henchman R. H. J. Phys. Chem. B 2009, 113, 5871–5884. [DOI] [PubMed] [Google Scholar]
- Chang C. A.; Chen W.; Gilson M. K. Proc. Natl. Acad. Sci. U.S.A. 2007, 104, 1534–1539. [DOI] [PMC free article] [PubMed] [Google Scholar]
- Baron R.; McCammon J. A. Chem. Phys. Chem. 2008, 9, 983–988. [DOI] [PubMed] [Google Scholar]
- Lynden-Bell R. M.; Rasaiah J. C. J. Chem. Phys. 1997, 107, 1981–1991. [Google Scholar]
- Peter C.; Oostenbrink C.; van Dorp A.; van Gunsteren W. F. J. Chem. Phys. 2004, 120, 2652–2661. [DOI] [PubMed] [Google Scholar]
- Smith D. E.; Zhang L.; Haymet A. D. J. J. Am. Chem. Soc. 1992, 114, 5875–5876. [Google Scholar]
- Ludemann S.; Abseher R.; Schreiber H.; Steinhauser O. J. Am. Chem. Soc. 1997, 119, 4206–4213. [Google Scholar]
- Shimizu S.; Chan H. S. J. Chem. Phys. 2000, 113, 4683–4700. [Google Scholar]
- Czaplewski C.; Liwo A.; Ripoll D. R.; Scheraga H. A. J. Phys. Chem. B 2005, 109, 8108–8119. [DOI] [PubMed] [Google Scholar]
- Setny P.; Baron R.; McCammon J.. J. Chem. Theory Comput., in press. [DOI] [PMC free article] [PubMed]
- Jorgensen W. L.; Chandrasekhar J.; Madura J. D.; Impey R. W.; Klein M. L. J. Chem. Phys. 1983, 79, 926–935. [Google Scholar]
- Sanz E.; Vega C.; Abascal J. L. F.; MacDowell L. G. J. Chem. Phys. 2004, 121, 1165–1166. [DOI] [PubMed] [Google Scholar]
- Paschek D. J. Chem. Phys. 2004, 120, 6674–6690. [DOI] [PubMed] [Google Scholar]
- Brooks B. R.; Bruccoleri R. E.; Olafson B. D.; States D. J.; Swaminathan S.; Karplus M. J. Comput. Chem. 1983, 4, 187–217. [Google Scholar]
- Preusser A. ACM Trans. Math. Software 1998, 15, 79–89. [Google Scholar]
- Torrie G.; Valleau J. J. Comput. Phys. 1977, 23, 187–199. [Google Scholar]
- Kumar S.; Rosenberg J. M.; Bouzida D.; Swendsen R. H.; Kollman P. A. J. Comput. Chem. 1992, 13, 1011–1021. [Google Scholar]
- Sharrow S. D.; Novotny M. V.; Stone M. J. Biochemistry (Mosc.) 2003, 42, 6302–6309. [DOI] [PubMed] [Google Scholar]
- Musah R. A.; Jensen G. M.; Bunte S. W.; Rosenfeld R. J.; Goodin D. B. J. Mol. Biol. 2002, 315, 845–857. [DOI] [PubMed] [Google Scholar]
- Talhout R.; Villa A.; Mark A. E.; Engberts J. B. F. N. J. Am. Chem. Soc. 2003, 125, 10570–10579. [DOI] [PubMed] [Google Scholar]
- Guinto E. R.; Cera E. D. Biochemistry 1996, 35, 8800–8804. [DOI] [PubMed] [Google Scholar]
- Baum B.; Muley L.; Heine A.; Smolinski M.; Hangauer D.; Klebe G. J. Mol. Biol. 2009, 391, 552–564. [DOI] [PubMed] [Google Scholar]
- Collins K. D. Biophys. J. 1997, 72, 65–76. [DOI] [PMC free article] [PubMed] [Google Scholar]
- Collins K. D.; Neilson G. W.; Enderby J. E. Biophys. Chem. 2007, 128, 95–104. [DOI] [PubMed] [Google Scholar]
- Hummer G.; Pratt L. R.; Garcia A. E. J. Phys. Chem. 1996, 100, 1206–1215. [Google Scholar]
- Fennell C. J.; Bizjak A.; Vlachy V.; Dill K. A. J. Phys. Chem. B 2009, 113, 6782–6791. [DOI] [PMC free article] [PubMed] [Google Scholar]
- Ehre D.; Lavert E.; Lahav M.; Lubomirsky I. Science 2010, 327, 672–675. [DOI] [PubMed] [Google Scholar]
- Marcus Y. Chem. Rev. 2009, 109, 1346–1370. [DOI] [PubMed] [Google Scholar]
- Cheng L.-T.; Wang Z.; Setny P.; Dzubiella J.; Li B.; McCammon J. A. J. Chem. Phys. 2009, 131, 144102. [DOI] [PMC free article] [PubMed] [Google Scholar]
Associated Data
This section collects any data citations, data availability statements, or supplementary materials included in this article.


