Abstract
Protein-tyrosine phosphatases (PTPs) have an important role in cell survival, differentiation, proliferation, migration and other cellular processes in conjunction with protein-tyrosine kinases. Still relatively little is known about the function of PTPs in vivo. We set out to systematically identify all classical PTPs in the zebrafish genome and characterize their expression patterns during zebrafish development. We identified 48 PTP genes in the zebrafish genome by BLASTing of human PTP sequences. We verified all in silico hits by sequencing and established the spatio-temporal expression patterns of all PTPs by in situ hybridization of zebrafish embryos at six distinct developmental stages. The zebrafish genome encodes 48 PTP genes. 14 human orthologs are duplicated in the zebrafish genome and 3 human orthologs were not identified. Based on sequence conservation, most zebrafish orthologues of human PTP genes were readily assigned. Interestingly, the duplicated form of ptpn23, a catalytically inactive PTP, has lost its PTP domain, indicating that PTP activity is not required for its function, or that ptpn23b has lost its PTP domain in the course of evolution. All 48 PTPs are expressed in zebrafish embryos. Most PTPs are maternally provided and are broadly expressed early on. PTP expression becomes progressively restricted during development. Interestingly, some duplicated genes retained their expression pattern, whereas expression of other duplicated genes was distinct or even mutually exclusive, suggesting that the function of the latter PTPs has diverged. In conclusion, we have identified all members of the family of classical PTPs in the zebrafish genome and established their expression patterns. This is the first time the expression patterns of all members of the large family of PTP genes have been established in a vertebrate. Our results provide the first step towards elucidation of the function of the family of classical PTPs.
Introduction
Protein-tyrosine phosphatases (PTPs) dephosphorylate phosphotyrosyl residues in proteins that are phosphorylated by protein-tyrosine kinases (PTKs). PTPs and PTKs play an important role in relaying signals in the cell and are tightly regulated [1], [2], [3]. Tyrosine phosphorylation signaling has been shown to control many fundamental processes in the cell and disruption of the balance between phosphorylation and dephosphorylation has been shown to be at the basis of several human diseases [4], [5], [6], [7], [8]. Historically, most signal transduction research has been done on kinases, and the function of most phosphatases remains to be determined.
PTPs in the human genome have been grouped in four classes (I, II, III and IV) based on their catalytic site and substrate specificity [4]. Class I contains the classical PTPs and the dual specificity phosphatases (DUSPs). The classical PTPs can be further subdivided in receptor-like (RPTP) and non-receptor-like (NRPTP) PTPs. The vertebrate genome encodes 37 different classical PTPs. Rodent genomes contain an additional Type 3 receptor gene, ptprv, resulting in a total of 38 PTP genes in rodents. The zebrafish is widely used as a model system for developmental biology [9], genetics [10], [11], [12], [13], cancer research [14], [15] and small molecule screens [16]. The zebrafish genome is being sequenced and with the release of Zv8 [17], the zebrafish genome assembly is almost complete. Currently, the zebrafish genome contains 21 genes that are annotated as PTP. We and others have established that PTPs have essential roles in zebrafish embryonic development by analysis of phenotypical defects upon knockdown of target PTP expression, including RPTPα [18], [19], PTPψ [20], Shp2 [21] and PEZ [22]. Given the number of PTPs in other vertebrate genomes, it is most likely that not all PTPs have been identified or annotated as PTP in the zebrafish genome.
In order to start to elucidate the role of classical PTPs, we identified all classical PTPs in the zebrafish genome and established their expression pattern by in situ hybridization. Based on homology to human orthologs, we identified 48 classical PTPs in the zebrafish genome. 14 genes are duplicated in zebrafish, compared to human and 3 human orthologs were not identified. Expression of all the genes that we had identified in silico was verified by sequencing of fragments of cDNAs that we obtained by reverse transcription-PCR (RT-PCR). Here, we report the expression patterns of all 48 PTP genes that we identified by in situ hybridization at six stages of zebrafish development. We focused on the expression patterns of duplicated genes and found that whereas some duplicated genes retained their expression pattern, others have diverging expression patterns. Our results suggest that the function of some duplicated PTP genes is overlapping and the function of others is distinct.
Results and Discussion
Identification of all PTPs in the zebrafish genome
Some genes encoding PTPs are annotated in the zebrafish genome but many are conspicuously missing. We used the PTPs found in the human genome as a template in an attempt to systematically identify the entire family of zebrafish PTPs. We used the PTP domain of human proteins which was identified by scanning the peptide sequence on ExPASy Prosite (http://www.expasy.org/prosite/). Whenever a tandem PTP domain was present, the D1 PTP domain was used for BLAST searches. All human PTP domains were BLASTed against the Zv8 version of the zebrafish genome (TBLASTN) and all hits were scanned for PTP domains. We analyzed the hits for the presence of known coding sequences or annotated genes, or when not present for predicted gene sequences (Genscan). All these sequences were subsequently scanned for the presence of PTP domains using Prosite. We used annotated gene sequences or known coding sequences where possible. In other cases, predicted transcripts were used. For some genes (ptpn3, ptpn20, ptprt, ptprua, ptprub and ptprjb) partial known coding sequences were available but they did not cover the PTP domain. In those cases predicted sequences were used for alignment purposes. Yet, known coding sequences were used for sequencing and probe generation. In two cases no known coding sequence was available at all (ptprm, ptprr). In those cases predicted sequences were used for alignment, probe generation and sequencing.
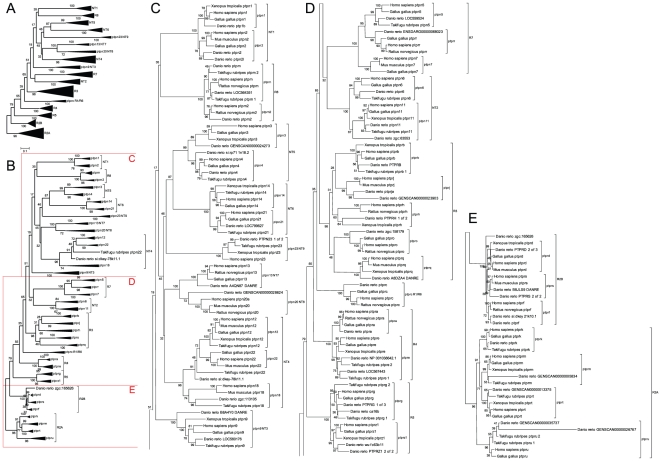
To verify our hits, we aligned all the protein sequences of PTP domains identified in this way with human, mouse, rat, chicken, Xenopus and fugu PTP domains obtained from the Ensembl database (Fig. 1). We used the PTP domains identified using Prosite and aligned those sequences with Mega4 software, using the Dayhoff matrix and pairwise deletion. All identified zebrafish PTP genes are listed in Tables 1 and 2, together with Zv8 identifiers. For zebrafish PTP gene and protein names we used conventions as mentioned in [23]. Names were appended with “a” or “b” for duplicates where necessary. Whereas the cladogram in Fig. 1 is based on alignment of proteins, we used gene names for clarity. We identified 48 PTP genes in the zebrafish genome. All of them cluster together with orthologs of other vertebrate species. 14 genes constituted a duplicated gene (28 genes in total) and 3 human orthologs were not identified (ptpn7, ptpn12 and ptpn14). The missing PTP genes may have been lost in evolution or these genes may (partially) be located in poorly sequenced areas of the genome, thus preventing identification by BLAST searches. One of these genes, ptpn14, encoding Pez has been described previously in zebrafish [22]. The EST sequence at the basis of these experiments is BQ285767.1 which corresponds to LOC799627 in the Ensembl database. Alignment of the PTP domain encoded by LOC799627 indicated more homology to the structurally related ptpn21 than to ptpn14 (Fig. 1 ). Possibly there is only one ortholog of the highly related ptpn14 and ptpn21 in zebrafish. In our in silico screen we found two candidates for zebrafish ptpn23, one annotated as ptpn23 and one annotated as si:dkeyp-114f9.2 in the Ensembl database. It is noteworthy that Takifugu rubripes and other fish species have only one copy of the ptpn23 gene. Si:dkeyp-114f9.2, which does not encode a PTP domain, was designated ptpn23b, based on structural and sequence similarity of the BRO domain. BLASTing the coding region of ptpn23b to the human genome yields ptpn23 as the top hit. We cannot exclude the possibility that the PTP domain was not detected because of errors in the current assembly of the zebrafish genome. However, this seems unlikely since there are no gaps present in the region and the sequence quality of the region is good. We did not detect exons encoding a PTP domain between si:dkeyp-114f9.2 (ptpn23b) and its flanking gene to the 3′ side (si:dkeyp-114f9.4 / CSPG5). We analyzed the presence of expressed sequence tags (ESTs) to the 3′-side of si:dkeyp-114f9.2 (ptpn23b). We found 2 ESTs in this short region, both containing non-coding sequence, likely making them part of the 3′ UTR of ptpn23b. We amplified the 3′ end of si:dkeyp-114f9.2 (ptpn23b) by reverse transcription PCR, sequenced this area and verified the presence of the stop codon and 3′ UTR as annotated in Ensembl database (EBI identifier: FR668536). Therefore, we conclude that ptpn23b does not encode a PTP domain. It is noteworthy that human ptpn23 encodes a PTP domain that harbors no catalytic activity and functional assays indicated that the function of the protein product of ptpn23, HD-PTP, in cell signaling is independent of PTP activity [24]. Yet, deletion of the PTP domain of rat PTP-TD14, encoded by ptpn23, abolished its capacity to inhibit Ha-ras-mediated focus formation of NIH3T3 cells [25], indicating that whereas PTP-TD14 does not encode an active PTP, its PTP domain is functional. These functional data on human and rat HD-PTP support the hypothesis that ptpn23 was duplicated and that ptpn23b lost its PTP domain in the course of evolution. Whether ptpn23b encodes a functional gene remains to be determined.
Figure 1. Alignment of vertebrate PTP domains.
Protein sequences were obtained from Ensembl database of all PTPs from zebrafish, Fugu, Xenopus, chicken, mouse, rat and human. The PTP domains were identified using http://www.expasy.org/prosite/ and used for alignment using the MEGA4 program. When a tandem PTP domain was present, the D1 PTP domain was used for the alignment. The evolutionary history was inferred using the Neighbor-Joining method. The optimal tree with the sum of branch length = 31.88069250 is shown. The percentage of replicate trees in which the associated taxa clustered together in the bootstrap test (500 replicates) are shown next to the branches. The tree is drawn to scale, with branch lengths in the same units as those of the evolutionary distances used to infer the phylogenetic tree. The evolutionary distances were computed using the Dayhoff matrix based method and are in the units of the number of amino acid substitutions per site. All positions containing alignment gaps and missing data were eliminated only in pairwise sequence comparisons (Pairwise deletion option). There were a total of 475 positions in the final dataset (Tamura et al. 2007). An overview of the entire collapsed tree is shown in Figure 1A, with individual pieces split to make up figures 1B–E, as indicated. Not all known annotated genes of species other than zebrafish are included.
Table 1. Classical non-receptor PTP genes in the zebrafish genome.
| gene | protein | Zv8 identifier | EBI identifier |
| ptpn1 | PTP1b | ptpn1 | FN428729 |
| ptpn2a | tcPTPa | ptpn2 | FN428730 |
| ptpn2b | tcPTPb | ptpn2l | FN658836 |
| ptpn6 | shp1 | ptpn6 | FN428705 |
| ptpn11a | shp2a | ptpn11 | FN428738 |
| ptpn11b | shp2b | zgc:63553 | FN428707 |
| ptpn9a | meg2a | LOC560176 | FN428732 |
| ptpn9b | meg2b | B8A4Y0_DANRE | FN428709 |
| ptpn12 | PEST | not found | not found |
| ptpn18 | BDP1 | zgc:113105 | FN428701; FN428736 |
| ptpn22 | LyPTP | si:dkey-78k11.1 | FN428715; FN428735 |
| ptpn3 | PTPh1 | GENSCAN00000024273; Q9YHE7_DANRE | FN428731 |
| ptpn4a | meg1a | ptpn4 | FN428700; FN428714 |
| ptpn4b | meg1b | si:rp71-1n18.2 | FN658840 |
| ptpn21 | PTPd1 | LOC799627 | FN428703 |
| ptpn14 | PTP36 | not found | not found |
| ptpn13 | PTPBAS | A4QN87_DANRE | FN428711 |
| ptpn23a | hdPTPa | PTPN23 | FN428733 |
| ptpn23b | hdPTPb | si:dkeyp-114f9.2 | FN428734; FR668536 |
| ptpn20 | PTPTyp | GENSCAN00000028624; B8JK77_DANRE | FN428737 |
| ptpn5 | PTP-STEP | LOC559524 | FN428702 |
| ptpn7 | HePTP | not found | not found |
All candidate genes were aligned and assigned their respective gene names based on homology of the PTP domain and overall gene structure, and listed here are the non-receptor PTPs by gene name, protein name, Zv8 identifier and EBI accession number. Fragments of all genes were sequenced and respective sequences were submitted to the EMBL-EBI nucleotide sequence database.
Table 2. Classical receptor PTP genes in the zebrafish genome.
| gene | protein | Zv8 identifier | EBI identifier |
| ptprc | CD45 | ptprc | FN428713 |
| ptpra | RPTPá | ptpra | FN428716 |
| ptprea | RPTPåa | LOC567443 | FN653010 |
| ptpreb | RPTPåb | NP_001038642.1 | FN653011; FN653012 |
| ptprm | RPTPì | GENSCAN00000005834; Z6923F | FN428719 |
| ptprk | RPTPê | ptprk | FN428708 |
| ptprt | RPTPñ | GENSCAN00000013375; zc137e24.za | FN428710 |
| ptprua | RPTPëa | GENSCAN00000035737; A3QK35_DANRE | FN428712; FN665786 |
| ptprub | RPTPëb | GENSCAN00000026767; ptpru | FN665787 |
| ptprfa | LARa | ptprf | FN428740 |
| ptprfb | LARb | si:dkey-21k10.1 | FN428739 |
| ptprsa | RPTPóa | B8JLS9_DANRE | FN428741 |
| ptprsb | RPTPób | PTPRS | FN428742 |
| ptprda | RPTPäa | ptprd | FN428718 |
| ptprdb | RPTPäb | zgc:165626 | FN428717 |
| ptprga | RPTPãa | PTPRG | FN428720 |
| ptprgb | RPTPãb | ca16b | FN653013; FN653014 |
| ptprza | RPTPæa | PTPRZ1 | FN658837; FN658838 |
| ptprzb | RPTPæb | wu:fc63b11 | FN428721 |
| ptprb | RPTPâ | PTPRB | FN428722 |
| ptprja | dep1a | ptprja | FN428723 |
| ptprjb | dep1b | GENSCAN00000023903; LOC100006189 | FN428724 |
| ptprh | sap1 | PTPRH | FN428725 |
| ptprq | PTPS31 | A8DZA4_DANRE | FN428726 |
| ptpro | GLEPP | ptpro | FN428727 |
| ptprr | pcPTP | Zv7:ENSDARG00000068023; GENSCAN00000030970; Zv8_NA3250.7 | FN658839 |
| ptprna | IA2a | LOC564351 | FN428704 |
| ptprnb | IA2b | ptprn | FN428728 |
| ptprn2 | IA2â | ptprn2 | FN428706 |
All candidate genes were aligned and assigned their respective gene names based on homology of the PTP domain and overall gene structure, and listed here are the receptor type PTPs by gene name, protein name, Zv8 identifier and EBI accession number. Fragments of all genes were sequenced and respective sequences were submitted to the EMBL-EBI nucleotide sequence database.
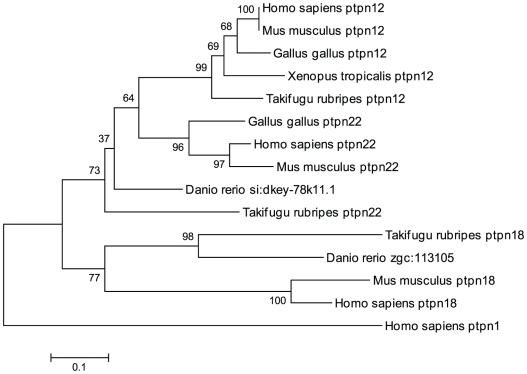
Our search for candidate genes of the three non-receptor NT4 subtype genes, ptpn12, ptpn18 and ptpn22, resulted in two candidates, zgc:113105 and si:dkey-78k11.1. The former clearly aligns with ptpn18, but the latter is heavily truncated with only limited predicted sequence information in the PTP domain. The truncated part of the PTP domain aligns with ptpn22 in our phylogenetic tree (Fig. 1), and to ensure that this is a member of the NT4 class PTPs, we derived a phylogenetic tree with truncated PTP domains from several species corresponding to the available sequence in the zebrafish genome (Fig. 2). When aligned with truncated counterparts, si:dkey-78k11.1 still aligns with ptpn22 and based on sequence homology, we conclude that this predicted gene encodes a fragment of zebrafish ptpn22 and the missing part of the gene is probably encoded by a poorly sequenced part of the genome.
Figure 2. Alignment of truncated PTP domains of the NT4 non-receptor class.
The PTP domains of genes of the NT4 class from several species were truncated to approximately correspond to the limited available sequence from si:dkey-78k11.1. The evolutionary history was inferred using the Neighbor-Joining method. The optimal tree with the sum of branch length = 3.38256318 is shown. The percentage of replicate trees in which the associated taxa clustered together in the bootstrap test (1000 replicates) are shown next to the branches. The tree is drawn to scale, with branch lengths in the same units as those of the evolutionary distances used to infer the phylogenetic tree. The evolutionary distances were computed using the Dayhoff matrix based method and are in the units of the number of amino acid substitutions per site. All positions containing alignment gaps and missing data were eliminated only in pairwise sequence comparisons (Pairwise deletion option). There were a total of 109 positions in the final dataset. Phylogenetic analyses were conducted in MEGA4.
Spatio-temporal expression of PTPs in zebrafish embryos
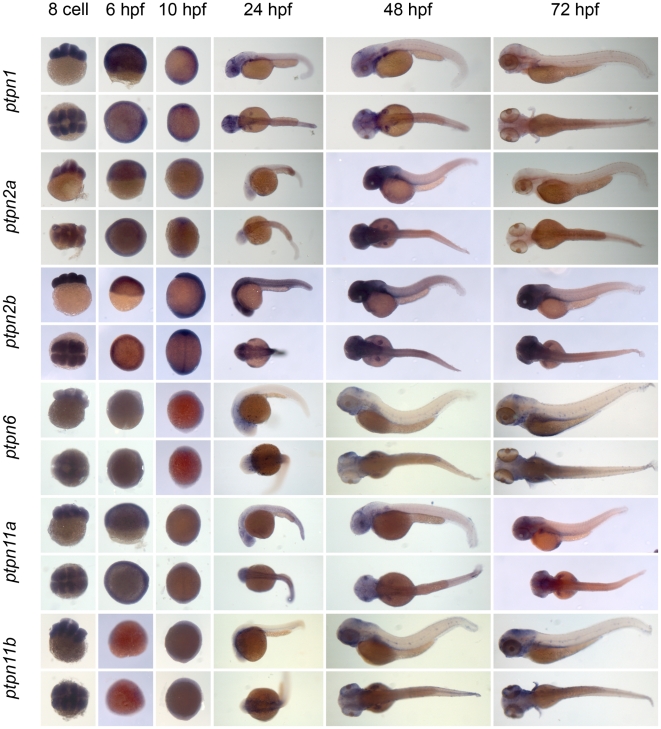
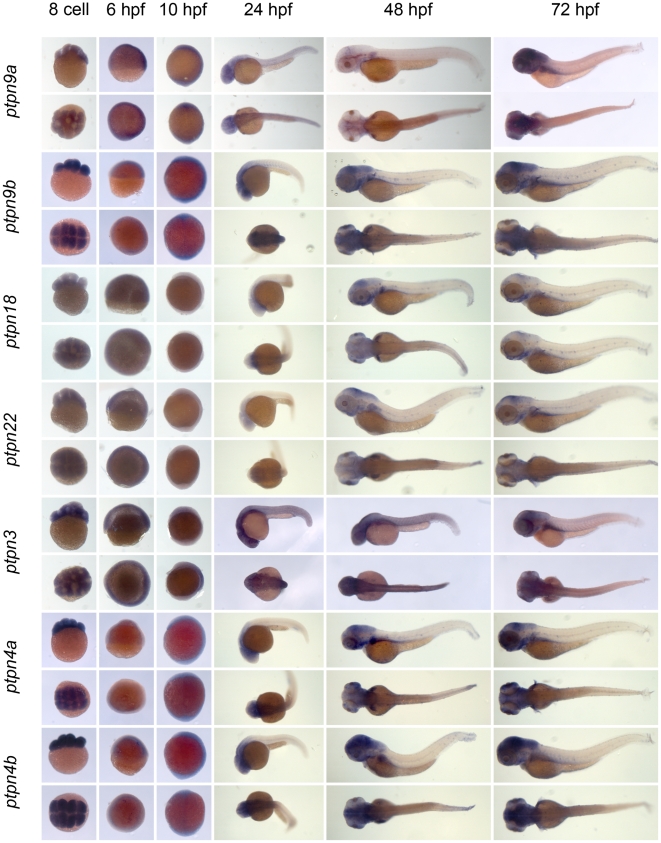
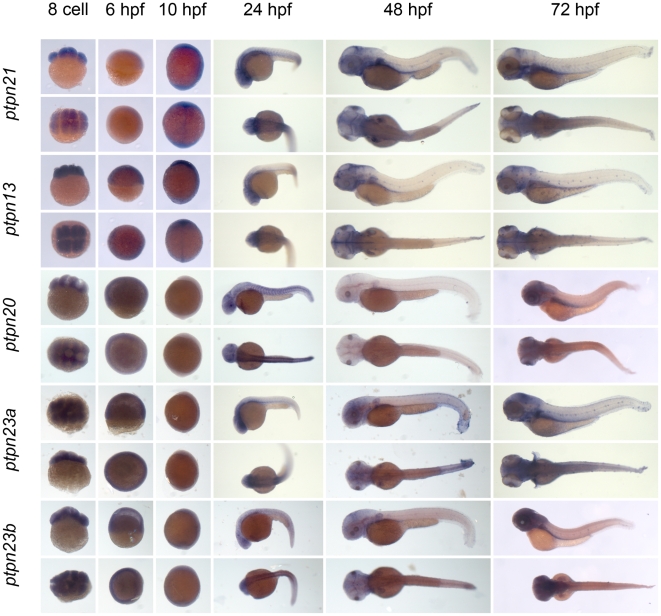
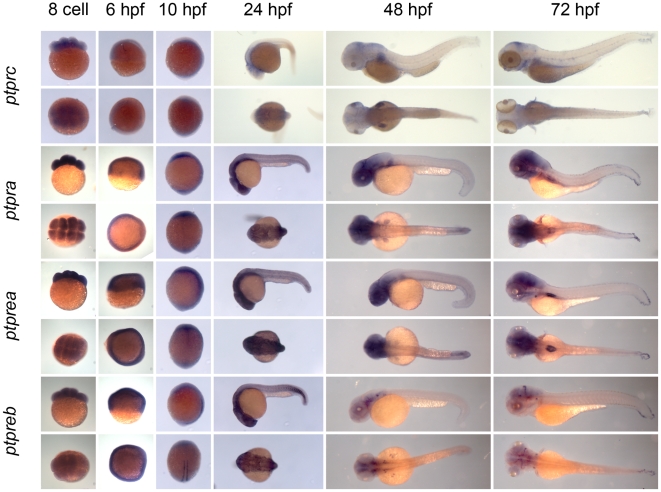
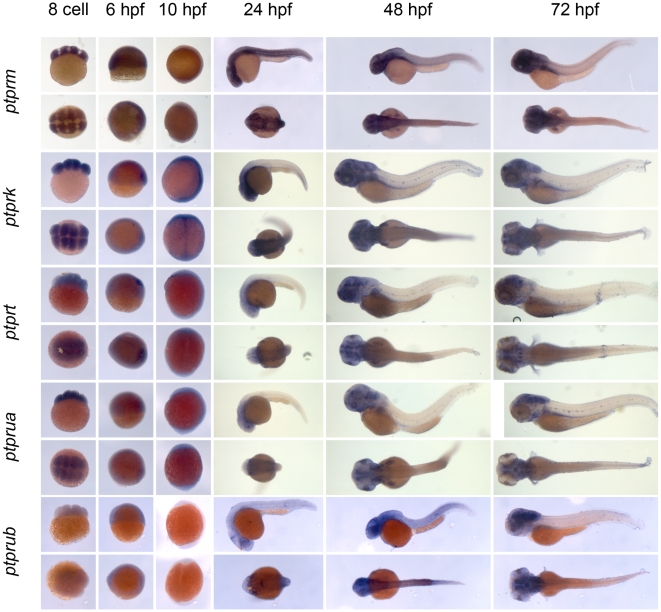
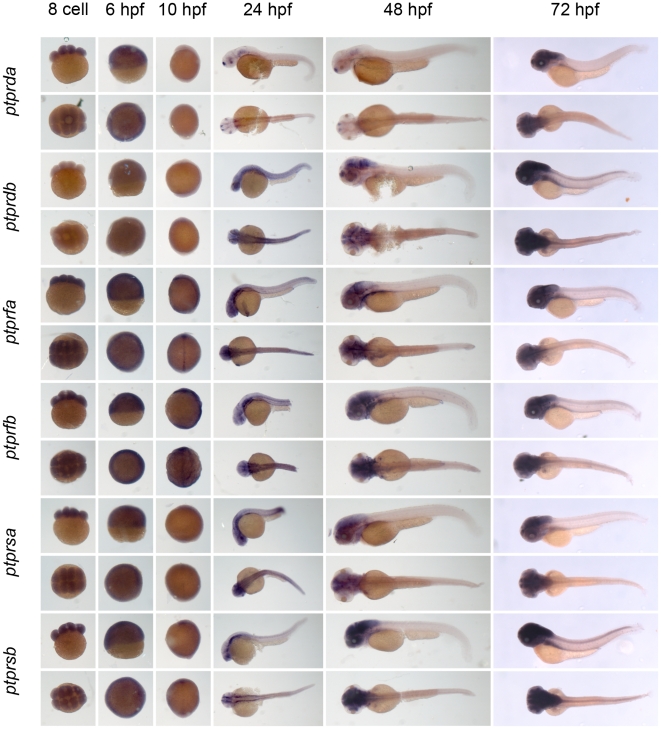
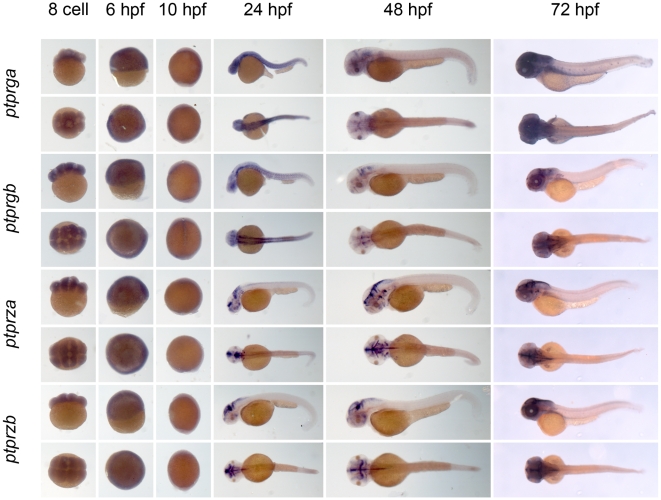
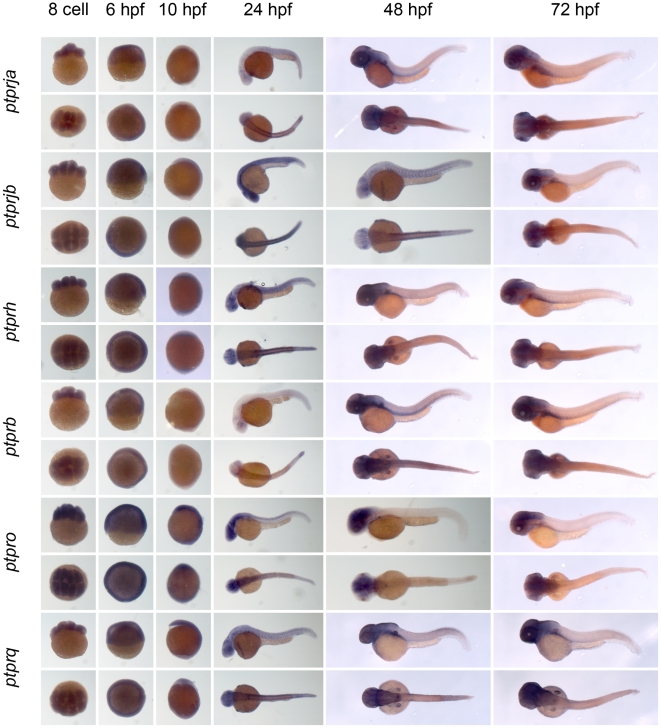
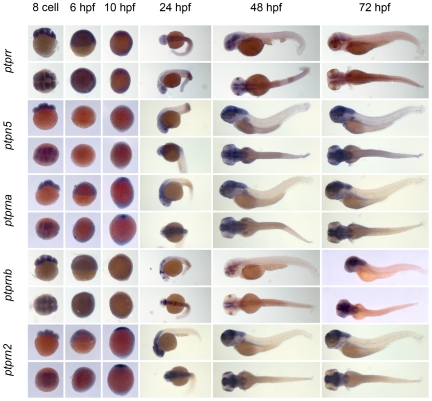
To investigate whether the genes we identified in silico are actually expressed in the zebrafish we amplified fragments of all PTP genes by RT-PCR. Based on our sequence information, we designed primer sets spanning approximately 800 bp coding region for every PTP encoding gene that we identified in the zebrafish genome, as well as a nested primer set with a T7 primer in the reverse oligo, facilitating sequencing and probe generation (Table S1). RNA was isolated from a mixture of 1 dpf and 2 dpf zebrafish embryos and RT-PCR was done using oligo dT priming and the two sets of specific primers for each gene. The PCR products were sequenced and these sequences were verified by BLASTing. The sequences were submitted to the EMBL-EBI database and accession numbers are shown in Table 1 and 2 . Using this approach, all 48 PTP encoding genes that we identified in silico were verified by RT-PCR and sequencing. As a first step to assess the function of the genes encoding the family of classical PTPs, we characterized the expression patterns at six distinct stages of zebrafish development by in situ hybridization. Using the T7 tag in the reverse nested oligo we generated antisense DIG-labeled RNA probes for whole mount in situ hybridization. Albino zebrafish embryos were obtained and fixed at the 8 cell stage, 6 hpf (shield stage), 10 hpf (1 somite stage), 24 hpf, 48 hpf and 72 hpf. Whole mount in situ hybridization experiments were done as described in the Materials and Methods section. All DIG labeled antisense probes gave staining patterns in at least one of the time points taken (Fig. 3, 4, 5, 6, 7, 8, 9, 10 and 11), indicating that every PTP encoding gene is expressed in zebrafish embryos.
Figure 3. Expression patterns of the classical PTPs during zebrafish development.
Albino zebrafish embryos were fixed at the following stages: 8 cell, 6 hpf, 10 hpf, 1 dpf, 2 dpf and 3 dpf. Whole mount in situ hybridization experiments were done with probes generated to target the classical PTPs and pictures were taken. Shown are 8 cell stage; top: lateral view, animal pole on top; bottom: animal pole view. 6 hpf; top: lateral view, animal pole on top, bottom: animal pole view. 10 hpf; top: lateral view, dorsal to the right, bottom: dorsal view anterior towards the top. 24, 48 and 72 hpf; top: lateral view anterior to the left, bottom: dorsal view anterior to the left.
Figure 4. See legend to Fig. 3.
Figure 5. See legend to Fig. 3.
Figure 6. See legend to Fig. 3.
Figure 7. See legend to Fig. 3.
Figure 8. See legend to Fig. 3.
Figure 9. See legend to Fig. 3.
Figure 10. See legend to Fig. 3.
Figure 11. See legend to Fig. 3.
We proceeded to analyze the expression data of all PTP genes (Fig. 3, 4, 5, 6, 7, 8, 9, 10 and 11) and summarized these in Tables 3 and 4. We conclude that almost every PTP is maternally provided (8 cell stage) and most PTPs are expressed ubiquitously at early stages (6 hpf and 10 hpf). At later stages expression patterns start to differentiate for individual genes, with most genes giving staining in specific tissues or organs as opposed to the ubiquitous expression seen at earlier stages.
Table 3. Expression patterns of zebrafish non-receptor PTPs.
| PTP type: | gene: | 8 cell | 6 hpf | 10 hpf | 24 hpf | 48 hpf | 72 hpf |
| NT1 | ptpn1 | ++ | ++ | ++ | s | s | − |
| ptpn2a | + | + | + | +/− | + | − | |
| ptpn2b | ++ | + | ss | ss | ++ | ++ | |
| NT2 | ptpn6 | +/− | +/− | − | +/− | +/− | s |
| ptpn11a | + | + | + | s | s | s | |
| ptpn11b | ++ | − | +/− | s | s | s | |
| NT3 | ptpn9a | +/− | + | + | s | +/− | + |
| ptpn9b | ++ | + | ++ | ++ | ss | ss | |
| NT4 | ptpn18 | +/− | +/− | − | +/− | s | s |
| ptpn22 | +/− | +/− | − | − | s | s | |
| NT5 | ptpn3 | + | ++ | + | + | + | + |
| ptpn4a | ++ | − | +/− | + | s | ss | |
| ptpn4b | ++ | − | s | + | ss | ss | |
| NT6 | ptpn21 | + | − | s | s | s | s |
| NT7 | ptpn13 | ++ | + | s | s | s | s |
| NT8 | ptpn23a | + | + | − | s | s | ss |
| ptpn23b | + | + | +/− | s | s | s | |
| NT9 | ptpn20 | + | + | − | s | +/− | s |
| R7 | ptpn5 | + | − | − | s | s | ss |
Expression patterns of all classical non-receptor PTPs at 6 distinct stages of zebrafish development as shown in Fig. 3, 4 and 5 were analyzed and quantified as “−” for no expression, “+/−” for faint expression, “+” for expression and “++” for strong expression, “s” for localized expression or “ss” for strong localized expression.
Table 4. Expression patterns of zebrafish receptor PTPs.
| PTP type: | gene: | 8 cell | 6 hpf | 10 hpf | 24 hpf | 48 hpf | 72 hpf |
| R1/R6 | ptprc | +/− | +/− | s | s | s | s |
| R4 | ptpra | ++ | + | + | s | s | s |
| ptprea | ++ | ++ | s | s | s | s | |
| ptpreb | + | ++ | s | s | s | s | |
| R2B | ptprm | ++ | ++ | ss | ss | ss | |
| ptprk | ++ | + | s | ss | ss | ss | |
| ptprt | + | +/− | +/− | s | ss | ss | |
| ptprua | ++ | +/− | + | + | ss | ss | |
| ptprub | − | +/− | − | + | ss | ss | |
| R2A | ptprfa | + | ++ | s | ss | ss | s |
| ptprfb | + | ++ | s | s | s | s | |
| ptprsa | + | + | +/− | s | s | ss | |
| ptprsb | + | + | +/− | s | ss | ++ | |
| ptprda | +/− | + | − | s | s | s | |
| ptprdb | − | +/− | − | ss | ss | ss | |
| R5 | ptprga | +/− | + | − | ss | s | ++ |
| ptprgb | + | + | s | s | s | s | |
| ptprza | + | + | − | s | ss | ss | |
| ptprzb | +/− | + | − | s | ss | ss | |
| R3 | ptprb | +/− | + | − | +/− | ss | s |
| ptprja | +/− | +/− | − | s | ss | s | |
| ptprjb | + | + | − | ss | s | s | |
| ptprh | + | + | + | ss | s | s | |
| ptpro | ++ | ++ | s | s | s | s | |
| ptprq | + | + | + | s | + | ++ | |
| R7 | ptprr | ++ | ++ | ++ | s | s | s |
| R8 | ptprna | + | + | s | ss | ss | ss |
| ptprnb | + | + | − | s | s | s | |
| ptprn2 | +/− | +/− | s | ss | ss | ss |
Expression patterns of all classical receptor PTPs at 6 distinct stages of zebrafish development as shown in Fig. 6, 7, 8, 9, 10 and 11 were analyzed and quantified as “−” for no expression, “+/−” for faint expression, “+” for expression and “++” for strong expression, “s” for localized expression or “ss” for strong localized expression.
Expression patterns of duplicated genes
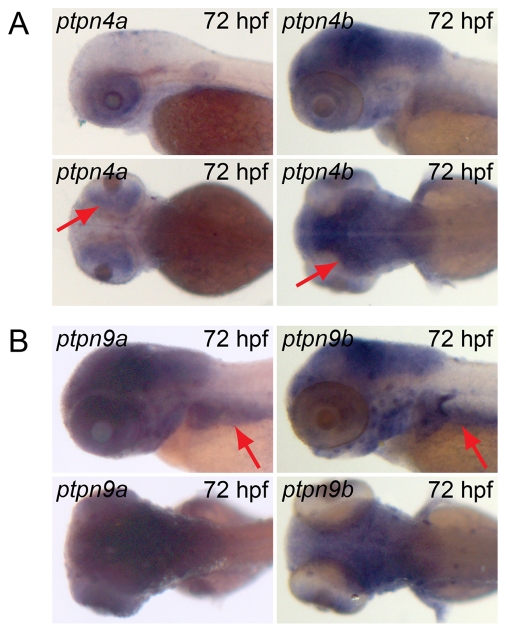
Fourteen genes encoding PTPs are duplicated in the zebrafish genome and we investigated the expression patterns of the duplicated genes in detail. Five of the non-receptor PTPs are duplicated in the zebrafish genome, ptpn2, ptpn4, ptpn9, ptpn11 and ptpn23. The orthologue of ptpn4 has been reported to be involved in establishment and maintenance of axon projections in the central brain in Drosophila [26]. Analysis of the expression pattern in zebrafish shows that ptpn4b is expressed in the fore-, mid- and hindbrain at 3 dpf (Fig. 12A, arrows) and at earlier stages (Fig. 4), which is consistent with the expression pattern in Drosophila. Ptpn4a, however, is expressed in the retina exclusively (Fig. 12A, arrows). Hence, despite high homology of ptpn4a and ptpn4b, their expression patterns are mutually exclusive. Ptpn9 has been reported to be involved in platelet and lymphocyte activation through vesicle trafficking [27], [28], but has also been shown to be an antagonist of hepatic insulin signaling in mice [29]. In zebrafish the expression patterns of ptpn9a and ptpn9b appear very similar, with expression in the brain and liver at 3 dpf (Fig. 12B, arrows).
Figure 12. Similar and distinct expression patterns of duplicated non-receptor PTPs.
Albino zebrafish embryos were fixed at 24 hpf and whole mount in situ hybridization was done with probes generated to target (A) ptpn4a and ptpn4b or (B) ptpn9a and ptpn9b. Depicted are (top) lateral view and (bottom) dorsal view of 72 hpf embryos.
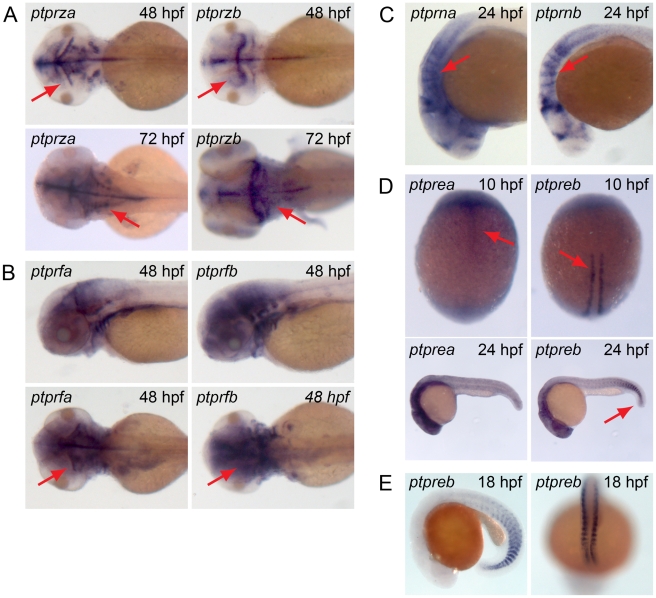
Several receptor PTPs are duplicated in the zebrafish genome, including the entire R5 type and R2B type PTPs. Ptprz has been reported to have a function in memory by dephosphorylating p190RhoGAP in the hippocampus [30]. In the zebrafish ptprza and ptprzb stain specific, but very distinct structures in the brain (Fig. 13A). Ptprza is expressed in the hindbrain and in more anterior parts of the tectum, whereas ptprzb is expressed in the hindbrain and the posterior tectum. Ptprf plays a role in the development and maintenance of excitatory synapses and axon guidance in cultured rat hippocampal neurons [31]. In the zebrafish ptprfa and ptprfb show very similar expression patterns and they are expressed mainly in the central nervous system and the liver (Fig. 13B). Ptprn is a catalytically inactive PTP predominantly expressed in neuroendocrine cells that possess regulated secretory granules [32], [33]. Expression in the zebrafish at 24 hpf is limited to rhombomeres and is similar for ptprna and ptprnb (Fig. 13C). Ptpre plays a role in osteoclast bone adhesion and resorption in mammals and in convergence and extension cell movements during zebrafish gastrulation [19], [34]. In the zebrafish ptprea is expressed in anterior parts of the notochord, whereas ptpreb is expressed in the more posterior adaxial cells at 10 hpf (Fig. 13D). At 24 hpf ptpreb is expressed at the tip of the tail and in the brain, whereas ptprea expression is restricted to the brain. At later time points, ptpreb expression is fading, while ptprea remains strongly expressed in the entire brain (Fig. 13D). The ptpreb expression pattern in somites in the tail is reminiscent of expression patterns of genes that are expressed in newly formed somites. Therefore, we analyzed expression of ptpreb at 18 hpf and indeed found strong expression of ptpreb in newly formed somites, indicating that ptpreb is expressed during somitogenesis (Fig. 13E). We have done functional assays on ptpre in the zebrafish previously, but focused on double knockdowns of both ptprea and ptpreb [19]. The function of the individual ptpre genes resulting from their diverging expression patterns remains to be determined.
Figure 13. Overlapping and mutually exclusive expression patterns of duplicated receptor PTPs.
Albino zebrafish embryos were fixed at different stages and whole mount in situ experiments were done with probes generated to target (A) ptprza and ptprzb, (B) ptprfa and ptprfb, (C) ptprna and ptprnb, (D) ptprea and ptpreb and (E) ptpreb. Depicted are (A) dorsal views of (top) 48 hpf embryos and (bottom) 72 hpf embryos, (B) (top) lateral views and (bottom) dorsal views of 48 hpf embryos, (C) lateral views of 24 hpf embryos and (D) dorsal view of 10 hpf embryos (top), lateral view of 24 hpf embryos (bottom). (E) Lateral view (left) and dorsal view (right) of the tip of the tail of 18 hpf embryos.
Analysis of the expression of duplicated genes reveals that the expression pattern of approximately half of them is similar, whereas the other half has distinct or even mutually exclusive expression patterns. Similar expression patterns may suggest redundancy among the duplicated genes and divergence of the expression patterns of duplicated genes suggests a non-redundant function. Similarities and differences in the functions of the duplicated PTP genes remain to be determined.
According to the duplication-degeneration-complementation (DDC) model [35] degenerative mutations in regulatory elements can increase the probability of duplicate gene preservation and the mechanism of preservation of duplicate genes is partitioning of ancestral functions. The teleost genome is believed to have been duplicated about 320 million years ago [36], [37]. If only random mutations in genes are considered, most genes would have disappeared by now. There are 37 PTP genes present in the mammalian genome, of which 14 genes are duplicated in the zebrafish genome, ammounting to 39% of all PTP genes. In half of these cases we observed that expression patterns are complementary between duplicated genes, in accordance with the DDC model. The other half of duplicated genes shows expression patterns that are similar. However, expression patterns may be complementary between duplicated genes on the cellular or subcellular level, at which resolution we cannot distinguish with our current data. It would be interesting to further investigate the function of duplicated genes with seemingly identical expression patterns.
In conclusion, we have identified all genes in the zebrafish genome that encode classical PTPs. We identified a second copy of ptpn23 which appears to lack a PTP domain, which is interesting because whereas HD-PTP itself does not exhibit PTP activity, its PTP domain is required for its function and hence ptpn23b may have lost its PTP domain in the course of evolution. We have established that all PTP genes are expressed by RT-PCR and we confirmed partial sequences of these genes. Moreover, we have established the spatio-temporal expression patterns of all genes encoding classical PTPs in zebrafish embryos, which is a first step towards understanding their function. Whereas some duplicated genes have largely overlapping expression patterns, others are distinct or even mutually exclusive, which suggests that the function of the latter group has diverged since their duplication.
Materials and Methods
Bioinformatics
The Ensembl database (http://www.ensembl.org/Multi/blastview/) was used to BLAST human PTP domains against the latest version of the zebrafish genome (Zv8) or other genomes. TBLASTN algorithm was used against the LATESTGP DNA database, using “near exact matches” for search sensitivity. To identify PTP domain protein sequences in human and zebrafish proteins we used Prosite (http://www.expasy.org/prosite/). Human and zebrafish PTP domains were aligned for generating a phylogenetic tree using MEGA4 [38] software (http://www.megasoftware.net/). Aligning was done by clustalW using the PAM matrix. Phylogenetic tree construction was done using Neighbor-Joining, bootstrapped tree inference and using the Dayhoff Matrix (Amino Acid) as a model, pairwise deletion for gaps, homogenous pattern among lineages, uniform rates among sites and all substitutions included.
Whole mount in situ hybridization
Wild type zebrafish were kept and embryos were raised under standard conditions at the Hubrecht Institute. Only wild type embryos up to 3 dpf were used for these experiments, which does not require approval of the animal experiments committee according to national and European law. Zebrafish embryos of the appropriate stages were collected and fixed in PBS containing 4% PFA. Embryos were dechorionated when needed and transferred to 100% MeOH at −20°C for at least 12 hours. Whole mount in situ hybridization was performed as described before [39].
Accession numbers
All in silico identified zebrafish genes were verified by sequencing and sequences were submitted to EMBL-EBI nucleotide database. All accession numbers are shown in Tables 1 and 2.
Supporting Information
Oligos used for probe generation and sequencing. Listed are all oligos used for the generation of in situ probes and to sequence cDNA. Oligo 1 and 4 serve as forward and reverse primer, respectively. Oligos 2 and 3 are nested forward and reverse primers. Oligo 3 contains a T7 tag, which facilitates generation of antisense probes. All probes were designed to span approximately 800 bp of known coding sequence. n.d., not done.
(0.07 MB DOC)
Footnotes
Competing Interests: The authors have declared that no competing interests exist.
Funding: This work was supported in part by a grant from the Research Council for Earth and Life Sciences (ALW 815.02.007) with financial aid from the Netherlands Organisation for Scientific Research (NWO). The funders had no role in study design, data collection and analysis, decision to publish, or preparation of the manuscript.
References
- 1.Hunter T. Protein kinases and phosphatases: the yin and yang of protein phosphorylation and signaling. Cell. 1995;80:225–236. doi: 10.1016/0092-8674(95)90405-0. [DOI] [PubMed] [Google Scholar]
- 2.van der Geer P, Hunter T, Lindberg RA. Receptor protein-tyrosine kinases and their signal transduction pathways. Annu Rev Cell Biol. 1994;10:251–337. doi: 10.1146/annurev.cb.10.110194.001343. [DOI] [PubMed] [Google Scholar]
- 3.Van Vactor D, O'Reilly AM, Neel BG. Genetic analysis of protein tyrosine phosphatases. CurrOpinGenetDev. 1998;8:112–126. doi: 10.1016/s0959-437x(98)80070-1. [DOI] [PubMed] [Google Scholar]
- 4.Alonso A, Sasin J, Bottini N, Friedberg I, Friedberg I, et al. Protein tyrosine phosphatases in the human genome. Cell. 2004;117:699–711. doi: 10.1016/j.cell.2004.05.018. [DOI] [PubMed] [Google Scholar]
- 5.Hendriks WJ, Elson A, Harroch S, Stoker AW. Protein tyrosine phosphatases: functional inferences from mouse models and human diseases. Febs J. 2008;275:816–830. doi: 10.1111/j.1742-4658.2008.06249.x. [DOI] [PubMed] [Google Scholar]
- 6.LaForgia S, Morse B, Levy J, Barnea G, Cannizzaro LA, et al. Receptor protein-tyrosine phosphatase gamma is a candidate tumor suppressor gene at human chromosome region 3p21. Proc Natl Acad Sci U S A. 1991;88:5036–5040. doi: 10.1073/pnas.88.11.5036. [DOI] [PMC free article] [PubMed] [Google Scholar]
- 7.Tartaglia M, Mehler EL, Goldberg R, Zampino G, Brunner HG, et al. Mutations in PTPN11, encoding the protein tyrosine phosphatase SHP-2, cause Noonan syndrome. NatGenet. 2001;29:465–468. doi: 10.1038/ng772. [DOI] [PubMed] [Google Scholar]
- 8.Wang Z, Shen D, Parsons DW, Bardelli A, Sager J, et al. Mutational analysis of the tyrosine phosphatome in colorectal cancers. Science. 2004;304:1164–1166. doi: 10.1126/science.1096096. [DOI] [PubMed] [Google Scholar]
- 9.Kimmel CB, Warga RM. Tissue-Specific Cell Lineages Originate in the Gastrula of the Zebrafish. Science. 1986;231:365–368. doi: 10.1126/science.231.4736.365. [DOI] [PubMed] [Google Scholar]
- 10.Driever W, Solnica-Krezel L, Schier AF, Neuhauss SC, Malicki J, et al. A genetic screen for mutations affecting embryogenesis in zebrafish. Development. 1996;123:37–46. doi: 10.1242/dev.123.1.37. [DOI] [PubMed] [Google Scholar]
- 11.Haffter P, Granato M, Brand M, Mullins MC, Hammerschmidt M, et al. The identification of genes with unique and essential functions in the development of the zebrafish, Danio rerio. Development. 1996;123:1–36. doi: 10.1242/dev.123.1.1. [DOI] [PubMed] [Google Scholar]
- 12.Kimmel CB, Kane DA, Walker C, Warga RM, Rothman MB. A mutation that changes cell movement and cell fate in the zebrafish embryo. Nature. 1989;337:358–362. doi: 10.1038/337358a0. [DOI] [PubMed] [Google Scholar]
- 13.Wienholds E, Schulte-Merker S, Walderich B, Plasterk RH. Target-selected inactivation of the zebrafish rag1 gene. Science. 2002;297:99–102. doi: 10.1126/science.1071762. [DOI] [PubMed] [Google Scholar]
- 14.Berghmans S, Murphey RD, Wienholds E, Neuberg D, Kutok JL, et al. tp53 mutant zebrafish develop malignant peripheral nerve sheath tumors. Proc Natl Acad Sci U S A. 2005;102:407–412. doi: 10.1073/pnas.0406252102. [DOI] [PMC free article] [PubMed] [Google Scholar]
- 15.Faucherre A, Taylor GS, Overvoorde J, Dixon JE, Hertog J. Zebrafish pten genes have overlapping and non-redundant functions in tumorigenesis and embryonic development. Oncogene. 2008;27:1079–1086. doi: 10.1038/sj.onc.1210730. [DOI] [PubMed] [Google Scholar]
- 16.Peterson RT, Link BA, Dowling JE, Schreiber SL. Small molecule developmental screens reveal the logic and timing of vertebrate development. Proc Natl Acad Sci U S A. 2000;97:12965–12969. doi: 10.1073/pnas.97.24.12965. [DOI] [PMC free article] [PubMed] [Google Scholar]
- 17.Flicek P, Aken BL, Ballester B, Beal K, Bragin E, et al. Ensembl's 10th year. Nucleic Acids Res. 2010;38:D557–562. doi: 10.1093/nar/gkp972. [DOI] [PMC free article] [PubMed] [Google Scholar]
- 18.van der Sar A, Betist M, de Fockert J, Overvoorde J, Zivkovic D, et al. Expression of receptor protein-tyrosine phosphatase alpha, sigma and LAR during development of the zebrafish embryo. MechDev. 2001;109:423–426. doi: 10.1016/s0925-4773(01)00545-7. [DOI] [PubMed] [Google Scholar]
- 19.van Eekelen M, Runtuwene V, Overvoorde J, den Hertog J. RPTPalpha and PTPepsilon signaling via Fyn/Yes and RhoA is essential for zebrafish convergence and extension cell movements during gastrulation. Dev Biol. 2010 doi: 10.1016/j.ydbio.2010.02.026. [DOI] [PubMed] [Google Scholar]
- 20.Aerne B, Ish-Horowicz D. Receptor tyrosine phosphatase psi is required for Delta/Notch signalling and cyclic gene expression in the presomitic mesoderm. Development. 2004;131:3391–3399. doi: 10.1242/dev.01222. [DOI] [PubMed] [Google Scholar]
- 21.Jopling C, van Geemen D, den Hertog J. Shp2 knockdown and Noonan/LEOPARD mutant Shp2-induced gastrulation defects. PLoS Genet. 2007;3:e225. doi: 10.1371/journal.pgen.0030225. [DOI] [PMC free article] [PubMed] [Google Scholar]
- 22.Wyatt L, Wadham C, Crocker LA, Lardelli M, Khew-Goodall Y. The protein tyrosine phosphatase Pez regulates TGFbeta, epithelial-mesenchymal transition, and organ development. J Cell Biol. 2007;178:1223–1235. doi: 10.1083/jcb.200705035. [DOI] [PMC free article] [PubMed] [Google Scholar]
- 23.Andersen JN, Jansen PG, Echwald SM, Mortensen OH, Fukada T, et al. A genomic perspective on protein tyrosine phosphatases: gene structure, pseudogenes, and genetic disease linkage. FASEB J. 2004;18:8–30. doi: 10.1096/fj.02-1212rev. [DOI] [PubMed] [Google Scholar]
- 24.Gingras MC, Zhang YL, Kharitidi D, Barr AJ, Knapp S, et al. HD-PTP is a catalytically inactive tyrosine phosphatase due to a conserved divergence in its phosphatase domain. PLoS One. 2009;4:e5105. doi: 10.1371/journal.pone.0005105. [DOI] [PMC free article] [PubMed] [Google Scholar]
- 25.Cao L, Zhang L, Ruiz-Lozano P, Yang Q, Chien KR, et al. A novel putative protein-tyrosine phosphatase contains a BRO1-like domain and suppresses Ha-ras-mediated transformation. J Biol Chem. 1998;273:21077–21083. doi: 10.1074/jbc.273.33.21077. [DOI] [PubMed] [Google Scholar]
- 26.Whited JL, Robichaux MB, Yang JC, Garrity PA. Ptpmeg is required for the proper establishment and maintenance of axon projections in the central brain of Drosophila. Development. 2007;134:43–53. doi: 10.1242/dev.02718. [DOI] [PubMed] [Google Scholar]
- 27.Saito K, Williams S, Bulankina A, Honing S, Mustelin T. Association of protein-tyrosine phosphatase MEG2 via its Sec14p homology domain with vesicle-trafficking proteins. J Biol Chem. 2007;282:15170–15178. doi: 10.1074/jbc.M608682200. [DOI] [PubMed] [Google Scholar]
- 28.Wang Y, Vachon E, Zhang J, Cherepanov V, Kruger J, et al. Tyrosine phosphatase MEG2 modulates murine development and platelet and lymphocyte activation through secretory vesicle function. J Exp Med. 2005;202:1587–1597. doi: 10.1084/jem.20051108. [DOI] [PMC free article] [PubMed] [Google Scholar]
- 29.Cho CY, Koo SH, Wang Y, Callaway S, Hedrick S, et al. Identification of the tyrosine phosphatase PTP-MEG2 as an antagonist of hepatic insulin signaling. Cell Metab. 2006;3:367–378. doi: 10.1016/j.cmet.2006.03.006. [DOI] [PubMed] [Google Scholar]
- 30.Tamura H, Fukada M, Fujikawa A, Noda M. Protein tyrosine phosphatase receptor type Z is involved in hippocampus-dependent memory formation through dephosphorylation at Y1105 on p190 RhoGAP. Neurosci Lett. 2006;399:33–38. doi: 10.1016/j.neulet.2006.01.045. [DOI] [PubMed] [Google Scholar]
- 31.Dunah AW, Hueske E, Wyszynski M, Hoogenraad CC, Jaworski J, et al. LAR receptor protein tyrosine phosphatases in the development and maintenance of excitatory synapses. Nat Neurosci. 2005;8:458–467. doi: 10.1038/nn1416. [DOI] [PubMed] [Google Scholar]
- 32.Cai T, Krause MW, Odenwald WF, Toyama R, Notkins AL. The IA-2 gene family: homologs in Caenorhabditis elegans, Drosophila and zebrafish. Diabetologia. 2001;44:81–88. doi: 10.1007/s001250051583. [DOI] [PubMed] [Google Scholar]
- 33.Zahn TR, Macmorris MA, Dong W, Day R, Hutton JC. IDA-1, a Caenorhabditis elegans homolog of the diabetic autoantigens IA-2 and phogrin, is expressed in peptidergic neurons in the worm. J Comp Neurol. 2001;429:127–143. doi: 10.1002/1096-9861(20000101)429:1<127::aid-cne10>3.0.co;2-h. [DOI] [PubMed] [Google Scholar]
- 34.Chiusaroli R, Knobler H, Luxenburg C, Sanjay A, Granot-Attas S, et al. Tyrosine phosphatase epsilon is a positive regulator of osteoclast function in vitro and in vivo. Mol Biol Cell. 2004;15:234–244. doi: 10.1091/mbc.E03-04-0207. [DOI] [PMC free article] [PubMed] [Google Scholar]
- 35.Force A, Lynch M, Pickett FB, Amores A, Yan YL, et al. Preservation of duplicate genes by complementary, degenerative mutations. Genetics. 1999;151:1531–1545. doi: 10.1093/genetics/151.4.1531. [DOI] [PMC free article] [PubMed] [Google Scholar]
- 36.Jaillon O, Aury JM, Brunet F, Petit JL, Stange-Thomann N, et al. Genome duplication in the teleost fish Tetraodon nigroviridis reveals the early vertebrate proto-karyotype. Nature. 2004;431:946–957. doi: 10.1038/nature03025. [DOI] [PubMed] [Google Scholar]
- 37.Vandepoele K, De Vos W, Taylor JS, Meyer A, Van de Peer Y. Major events in the genome evolution of vertebrates: paranome age and size differ considerably between ray-finned fishes and land vertebrates. Proc Natl Acad Sci U S A. 2004;101:1638–1643. doi: 10.1073/pnas.0307968100. [DOI] [PMC free article] [PubMed] [Google Scholar]
- 38.Tamura K, Dudley J, Nei M, Kumar S. MEGA4: Molecular Evolutionary Genetics Analysis (MEGA) software version 4.0. Mol Biol Evol. 2007;24:1596–1599. doi: 10.1093/molbev/msm092. [DOI] [PubMed] [Google Scholar]
- 39.Westerfield M. The Zebrafish Book. Eugene, , Oregon: University of Oregon Press; 1995. [Google Scholar]
Associated Data
This section collects any data citations, data availability statements, or supplementary materials included in this article.
Supplementary Materials
Oligos used for probe generation and sequencing. Listed are all oligos used for the generation of in situ probes and to sequence cDNA. Oligo 1 and 4 serve as forward and reverse primer, respectively. Oligos 2 and 3 are nested forward and reverse primers. Oligo 3 contains a T7 tag, which facilitates generation of antisense probes. All probes were designed to span approximately 800 bp of known coding sequence. n.d., not done.
(0.07 MB DOC)


