Abstract
Purpose: To investigate the effect of the bronchial tree on the accuracy of biomechanical-based deformable image registration of human lungs.
Methods: Three dimensional finite element models have been developed using four dimensional computed tomography image data of ten lung cancer patients. Each model is built of a body, left and right lungs, tumor, and bronchial trees. Triangular shell elements are used for the bronchial trees while tetrahedral elements are used for other components. Hyperelastic material properties based on experimental investigation on human lungs are used for the lung parenchyma. Different material properties are assigned for the bronchial tree using five values for the modulus of elasticity of 0.01, 0.12, 0.5, 10, and 18 MPa. Lungs are modeled to slide inside chest cavities by applying frictionless contact surfaces between each lung and corresponding chest cavity. The accuracy of the models is examined using an average of 40 bronchial bifurcation points identified on inhale and exhale images. Relative accuracy is evaluated by comparing the displacement of all nodes within the lungs as well as the dosimetric difference at the exhale position predicted by the model.
Results: There is no significant effect of bronchial tree on the model accuracy based on the bifurcation points analysis. However, on the local level, using an average of 38 000 nodes, there is a maximum difference of 8.5 mm in the deformation of the bronchial trees, as the modulus of elasticity of the bronchial trees increases from 0.01 to 18 MPa; however, more than 96% of nodes are within a 2.5 mm difference in each direction. The average dose difference at the predicted exhale position is less than 35 cGy between the models.
Conclusions: The bronchial tree has little effect on the global deformation and the accuracy of deformable image registration of lungs. Hence, the homogenous model is a reasonable assumption. Since there are some local deformation differences between nodes as the material properties of the bronchial tree change that may affect the accuracy of dosimetric results, heterogeneity may be required for a smaller scale modeling of lungs.
Keywords: bronchial tree, contact surfaces, FEM, heterogeneity, hyperelasticity, lungs
INTRODUCTION
The advancement of radiation therapy techniques such as SBRT and IMRT requires a precise location of the target while sparing the healthy tissues and avoiding organs at risk. Image guided radiotherapy (IGRT) has addressed this requirement by aligning the patient in each treatment session. An essential part of the IGRT technique is image registration. There are two types of image registration, namely, rigid and deformable. Rigid registration may be sufficient for organs experiencing little deformation such as the brain. However, it is not suitable for organs with large deformation, such as lungs.
A number of deformable image registration techniques have been used including intensity-based and biomechanical models. Although intensity-based models such as B-spline,1 thin plate spline,2 and demons3, 4, 5 have accurately modeled the breathing motion of lungs, registration errors “are prone to appear in regions with low image gradients” as shown by Zhong et al.6 in addition to the changing image intensity caused by blood circulation variation as a result of breathing motion.7 These points can be addressed using finite element models,6 which “allow more principled control of localized deformations.”8
Different finite element models have been developed to investigate the effect of lung weight,9 material properties,10, 11, 12 and boundary conditions.13, 14, 15 These studies modeled the lung as a homogeneous material. The lung parenchyma contains branching tubes of the bronchial tree that have different material properties from the rest of the tissues.16 As one of the main parts of the lung, bronchial tree geometry and biomechanical properties may affect the deformation of the lung.
Tai and Lee17 conducted an experimental study on the effect of heterogeneity and isotropy on the lung deformation. Samples were taken from different locations, some of which included large airways in the middle of the parenchyma. It was found that the mean deformation is not affected by the large airway.
Lai-Fook and Kallok18 studied the interaction between the bronchus, artery, and parenchyma at the local level using a 2D finite element model with the bronchus adjoining the artery. The airway and its location have a pronounced effect on the deformation of the surrounding tissues. Also, the shape of bronchial tree affects the airway flow resistances. This effect is large in the central airway.
This study investigates the effect of heterogeneity on the deformation of the lungs by including the bronchial tree. Unlike previous studies,17, 18 the complete lung is examined in order to reach a realistic model that simulates lung’s geometry, material properties, and its interaction with surrounding tissues. The lung parenchyma is modeled using hyperelastic material properties based on experimental results.19 The lungs are allowed to slide relative to the chest cavities using frictionless contact surface. Frictionless surface is proved to be effective in improving the accuracy of the lungs’ model based on a previous investigation conducted by the authors.11 This model will facilitate further investigation of the effect of diseases, radiation toxicity, and compli-cations. Comparisons between the different material models are evaluated using (1) the accuracy of the deformable registration based on bifurcation points, (2) a relative comparison of each model using all bronchial tree nodes in the model, and (3) a dosimetric comparison comparing the dose calculated to the predicted exhale position for each model. The purpose of the relative comparison is to ensure that the limited number of bifurcation points is not influencing the outcome of the evaluation (using bronchial tree nodes in the model simulates having an anatomical point at each position; however, this is only a relative comparison, as the “truth” is not available for each point). The purpose of the dosimetric comparison is to evaluate the clinical impact of the discrepancies from the different modeling techniques. The deformation algorithm deforms the inhale position to the exhale position; therefore, the dose that would be delivered to each predicted exhale position is compared. This is also a relative comparison, as the truth is unknown for each position.
MODEL DESCRIPTION AND MATERIALS
General
Ten nonsmall cell lung cancer patients are investigated in this study. Patients’ details are listed in Table 1 including the tumor size and location, diaphragm motion during normal breathing, volume change between inhale and exhale, volume percentage of the segmented bronchi, and comorbidities. Using four dimensional computed tomography (4DCT) data of ten lung cancer patients, three dimensional (3D) finite element models have been developed. Each model consists of a body, both lungs, bronchial tree of each lung, and tumor. In the literature, a number of techniques have been used to segment the bronchial tree, namely, knowledge based, region growing, centerline extraction, and mathematical morphology, as classified by Sluimer et al.,20 where an extensive review is provided. For the purpose of this preliminary study, the bronchial tree is constructed by setting a contrast threshold on the 4DCT images with a value ranging from −700 to −600 HU. Three nodes surface shell elements are used for the bronchial tree with an average surface area of 1.5 mm2. Volumetric four nodes tetrahedral elements are used for the body, lungs, and tumor.
Table 1.
Patients’ data including tumor location and size, diaphragm breathing motion in the SI direction, volume change between inhale and exhale, bronchial volume percentage to lung volume, and comorbid illness.
| Patient | Tumor | Breathing | Bronchi (vol %) | Comorbid illnessa | ||
|---|---|---|---|---|---|---|
| Location | Size (cm3) | Motion (mm) | Volume change (%) | |||
| P1 | LLL | 2.63 | 12.5 | 6 | 4 | AtrialFib, PMR, hyperthyroidism |
| P2 | RML | 21.51 | 12.5 | 5 | 3 | CHF, MI, Colon cancer |
| P3 | RML | 4.14 | 10.0 | 6 | 2 | Asthma, tonsillar and H∕N cancer |
| P4 | RUL | 2.83 | 10.0 | 10 | 5 | COPD |
| P5 | RUL | 0.67 | 12.5 | 11 | 3 | Breast and Colon Cancer |
| P6 | LLL | 1.57 | 12.5 | 8 | 5 | COPD, psoriasis |
| P7 | RLL | 4.63 | 7.5 | 13 | 6 | N∕A |
| P8 | LUL | 0.08 | 2.5 | 1 | 6 | CHF, MI, COPD, HTN, PVD |
| P9 | RUL | 59.33 | 20 | 9 | 3 | None |
| P10 | LUL | 2.05 | 5.0 | 6 | 5 | COPD, CHF, MI, PMR |
CHF: Congestive heart failure, COPD: Chronic obstructive pulmonary disease, HTN: Hypertension, MI: Myocardial infarction (heart attack), PMR: Polymyalgia rheumatica, and PVD: Peripheral vascular disease.
Model development
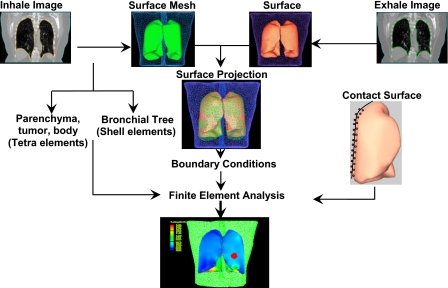
The model is created by contouring lungs, body, and tumor using the 4DCT images. A surface mesh is created for each component at both the inhale and exhale phases, as shown in Fig. 1.21 Using a finite element preprocessor (HYPERMESH, Altair Engineering, Troy, MI,) the bronchial tree is created by including its surface mesh inside the lung surface mesh. The volume of the lung outside the bronchial tree, in addition to the body and tumor, is tetrameshed, leaving the bronchial tree as a shell structure interconnected to the lungs parenchyma.
Figure 1.
Model development starts by acquiring CT images for both exhale and inhale phases. 3D surface meshes are created and used for the projection of the inhale and exhale surfaces to find the boundary conditions. The inhale surface mesh of all components, except the bronchial tree, is tetrameshed, leaving the bronchial trees as shell structures. After applying contact surface on the lungs, finite element analysis are conducted.
A surface based contact model is then applied to each lung by selecting the face of each tetrahedral element on the external boundary of the lung using a finite element package (ABAQUS, v 6.8, Providence, RI). Similarly, the surface of the tetrahedral elements that create the chest cavity representing the internal surface of the body is selected. This procedure is performed for each lung and its corresponding cavity. A value of zero friction is assigned for the lung-chest cavity interface to simulate the lubrication of the pleural liquid.11
Boundary conditions
The inhale phase of the body and lungs is used as the initial representation at time zero of the simulation. The exhale position is considered the final position of the deformation onto which the lungs and body are deformed from the inhale position. In other words, the boundary conditions applied in the model are the location differences between the inhale and exhale positions of surface nodes of the lungs and body. These differences are found using the surface projection technique HYPERMORPH (Altair Engineering, Troy, MI). The boundary conditions can be divided into two groups, namely, external and internal. The external boundary condition is the set of displacements derived from the projection of the body external surface between inhale and exhale positions. The internal set is the displacement applied to the nodes of chest cavities in direct contact with lungs. Since a contact surface is applied between the chest cavity and the lung, the boundary conditions are applied indirectly to the lung surface in a form of contact pressure through the surrounding nodes of the chest cavities. In order to simulate this contact pressure on the lungs and avoid any separation between contacting surfaces, the inhale breathing phase is used as a primary state subjected to contact pressure that compresses it to the smaller volume at the exhale phase.
Material properties
Hyperelastic material properties of the lung parenchyma are applied using experimental test data reported by Zeng et al.19 A nearly incompressible parenchyma is also characterized by a Poisson’s ratio of 0.4 that provides a minimum registration error based on previous study conducted by the authors.11 The body is modeled as linear elastic with a modulus of elasticity of 6.0 kPa and Poisson’s ratio of 0.4.
Different values of modulus of elasticity of the airway have been reported in the literature including 0.01, 0.12,16, 18 0.13,22 and 5.8 MPa.23 Experimental studies on the bronchial trees that relate the wall thickness to diameter23 and pressure-diameter relationship25 of human airways have shown a value of modulus of elasticity within the proximity of 0.12 MPa at a transpulmonary pressure of 20 cmH2O. The highest value of modulus of elasticity of 18 MPa is reported for tracheal rings.26 In order to find the effect of mechanical properties of the bronchial tree, different values of modulus of elasticity are investigated in this study including 0.01, 0.12, 0.5, 10, and 18 MPa.
Model accuracy
An average of 40 landmarks in the form of bifurcation points are used for the accuracy check of each model. Previously, intraobserver study was conducted at the institute where the observer was asked to identify the bifurcation points once a week over a period of 4 weeks. The average error was less than 1.0 mm in all directions.21
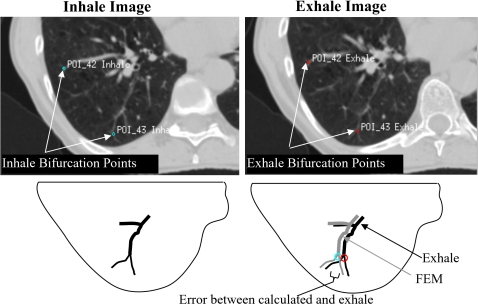
The coordinates of each bifurcation point are located in the inhale image. The same anatomical point is also located in the exhale image, as illustrated in Fig. 2. The difference between the coordinates of the point on the inhale and exhale images represents the image-based displacement. The same procedure is conducted with each bifurcation point using the finite element model where the displacement of each point is calculated by finding the difference in location of the point between original and deformed positions. The registration error is the difference between the image-based and finite element displacements. Average absolute errors in the LR, AP, and SI directions are reported in this study.
Figure 2.
Bifurcation points in inhale and exhale images. The error in the location of bifurcation points represents the difference in location between the estimated FEM location and the image-based location in the exhale breathing phase.
The bifurcation point distribution inside the lung plays an important role on their validity in representing the lung deformation. Specifically, the registration errors tend to be small near the boundary.27 Furthermore, since sliding of the lungs relative to the chest cavity is modeled, the location of these points relative to the sliding interface becomes essential. Therefore, the distance between each point and the edge of the lung in contact with the chest cavity is calculated, as listed in Table 2. It is shown that few points (an average percentage of 9.7%) are located within the 5 mm distance from the edge and increases to 51.9% as the distance increases to 15 mm.
Table 2.
Bifurcation points distribution relative to their position to the lungs’ edge and bronchial tree represented by the average distance and the percentage of points within a distance of 5, 10, and 15 mm from the lungs’ edge and bronchial tree surface.
| Patient | Point location relative to lungs’ edge | Point location relative to bronchial tree | ||||||
|---|---|---|---|---|---|---|---|---|
| Average minimum distance (max) (mm) | <5 mm (%) | <10 mm (%) | <15 mm (%) | Average minimum distance (max) (mm) | <5 mm (%) | <10 mm (%) | <15 mm (%) | |
| P1 | 17.4 (36.4) | 4.7 | 16.3 | 41.7 | 4.4 (26.7) | 65.1 | 86.1 | 95.4 |
| P2 | 14.9 (28.7) | 7.0 | 24.6 | 50.9 | 3.4 (13.6) | 71.9 | 86.0 | 100 |
| P3 | 16.6 (29) | 0.0 | 9.3 | 44.2 | 7.6 (22.1) | 34.9 | 67.4 | 93 |
| P4 | 15.7 (39.4) | 2.2 | 24.4 | 57.8 | 3.4 (37) | 80 | 91.1 | 95.6 |
| P5 | 16.5 (30.5) | 0 | 16.7 | 45.2 | 4.4 (18.2) | 64.3 | 78.6 | 97.6 |
| P6 | 19 (37.7) | 0 | 10.8 | 40.5 | 1.8 (13.2) | 89.2 | 97.3 | 100 |
| P7 | 17.3 (29) | 0 | 4.7 | 41.9 | 1.0 (5.7) | 97.7 | 100 | 100 |
| P8 | 17.7 (28) | 0 | 5.6 | 38.9 | 3.4 (18.9) | 77.8 | 83.3 | 94.4 |
| P9 | 16 (41.2) | 0 | 19.7 | 57.7 | 5.5 (24.5) | 49.3 | 84.5 | 94.4 |
| P10 | 18.7 (33.8) | 83.3 | 81.0 | 100 | 2.5 (11.2) | 83.3 | 94.4 | 100 |
| Average | 17.0 (30.2) | 9.7 | 21.3 | 51.9 | 3.7 (19.1) | 71.4 | 86.9 | 97.0 |
As part of the bronchial tree, the distribution of the bifurcation points around the bronchial tree can provide a rough estimation of the performance of the segmentation of the tree (Table 2) where smaller airways may not be included by the threshold segmentation. It can be concluded that a significant number of bifurcation points (an average of 71.4% of points) are within the 5 mm distance from the bronchial tree and 97% of the points are within a distance of 15 mm from the tree.
Dose calculations
The clinical impact of the variation in displacement based on the material properties of the bronchial tree is evaluated by comparing the dose that would be delivered at the predicated exhale position using each deformation map (from each of the material properties tested). As this is a relative comparison, since the truth at the exhale position of the model is not known, one of the parameters must be chosen as a reference with which to compare the other values. A value of 0.12 MPa is chosen as the reference, as it represents the most reported value within the literature. The dose calculations are conducted using a commercially available planning system (Pinnacle3 v6.2–8.1, Philips Medical Systems, Madison, WI) with a grid resolution of 2.5×2.5×2.5 mm3. The bronchial tree nodes and their deformation from inhale to exhale are interpolated onto the exhale dose grid from Pinnacle to obtain the dose at the predicted exhale position. Details of dose calculations using deformable model are presented elsewhere.28
RESULTS
Bifurcation analysis
Using bifurcation points, the accuracy of each model is examined. The average absolute error of displacement is found for each patient in LR, AP, and SI directions, in addition to the vector value, as listed in Table 3. Heterogeneous models with different modulus of elasticity of the bronchial tree (Eb) of 0.01, 0.12, 0.5, 10, and 18 MPa are used in the analysis and compared to the homogeneous model. It is interesting to note that no significant difference is found between the errors using homogenous and heterogeneous models in all directions. The t-test shows an average p value of 0.39 with a minimum value of 0.08 found in two cases. This is in an agreement with the experimental findings of Tai and Lee,17 where mean deformation is not affected by including an airway in the sample of the lung. The average vector value of the error in the homogeneous and the model with bronchial tree with stiffness of 0.01, 0.1, and 0.5 MPa is around 2.66 mm and increased to 2.83 mm for bronchial tree with 18 MPa. This is within the range of accuracy error of 3.3±2.1 mm reported by Werner et al.15 using homogeneous biomechanical modeling of the lungs.
Table 3.
Average absolute bifurcation error in LR, AP, SI, and vector values with different elastic moduli of bronchial tree (Eb) and homogeneous lungs (dimensions in mm).
| Patient | Average absolute error (mm) ±SD | |||||
|---|---|---|---|---|---|---|
| Homogeneous | Eb=0.01 MPa | Eb=0.12 MPa | Eb=0.5 MPa | Eb=10 MPa | Eb=18 MPa | |
| LR direction | ||||||
| P1 | 0.8±0.7 | 0.8±0.7 | 0.8±0.7 | 0.8±0.7 | 0.8±0.7 | 0.8±0.7 |
| P2 | 0.8±0.6 | 0.9±0.7 | 0.9±0.7 | 0.9±0.7 | 0.8±0.7 | 0.8±0.7 |
| P3 | 0.5±0.4 | 0.5±0.4 | 0.5±0.4 | 0.5±0.4 | 0.6±0.5 | 0.6±0.5 |
| P4 | 0.7±0.6 | 0.7±0.6 | 0.6±0.5 | 0.7±0.5 | 0.7±0.6 | 0.7±0.6 |
| P5 | 0.9±0.9 | 0.9±0.9 | 0.9±0.9 | 0.8±0.9 | 0.9±0.9 | 0.9±0.9 |
| P6 | 1.3±1.1 | 1.4±1.1 | 1.4±1.1 | 1.2±1.1 | 1.4±1.2 | 1.4±1.2 |
| P7 | 1.0±0.7 | 0.8±0.6 | 0.8±0.5 | 0.8±0.5 | 0.9±0.6 | 0.9±0.6 |
| P8 | 0.9±0.6 | 1.0±0.7 | 1.0±0.6 | 1.0±0.7 | 1.0±0.7 | 1.0±0.7 |
| P9 | 0.9±0.7 | 1.0±0.7 | 1.0±0.7 | 1.1±0.7 | 1.3±0.9 | 1.3±0.9 |
| P10 | 0.8±0.6 | 0.8±0.6 | 0.8±0.6 | 0.8±0.6 | 0.8±0.6 | 0.8±0.7 |
| AP direction | ||||||
| P1 | 1.1±0.9 | 1.1±0.9 | 1.1±0.9 | 1.1±0.9 | 1.2±1.0 | 1.2±1.0 |
| P2 | 0.9±0.6 | 0.8±0.7 | 0.8±0.7 | 0.9±0.8 | 1.1±0.8 | 1.1±0.8 |
| P3 | 0.7±0.8 | 0.9±0.8 | 0.9±0.8 | 0.7±0.8 | 0.9±0.9 | 0.9±0.9 |
| P4 | 1.2±1.0 | 1.4±1.0 | 1.3±1.0 | 1.2±0.9 | 1.2±1.0 | 1.3±1.0 |
| P5 | 1.8±1.8 | 1.7±1.6 | 1.8±1.8 | 1.8±1.9 | 1.7±1.9 | 1.7±1.9 |
| P6 | 2.0±1.7 | 2.0±1.6 | 2.0±1.6 | 1.9±1.5 | 1.9±1.4 | 1.9±1.4 |
| P7 | 0.9±0.5 | 1.0±0.8 | 1.0±0.7 | 0.9±0.7 | 0.9±0.7 | 0.9±0.8 |
| P8 | 1.9±1.6 | 1.8±1.5 | 1.8±1.5 | 1.8±1.4 | 1.7±1.3 | 1.7±1.3 |
| P9 | 0.8±0.8 | 0.9±0.8 | 0.8±0.8 | 0.8±0.8 | 1.1±0.9 | 1.1±0.9 |
| P10 | 1.0±0.6 | 1.1±0.6 | 1.0±0.6 | 1.0±0.6 | 1.0±0.7 | 1.0±0.7 |
| SI direction | ||||||
| P1 | 2.2±2.9 | 2.2±2.9 | 2.2±2.9 | 2.2±2.9 | 2.2±2.9 | 2.2±2.9 |
| P2 | 2.1±1.5 | 2.3±1.6 | 2.2±1.6 | 2.1±1.6 | 2.1±1.6 | 2.1±1.5 |
| P3 | 0.9±0.8 | 0.9±0.9 | 0.9±0.9 | 0.9±0.9 | 0.9±0.9 | 0.9±0.8 |
| P4 | 1.3±0.9 | 1.5±1.0 | 1.4±1.0 | 1.3±0.9 | 1.2±0.9 | 1.2±0.9 |
| P5 | 2.1±1.7 | 2.1±1.7 | 2.1±1.7 | 2.1±1.7 | 2.3±1.9 | 2.4±1.9 |
| P6 | 2.3±2.0 | 2.3±2.1 | 2.3±2.1 | 3.3±2.5 | 3.5±2.6 | 3.5±2.6 |
| P7 | 1.6±1.3 | 1.4±1.4 | 1.5±1.2 | 1.6±1.4 | 1.7±1.6 | 1.9±1.7 |
| P8 | 2.2±1.9 | 1.9±1.7 | 1.9±1.7 | 1.8±1.7 | 1.7±1.6 | 1.7±1.6 |
| P9 | 2.0±2.0 | 2.1±2.1 | 2.1±2.0 | 2.1±2.0 | 2.2±1.8 | 2.3±1.8 |
| P10 | 1.0±0.7 | 0.9±0.7 | 1.0±0.7 | 1.1±0.8 | 1.3±0.8 | 1.3±0.8 |
| Vector value | ||||||
| P1 | 2.8±2.9 | 2.8±2.9 | 2.8±2.9 | 2.8±2.9 | 2.8±3.0 | 2.9±3.0 |
| P2 | 2.7±1.3 | 2.8±1.5 | 2.8±1.5 | 2.7±1.4 | 2.8±1.4 | 2.8±1.4 |
| P3 | 1.6±1.0 | 1.6±1.0 | 1.6±1.0 | 1.6±1.0 | 1.7±1.0 | 1.7±1.0 |
| P4 | 2.2±0.9 | 2.4±0.9 | 2.3±0.9 | 2.2±0.9 | 2.3±0.9 | 2.3±0.9 |
| P5 | 3.3±2.1 | 3.2±2.1 | 3.3±2.1 | 3.3±2.1 | 3.5±2.1 | 3.6±2.2 |
| P6 | 3.8±2.2 | 3.8±2.2 | 3.9±2.2 | 4.3±2.6 | 4.6±2.6 | 4.6±2.5 |
| P7 | 2.3±1.1 | 2.2±1.1 | 2.2±1.1 | 2.2±1.1 | 2.2±1.1 | 2.2±1.0 |
| P8 | 3.4±2.1 | 3.1±2.0 | 3.1±1.9 | 3.1±1.8 | 2.9±1.7 | 2.9±1.7 |
| P9 | 2.7±1.9 | 2.8±1.9 | 2.8±1.9 | 2.8±1.9 | 3.1±1.7 | 3.2±1.7 |
| P10 | 1.8±0.8 | 1.8±0.8 | 1.8±0.8 | 1.8±0.9 | 2.0±0.9 | 2.1±0.9 |
The effect of changing the modulus of elasticity of the bronchial tree on the bifurcation error is also negligible with the largest difference of 1 mm in patient P6 in the SI direction as the stiffness increases from 0.12 to 0.5 MPa and higher. This is likely related to the lower role of mechanical properties of the bronchial tree on the deformation in comparison to the role of bronchial geometry.29
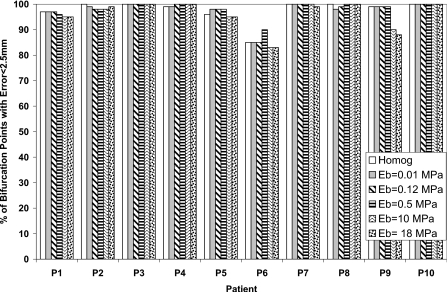
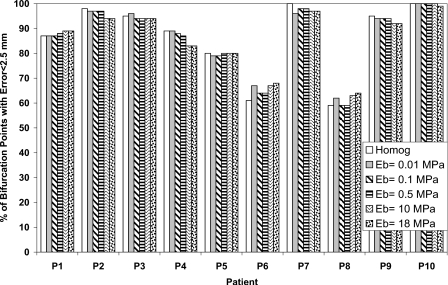
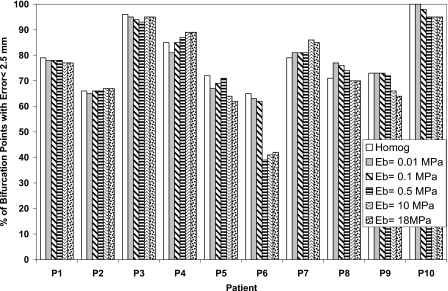
The percentage of bifurcation points with an absolute registration error less than the dose grid of 2.5 mm for each patient is also calculated in order to find the potential of including the bronchial tree in reducing the registration error as shown in Figs. 345 in the LR, AP, and SI directions, respectively. There is no significant difference between the homogenous and heterogeneous models. This is an indication that the accuracy of the model using the bifurcation points has not been affected by including the bronchial tree in the model.
Figure 3.
The percentage of bifurcation points with absolute registration error less than 2.5 mm in the LR direction using different elastic modulus of the bronchial tree (Eb) and compared to the homogeneous model.
Figure 4.
The percentage of bifurcation points with absolute registration error less than 2.5 mm in the AP direction using different elastic modulus of the bronchial tree (Eb) and compared to the homogeneous model.
Figure 5.
The percentage of bifurcation points with absolute registration error less than 2.5 mm in the SI direction using different elastic modulus of the bronchial tree (Eb) and compared to the homogeneous model.
Effect of modulus of elasticity on local deformation
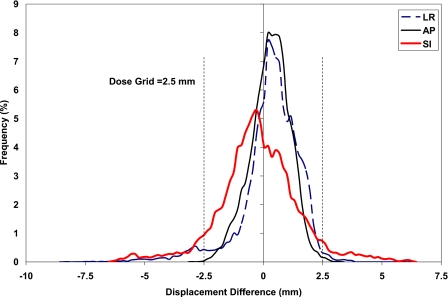
For a clear illustration of the effect of Eb, the extreme Eb values of 0.01 and 18 MPa are applied to find the displacement difference between nodes of the bronchial tree as shown in Fig. 6, where the histogram of the displacement difference is illustrated for patient P5. Although there is a large displacement difference as much as 8.5 mm in a few nodes in the LR direction, most of the bronchial nodes experience an insignificant displacement difference. In a percentage form for patient P5, 95.2%, 99.9%, and 89.3% of the bronchial nodes have a displacement difference within the dimension of the dose grid, 2.5 mm, in the LR, AP, and SI directions, respectively. Similarly, considering all patients, the average percentage of nodes of the ten patients with displacement differences within the grid size are 98.5±2.1, 99.3±0.9, and 96.1±3.6 in the LR, AP, and SI directions, respectively.
Figure 6.
Histogram of displacement difference between bronchial tree with modulus of elasticity of 18 and 0.01 MPa in the LR, AP, and SI directions.
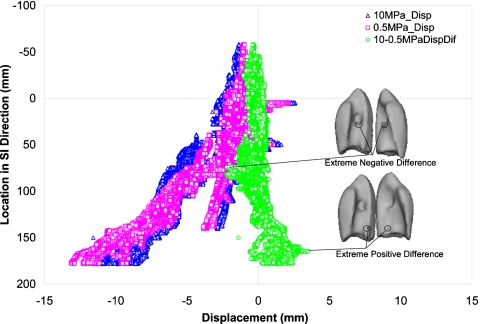
At the local level, the displacement of all nodes of the bronchial tree is examined in all three directions using different values of modulus of elasticity of the bronchial tree (Eb). The displacement of the bronchial tree nodes with different modulus of elasticity (Eb) of 0.5 and 10 MPa in the SI direction is shown in Fig. 7 for patient P9 where the largest diaphragm motion is experienced. The displacement differences and the locations of minimum and maximum differences are also illustrated in the figure. As expected, the largest displacement is in the bronchial tree near the diaphragm which is corresponding to the largest deformation experienced by the lung. This displacement decreases near the top of the lung. Similarly, the displacement difference is more pronounced in the part of the lung near the diaphragm. The extreme positive differences are in the area near the diaphragm. Few nodes experience negative differences at the entrance of the bronchi into the lung, although the average difference at this specific location is near zero. This is likely related to the deformation of the large tube in the radial direction at the entrance while the smaller tubes near the diaphragm experience more of translation movement than deformation.
Figure 7.
Displacement of the bronchial tree in the SI direction relative to its position in the SI direction using modulus of elasticity of the bronchial tree Eb tree of 0.5 and 10 MPa, in addition to the displacement difference using these two moduli.
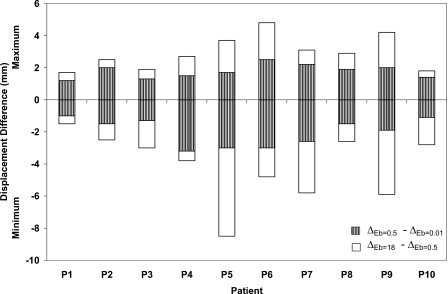
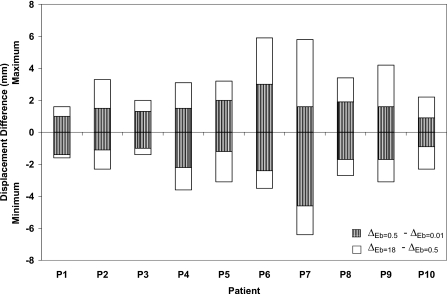
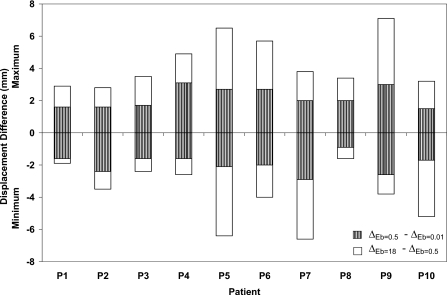
To further investigate the effect of the material properties of the bronchial tree on the deformation at the local level, the maximum and minimum differences in displacement in the LR, AP, and SI directions for all patients are illustrated in Figs. 8910, respectively. The displacement difference (Δ) is found by subtracting the displacement of the bronchial nodes with Eb of 0.01 MPa (ΔEb=0.01) from that of the same nodes using Eb of 0.5 MPa (ΔEb=0.5) and by subtracting ΔEb=0.5 from ΔEb=18.
Figure 8.
Minimum and maximum displacement differences in the LR direction using different modulus of elasticity of the bronchial trees of 0.01, 0.5, and 18 MPa.
Figure 9.
Minimum and maximum displacement differences in the AP direction using different modulus of elasticity of the bronchial trees of 0.01, 0.5, and 18 MPa.
Figure 10.
Minimum and maximum displacement differences in the SI direction using different modulus of elasticity of the bronchial trees of 0.01, 0.5, and 18 MPa.
Patients with a minimum breathing volume change between inhale and exhale exhibit the lowest displacement differences as the stiffness changes. This is clearly observed in patients P1, P2, P3, P8, and P10 regardless of the diaphragm motion. The largest displacement difference is shown in case of P5 in the LR and SI directions where a large diaphragm motion is combined with large breathing volume change. Patient P6 exhibits uniform displacement difference in three directions despite the fact it has large diaphragm motion in the SI direction. Although, the largest diaphragm motion is experienced by patient P9, it has a displacement pattern similar to that of P6 but with a lower displacement difference. It can be concluded that the most of the extreme displacement differences (minimum and maximum) are within the proximity of 2.5 mm gird size especially for the case of Eb changing between 0.01 and 0.5 MPa. These differences increase for the case of the hard bronchi with Eb of 18 MPa. However, most of the nodes experience displacement differences within the dimension of the dose grid as reported earlier (98.5±2.1%, 99.3±0.9%, and 96.1±3.6% in the LR, AP, and SI directions, respectively).
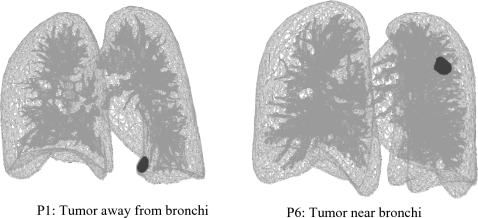
The effect of the bronchial tree stiffness on the tumor deformation is investigated in patients P1 and P6 based on its position relative to the bronchial tree. The tumor in P1 is away from the bronchi while it is surrounded by the tree in P6, as shown in Fig. 11. Patients P1 and P6 are selected for their similar breathing characteristics including the breathing motion and volume change from inhale to exhale, in addition to the similar tumor size but different tumor motion. The average displacement difference in tumor nodes is measured between the softest (Eb=0.01 MPa) and the hardest (Eb=18 MPa) bronchial tree. The average difference in P1 is 0.2, 0.2, and 0.0 mm in the LR, AP, and SI direction, respectively, with a maximum difference of 0.3 mm. As for case of P6, the average differences are −0.3, −0.5, and −0.1 mm in the LR, AP, and SI directions, respectively, with a maximum absolute difference of 0.9 mm. Therefore, the tumor surrounded by the tree is more affected by the change of bronchial material. However, the overall difference, and therefore the difference in the center of mass motion of the tumor, is very small. This is in agreement with the minor nodal displacement difference illustrated earlier.
Figure 11.
Tumor location relative to the bronchial tree.
Effect of modulus of elasticity on dose distribution
Since some local displacement differences are observed as a result of changing the modulus of elasticity of the bronchial tree, dose distribution may also be affected. Therefore, the dose delivered to the bronchial tree at the predicted exhale position for each modeled modulus of elasticity is investigated. The results are compared to the dose calculated when a modulus of elasticity of 0.12 MPa is used. The dose distribution is compared to this modulus of elasticity as it is the most reported property as indicated in Sec. 2D. The average, standard deviation, and maximum dose differences at each node within in the bronchial tree between the four moduli of elasticity and that of 0.12 MPa are listed in Table 4. The average and maximum dose differences are at the lowest level when compared to 0.01 and 0.5 MPa. The average percentages of the bronchial nodes with dose difference greater than 100 cGy, a potentially clinically significant value, are 1.9%, 1.5%, 8.3%, and 9.2% in case of Eb of 0.01, 0.5, 10, and 18 MPa, respectively. When increasing this to a 200 cGy threshold, the nodes with difference exceeding this value decreases to 0.4%, 0.2%, 3.1%, and 3.7% in case of Eb of 0.01, 0.5, 10, and 18 MPa, respectively. This is an indication that modulus of elasticity of the bronchial tree has little effect on the dose distribution for the modulus of elasticity between 0.01 and 0.5 MPa.
Table 4.
The average ±SD and maximum difference in breathing dose accumulation of the bronchial tree nodes for different moduli (Eb) compared to Eb=0.12 MPa.
| Patient | Average dose difference ±SD (max) between Eb=0.12 MPa and other Eb values (cGy) | |||||||
|---|---|---|---|---|---|---|---|---|
| Eb=0.01 MPa | Eb=0.5 MPa | Eb=10 MPa | Eb=18 MPa | |||||
| P1 | 2±12 | (292) | 1±6 | (158) | 3±14 | (280) | 3±13 | (280) |
| P2 | 19±31 | (478) | 14±27 | (455) | 43±80 | (945) | 49±89 | (980) |
| P3 | 5±12 | (135) | 4±7 | (116) | 14±32 | (411) | 16±37 | (537) |
| P4 | 7±19 | (211) | 6±16 | (251) | 19±54 | (908) | 21±57 | (921) |
| P5 | 16±33 | (293) | 13±30 | (282) | 44±105 | (974) | 50±119 | (1105) |
| P6 | 10±27 | (478) | 10±24 | (419) | 29±62 | (941) | 32±66 | (1104) |
| P7 | 24±55 | (1362) | 24±50 | (834) | 66±132 | (1839) | 72±144 | (1829) |
| P8 | 4±11 | (274) | 3±9 | (158) | 8±23 | (436) | 9±26 | (481) |
| P9 | 17±31 | (409) | 13±21 | (267) | 52±94 | (1094) | 58±107 | (1245) |
| P10 | 13±32 | (442) | 13±31 | (373) | 33±74 | (927) | 37±83 | (1035) |
| Average | 12±26 | (437) | 10±22 | (331) | 31±67 | (876) | 35±74 | (952) |
DISCUSSION
Modeling lungs as homogeneous or heterogeneous material depends on the scale of deformation. In other words, if deformation is required on the scale of alveolus, the heterogeneous model is required while the homogeneous model may be sufficient for the larger scale of deformation.16 To verify the importance of the bronchial tree on the deformation of the lung, this study is conducted using the full lung and bronchial tree instead of segments of the airway that was used by Tai and Lee17 and Lai-Fook and Kallok.18
The biomechanics and geometry of the bronchial tree have been the subjects of many research projects. These projects have investigated the bronchial tube thickness,24, 30, 31, 32, 33 material properties,25, 26, 34, 35 geometry,36 and interaction with the parenchyma.37, 38
The interdependence of the bronchial tree and lung parenchyma has attracted attention since its introduction by Mead et al.39 The main goal is to estimate the effect of the bronchial tree on the overall behavior of the lung or vice versa. Hughes et al.36 studied the relationship between the airway deformation and rest of the lung. It is reported that the airway length changed by the cube root of the lung volume. The change in length and any distortion are resisted by the parenchyma with different levels of force depending on the branching angle of the tree.40 These forces are transferred by the shear stresses at the interface between the bronchial tree and the parenchyma where the shear modulus of the parenchyma is the main factor while the Poisson’s ratio of the parenchyma has little effect.37 This gives the parenchyma a greater role than the bronchus in controlling the compliance of the intact bronchi.38
This role of parenchyma on the deformation of the bronchi may be the reason behind the conclusion made by Tai and Lee17 where the large airway has no effect on the mean deformation of the sample. A similar observation may be found in Lai-Fook and Kallok18 in the modeling of the adjoining bronchial and arterial tubes. It is reported that although the tubes are deformed, their deformation is limited within a small space, as if they are competing to occupy the same space as stated by Hogg et al.41
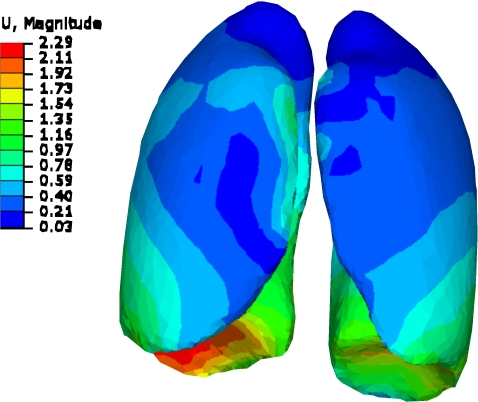
In light of these conclusions, the results of this study show no significant effect of the bronchial tree on the global deformation of the lungs, as shown in the bifurcation point analysis. This may be related to the combined effect of response of the parenchyma to applied deformation, and the bronchi geometrical configurations. The effect of parenchyma can be seen by its ability to absorb the applied displacement within a smaller distance from the diaphragm where the largest displacement is applied. This is shown in Fig. 12 for patient P9 with a large diaphragm breathing motion of 20 mm. On the other hand, the bronchi geometrical configuration, such as bifurcation, can also play a role in the deformation of the airways as mentioned by Kamm.42 In fact, the mechanics of expanding airways inside the lungs are “highly dependent on geometry” and not solely dependent on the elastic properties of the structure.29 Therefore, the bronchial material properties have little effect on the lung mechanical properties.
Figure 12.
Lung deformation from inhale to exhale for P9. The deformation is more confined to the area near diaphragm (dimensions in cm).
However, on a local level where the nodes of the elements of the bronchial tree (an average of 38 000 nodes) are considered, there is some difference in the displacement of few nodes associated with large increase of the modulus of elasticity of the tree. This can also be found in the earlier results of deformation of the bronchial tree at a very local level as indicated by Lai-Fook and Kallok.18
These local displacement differences may affect the dose distribution since few nodes experienced displacement difference larger than the dose grid of 2.5 mm. Since the percentage of these nodes with large difference is very low, the dose distribution is not affected by the modulus of elasticity of the bronchial tree.
Building on these results and experimental investigation reported in the literature, it can be concluded that the bronchial tree has little effect on the overall deformation of the lungs and, consequently, dose distribution. However, in order to minimize the local deformation differences experienced by few nodes, a realistic value of modulus of elasticity of the bronchial tree is needed. Although a large range of modulus of elasticity values are investigated in this study (0.01–18 MPa), the most reported value for the bronchial tree is within the proximity of 0.12 MPa,16, 18, 22, 24, 25 while the highest value of 18 is reported for the tracheal rings.26
CONCLUSIONS
Effect of heterogeneity of the lungs is investigated by including the bronchial tree attached to the parenchyma. The lungs, including the internal tree and tumor, are allowed to slide relative to the chest cavities by applying frictionless surfaces. The effect of modulus of elasticity of the bronchial tree on the deformation is examined using five values of modulus of elasticity: 0.01, 0.12, 0.5, 10, and 18 MPa.
Using bifurcation points for the model accuracy evaluation, the bronchial tree has no global effect on the model accuracy, regardless of the modulus of elasticity used for the bronchial tree. However, the modulus of elasticity affects the deformation of the bronchial tree on the local level which can be reflected on the dose distribution on the tree. Therefore, dose distribution is calculated using different values of modulus of elasticity.
As the most reported value of modulus of elasticity of the tree, 0.12 MPa is used to compare the dose distribution on the tree to other values modulus of elasticity of 0.01, 0.5, 10, and 18 MPa. In contrast to the tree with 10 and 18 MPa, a relatively larger dose difference is found in trees with modulus of elasticity between 0.01 and 0.5 MPa.
In general, the gross approximation of homogeneity of the lungs is sufficient for deformable image registration purpose. However, if more detailed local analysis at a smaller scale is required, the heterogeneity may play a significant role in the investigation.
ACKNOWLEDGMENTS
The authors would like to thank Andrea Bezjak, the Addie MacNaughton Chair in Thoracic Radiation Oncology, and Kevin Franks for their assistance in obtaining the patient data. This work was supported by the National Cancer Institute of Canada-Terry Fox Foundation and NIH Grant No. 1R01CA124714-01A2. Dr. Brock is supported as a Cancer Care Ontario Research Chair.
References
- McClelland J. R., Blackall J. M., Tarte S., Chandler A., Hughes S., Ahmad S., Landau D. B., and Hawkes D. J., “A continuous 4D motion model from multiple respiratory cycles for use in lung radiotherapy,” Med. Phys. 33, 3348–3358 (2006). 10.1118/1.2222079 [DOI] [PubMed] [Google Scholar]
- Coselmon M. M., Balter J. M., McShan D. L., and Kessler M. L., “Mutual information based CT registration of the lung at exhale and inhale breathing states using thin-plate splines,” Med. Phys. 31, 2942–2948 (2004). 10.1118/1.1803671 [DOI] [PubMed] [Google Scholar]
- Samant S. S., Xia J., Muyan-Ozcelik P., and Owens J. D., “High performance computing for deformable image registration: Towards a new paradigm in adaptive radiotherapy,” Med. Phys. 35, 3546–3553 (2008). 10.1118/1.2948318 [DOI] [PubMed] [Google Scholar]
- Steina D., Tetzlaff R., Wolf I., and Hans-Peter M., “Accuracy of non-rigid registration for local analysis of elasticity restrictions of the lungs,” Proc. SPIE 7261, 72611P–72619P (2009). 10.1117/12.812234 [DOI] [Google Scholar]
- Wu Z. J., Rietzel E., Boldea V., Sarrut D., and Sharp G. C., “Evaluation of deformable registration of patient lung 4DCT with sub-anatomical region segmentations,” Med. Phys. 35, 775–781 (2008). 10.1118/1.2828378 [DOI] [PubMed] [Google Scholar]
- Zhong H., Kim J., and Chetty I. J., “Analysis of deformable image registration accuracy using computational modeling,” Med. Phys. 37, 970–979 (2010). 10.1118/1.3302141 [DOI] [PMC free article] [PubMed] [Google Scholar]
- Li P., Malsch U., and Bendl R., “Combination of intensity-based image registration with 3D simulation in radiation therapy,” Phys. Med. Biol. 53, 4621–4637 (2008). 10.1088/0031-9155/53/17/011 [DOI] [PubMed] [Google Scholar]
- Crum W. R., Hartkens T., and Hill D. L. G., “Non-rigid image registration: Theory and practice,” Br. J. Radiol. 77, S140–S153 (2004). 10.1259/bjr/25329214 [DOI] [PubMed] [Google Scholar]
- Matthews F. L. and West J. B., “Finite element displacement analysis of a lung,” J. Biomech. 5, 591–600 (1972). 10.1016/0021-9290(72)90031-0 [DOI] [PubMed] [Google Scholar]
- Werner R., Ehrhardt J., Schmidt R., and Handels H., “Modeling respiratory lung motion—A biophysics approach using finite element methods,” Proc. SPIE 6916, 0N–0N11 (2008). 10.1117/12.769155 [DOI] [Google Scholar]
- Al-Mayah A., Moseley J., Velec M., and Brock K. K., “Sliding characteristic and material compressibility of human lung: Parametric study and verification,” Med. Phys. 36, 4625–4633 (2009). 10.1118/1.3218761 [DOI] [PMC free article] [PubMed] [Google Scholar]
- Villard P., Beuve M., Shariat B., Baudet V., and Jaillet F., “Simulation of lung behaviour with finite elements: Influence of bio-mechanical parameters,” in Proceedings of the Third International Conference on Medical Information Visualisation—BioMedical Visualisation, MediVi, V2005, London, United Kingdom, 5–7 July 2005. (IEEE Computer Society, London, 2005), pp. 9–14.
- Zhang T., Orton N. P., Rockwell Mackie T., and Paliwal B. R., “Technical note: A novel boundary condition using contact elements for finite element based deformable image registration,” Med. Phys. 31, 2412–2415 (2004). 10.1118/1.1774131 [DOI] [PubMed] [Google Scholar]
- Al-Mayah A., Moseley J., and Brock K. K., “Contact surface and material nonlinearity modeling of human lungs,” Phys. Med. Biol. 53, 305–317 (2008). 10.1088/0031-9155/53/1/022 [DOI] [PubMed] [Google Scholar]
- Werner R., Ehrhardt J., Schmidt R., and Handels H., “Patient-specific finite element modeling of respiratory lung motion using 4D CT image data,” Med. Phys. 36, 1500–1511 (2009). 10.1118/1.3101820 [DOI] [PubMed] [Google Scholar]
- Lai-Fook S. J., “Elasticity analysis of lung deformation,” Ann. Biomed. Eng. 9, 451–462 (1981). 10.1007/BF02364763 [DOI] [PubMed] [Google Scholar]
- Tai R. C. and Lee G. C., “Isotropy and homogeneity of lung tissue deformation,” J. Biomech. 14, 243–252 (1981). 10.1016/0021-9290(81)90069-5 [DOI] [PubMed] [Google Scholar]
- Lai-Fook S. J. and Kallok M. J., “Bronchial-arterial interdependence in isolated dog lung,” J. Appl. Physiol. 52, 1000–1007 (1982). [DOI] [PubMed] [Google Scholar]
- Zeng Y. J., Yager D., and Fung Y. C., “Measurement of the mechanical properties of the human lung tissue,” J. Biomech. Eng. 109, 169–174 (1987). 10.1115/1.3138661 [DOI] [PubMed] [Google Scholar]
- Sluimer I., Schilham A., Prokop M., and Van Ginneken B., “Computer analysis of computed tomography scans of the lung: A survey,” IEEE Trans. Med. Imaging 25, 385–405 (2006). 10.1109/TMI.2005.862753 [DOI] [PubMed] [Google Scholar]
- Brock K. K., Sharpe M. B., Dawson L. A., Kim S. M., and Jaffray D. A., “Accuracy of finite element model-based multi-organ deformable image registration,” Med. Phys. 32, 1647–1659 (2005). 10.1118/1.1915012 [DOI] [PubMed] [Google Scholar]
- Koombua K. and Pidaparti R. M., “Inhalation induced stresses and flow characteristics in human airways through fluid-structure interaction analysis,” Modeling and Simulation in Engineering, Article 358748 (2008). [Google Scholar]
- Koombua K., Pidaparti R. M., Longest P. W., and Ward K. R., “Computational analysis of flow field patterns in rigid and flexible lung airway models,” J. Crit. Care 21, 343–344 (2006). 10.1016/j.jcrc.2006.10.004 [DOI] [Google Scholar]
- Matsuoka S., Uchiyama K., Shima H., Ueno N., Oish S., and Nojiri Y., “Bronchoarterial ratio and bronchial wall thickness on high-resolution CT in asymptomatic subjects: Correlation with age and smoking,” AJR, Am. J. Roentgenol. 180, 513–518 (2003). [DOI] [PubMed] [Google Scholar]
- Prakash U. B. and Hyatt R. E., “Static mechanical properties of bronchi in normal excised human lungs,” J. Appl. Physiol. 45, 45–50 (1978). [DOI] [PubMed] [Google Scholar]
- Lambert R. K., Baile E. M., Moreno R., Bert J., and Paré P. D., “A method for estimating the Young’s modulus of complete tracheal cartilage rings,” J. Appl. Physiol. 70, 1152–1159 (1991). [DOI] [PubMed] [Google Scholar]
- Chi Y., Liang J., and Yan D., “A material sensitivity study on the accuracy of deformable organ registration using linear biomechanical models,” Med. Phys. 33, 421–433 (2006). 10.1118/1.2163838 [DOI] [PubMed] [Google Scholar]
- Brock K. K. et al. , “Inclusion of organ deformation in dose calculations,” Med. Phys. 30, 290–295 (2003). 10.1118/1.1539039 [DOI] [PubMed] [Google Scholar]
- Mead J., “Respiration: Pulmonary mechanics,” Annu. Rev. Physiol. 35, 169–192 (1973). 10.1146/annurev.ph.35.030173.001125 [DOI] [PubMed] [Google Scholar]
- Montaudon M., Desbarats P., Berger P., de Dietrich G., Marthan R., and Laurent F., “Assessment of bronchial wall thickness and lumen diameter in human adults using multi-detector computed tomography: Comparison with theoretical models,” J. Anat. 211, 579–588 (2007). 10.1111/j.1469-7580.2007.00811.x [DOI] [PMC free article] [PubMed] [Google Scholar]
- Lee J., Reeves A. P., Fotin S., Apanasovich T., and Yankelevitz D., “Human airway measurement from CT images,” in Proceedings of Medical Imaging 2008: Computer-Aided Diagnosis, edited by Giger M. L. and Karssemeijer N., p. 18-1; Lee J., Reeves A. P., Fotin S., Apanasovich T., and Yankelevitz D.,[ Proc. SPIE 6915, 691518 (2008)]. 10.1117/12.770601 [DOI] [Google Scholar]
- Coxson H. O., Quiney B., Sin D. D., Xing L., McWilliams A. M., Mayo J. R., and Lam S., “Airway wall thickness assessed using computed tomography and optical coherence tomography,” Am. J. Respir. Crit. Care Med. 177, 1201–1206 (2008). 10.1164/rccm.200712-1776OC [DOI] [PMC free article] [PubMed] [Google Scholar]
- Saragaglia A., Fetita C., Brillet P. Y., Preteux F., and Grenier P. A., “Airway wall thickness assessment: A new functionality in virtual bronchoscopy investigation,” Proc. SPIE 6511, 0P–0P12 (2007). 10.1117/12.709532 [DOI] [Google Scholar]
- Rains J. K., Bert J. L., Roberts C. R., and Paré P. D., “Mechanical properties of human tracheal cartilage,” J. Appl. Physiol. 72, 219–225 (1992). [DOI] [PubMed] [Google Scholar]
- Habib R. H., Chalker R. B., Suki B., and Jackson A. C., “Airway geometry and wall mechanical properties estimated from subglottal input impedance in humans,” J. Appl. Physiol. 77, 441–451 (1994). [DOI] [PubMed] [Google Scholar]
- Hughes J. M. B., F. G.Hoppin, Jr., and Wilson A. G., “Use of stereoscopic x-ray pairs for measurements of airway length and diameter in situ,” Br. J. Radiol. 45, 477–485 (1972). 10.1259/0007-1285-45-535-477 [DOI] [PubMed] [Google Scholar]
- Kallok M. J., Lai-Fook S. J., Hajji M. A., and Wilson T. A., “Axial distortion of the airways in the lung,” J. Appl. Physiol. 54, 185–190 (1983). [DOI] [PubMed] [Google Scholar]
- Butler J. P., Nakamura M., Sasaki H., Sasaki T., and Takishima T., “Poissons’ ratio of lung parenchyma and parenchymal interaction with bronchi,” Jpn. J. Physiol. 36, 91–106 (1986). 10.2170/jjphysiol.36.91 [DOI] [PubMed] [Google Scholar]
- Mead J., Takishima T., and Leith D., “Stress distribution in lungs: A model of pulmonary elasticity,” J. Appl. Physiol. 28, 596–608 (1970). [DOI] [PubMed] [Google Scholar]
- F. G.Hoppin, Jr., Hughes J. M. B., and Mead J., “Axial forces in the bronchial tree,” J. Appl. Physiol. 42, 773–781 (1977). [DOI] [PubMed] [Google Scholar]
- Hogg J. C., Agarawal J. B., Gardiner A. J. S., Palmer W. H., and Macklem P. T., “Distribution of airway resistance with developing pulmonary edema in dogs,” J. Appl. Physiol. 32, 20–24 (1972). [DOI] [PubMed] [Google Scholar]
- Kamm R. D., “Airway wall mechanics,” Annu. Rev. Biomed. Eng. 1, 47–72 (1999). 10.1146/annurev.bioeng.1.1.47 [DOI] [PubMed] [Google Scholar]


