Abstract
Purpose: The aim of this article is to propose an exact SPECT region of interest (ROI) reconstruction method using truncated transmission and truncated emission data.
Methods: Recently, the authors published two articles in Physics in Medicine and Biology with two results in SPECT ROI emission image reconstruction. The first result states that if the transmission data are truncated but the emission data are not truncated, the emission image can be exactly reconstructed, provided the entire emission image is inside the region where the transmission data are not truncated. The second result states that if the transmission data are not truncated, the emission ROI can be exactly reconstructed with truncated emission data. This article combines these two results and obtains a new result that the emission ROI can be exactly reconstructed if both transmission and emission data are truncated.
Results: Computer simulations are performed to verify the proposed ROI image reconstruction algorithm.
Conclusions: Exact SPECT ROI image reconstruction is possible using truncated transmission and emission projections with some prior information about the attenuator and the emission distribution.
Keywords: SPECT, truncation, iterative reconstruction
INTRODUCTION
Recently, we published two papers in Physics in Medicine and Biology.1, 2 In the first paper, the transmission measurements are truncated but the emission data are not. The second paper assumes that transmission data are not truncated but the emission data are truncated. The current paper combines the results of those two papers and develops a method for reconstructing attenuation corrected emission images, where both the transmission and emission data are truncated.
The first paper1 assumes that the nonuniform attenuator is larger than the field-of-view (FOV) of the detector and the transmission measurements are truncated. In addition, the attenuation coefficients in a small region (e.g., in the soft tissue region) of the FOV are assumed to be known. Under these conditions, the attenuation map within the FOV can be exactly reconstructed.
We must point out that an “exact” reconstruction is only possible in a theoretically ideal situation where data are noiseless, sampled on the detector with an infinitesimal sampling interval, and sampled angularly with an infinitesimal angular interval; also, there are no computation round-off errors. In this paper, when we say that a certain algorithm can provide an exact reconstruction, we assume that this is only true in the theoretically ideal situation.
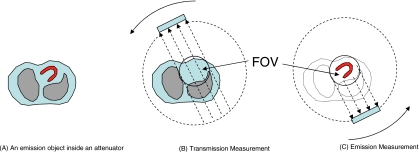
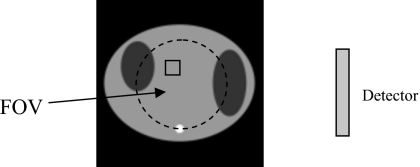
If the emission activity is assumed to be entirely within the FOV, then the emission image can be exactly reconstructed. The key observation in that paper is that if the product of the SPECT projections from opposing views is used in an image reconstruction algorithm, it is not necessary to have the complete attenuation map in order to reconstruct the image. We only need to have the attenuation map in the FOV and the transmission measurements with rays passing through the FOV. In the first paper, it was also shown that solving the system of quadratic equations where the data are the products of the opposing views to reconstruct an image is equivalent to solving the system of linear imaging equations for image reconstruction, provided the image values are non-negative. If the solution of the system of linear equations is unique, the solution of the system of quadratic equations is also unique, provided the solution is non-negative. This imaging situation is depicted in Fig. 1, where the emission object (i.e., the heart) is entirely within the detector’s FOV and the attenuator is larger than the FOV of transmission measurements. The emission measurements are acquired over 360° so that the opposite view is always available. The transmission data can be acquired over 180° or 360°.
Figure 1.
Imaging setup for the first paper (Ref. 1), where the emission data are completely measured but the transmission data are truncated.
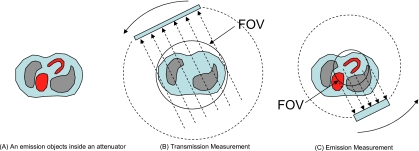
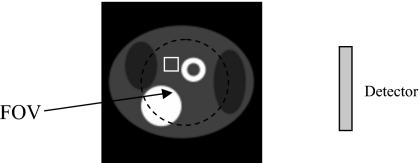
The second paper2 assumes that the nonuniform attenuation map is completely known, but the emission projections are truncated. This imaging situation is depicted in Fig. 2, where the emission object is larger than the emission measurement’s FOV (i.e., a portion of the liver is outside the FOV) and the attenuator is entirely within the FOV of transmission measurements. The transmission data acquisition FOV is larger than the emission data acquisition FOV. Here we do not require that the transmission measurements be acquired over 360° but require that an exact attenuation map be available. The portion of the emission image within the FOV can be exactly reconstructed if the emission image values in a small subregion of the FOV are given. In the mathematical proof, we used analytical reconstruction formulas but, since the solution is unique, it could also be obtained by iterative methods.
Figure 2.
Imaging setup for the second paper (Ref. 2), where the transmission data are completely measured with a larger FOV but the emission data are truncated with a smaller FOV.
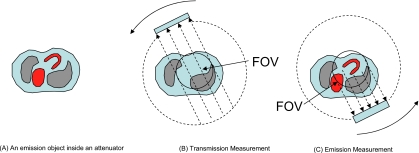
This paper combines the results from the above two papers to solve the double interior problem in which both the transmission and emission projection data are truncated (see Fig. 3). Since the truncated data do not provide enough information for a unique reconstruction, some prior information is assumed to be known and is used in the FOV attenuation map and emission image reconstructions. We claim that the emission image within the FOV can be exactly reconstructed with truncated transmission and emission SPECT data if, in a small subregion of the FOV, the attenuated map is known and, in the same or different small subregion of the FOV, the emission image is also known.
Figure 3.
Imaging setup for the current paper, where both the emission data and transmission data are truncated.
METHODS
The proposed method is to use an iterative algorithm to reconstruct the transmission image and the emission image sequentially. We assume that the angular sampling for both transmission and emission measurements is sufficient in the sense that the angular sampling satisfies the Nyquist sampling criteria, just as the linear sampling along the detector needs to be fine enough to satisfy the Nyquist sampling criteria. This translates to requiring the number of views over 180° to be approximately π∕2 times the number of detector bins.3
Using truncated data to reconstruct the image within the FOV is not new and it is an underdetermined problem, that is, the solution of the FOV image is not uniquely determined. On the other hand, the measurements along every line passing through the FOV are available; this makes the reconstructed image very close to the true image. It has been shown that the reconstructed image and the true image differ by a very smooth function. This smooth function has a very small magnitude and is essentially a constant. Therefore, the FOV reconstruction error can be referred to as a bias. Maass4 applied the singular value decomposition method to the FOV reconstruction and showed that the FOV reconstruction is almost correct except for a smooth unknown bias function, which is approximately a constant with very low frequency components. A priori information about the image in a small subregion within the FOV can be used to remove the bias.
The proposed SPECT FOV image reconstruction algorithm is described in the following steps. Before image reconstruction, one should acquire two sets of projections data: The emission measurements p(θ,s) and transmission measurements N(θ,s). The transmission projections N(θ,s) are related to the object’s attenuation map by, where N0 is the transmission flood. A transmission flood is a transmission projection measurement without an object in the FOV. The attenuation map is a 2D image, whose pixel values are the linear attenuation coefficients of the attenuator (i.e., the object) to be imaged, where can be expressed as Cartesian coordinates (x,y) or as polar coordinates (r,θ). Similarly, denotes the emission distribution image of the same object.
Step 1. FOV attenuation map reconstruction
This step is almost identical with the method developed in the first paper.1 An iterative algorithm is first selected to reconstruct the attenuation map from transmission data; this algorithm can be any user’s preferred algorithm to reconstruct an attenuation map. For example, the user can choose to use a transmission ML-EM algorithm. The chosen algorithm is used to reconstruct the attenuation map with truncated transmission measurements. Since the transmission projections are truncated, more information about the attenuation map is needed to assist the reconstruction. After each iteration of the algorithm, the FOV of the attenuation map is scaled by a constant so that the image value of the attenuation map in the sub FOV region equals to the value in the given value within the same subregion. When the attenuation map FOV is scaled by a constant k, we mean , , that is, every pixel value in the FOV image is multiplied by the same constant k.
After Step 1, an attenuation map is reconstructed. This attenuation map is correctly reconstructed within the FOV and not correctly reconstructed outside the FOV.
Step 2. Form the modified emission projection data for the quadratic imaging equations
This step is identical to the method developed in the first paper.1 To prepare for emission data reconstruction, one needs to form a modified projection q(θ,s) according to Eq. 1
| (1) |
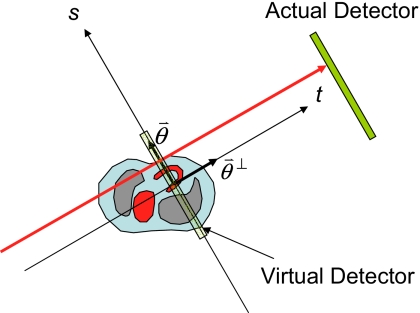
where q(θ,s) is a product of three factors: The emission measurement p(θ,s) at θ, the emission measurementp(θ+π,−s) at θ+π, and the factor which is the ratio of the flood N0 over the transmission measurement N(θ,s) along the same path. In Eq. 1, is the line-integral of the linear attenuation coefficient function , which is the attenuation map, and the SPECT measurement p(θ,s) is also referred to as the attenuated Radon transform, where θ is the detector rotation angle and s is the coordinate on the one-dimensional parallel-hole detector. The direction is along the detector coordinate system s and the direction is orthogonal to . These coordinates are shown in Fig. 4. The direction is along the surface of the 1D detector, while the direction is along the projection path. For parallel-beam imaging, the projection rays are perpendicular to the detector.
Figure 4.
Imaging coordinate systems.
After the prescaling procedure in Eq. 1, the resultant modified projection q(θ,s) is still dependent on the attenuation map . The modified imaging equation is quadratic and is defined as
| (2) |
where is the emission image. On the right hand side of Eq. 2, a virtual SPECT detector is placed at the center of rotation, which is the origin of the coordinate system; the attenuated projection is formed with an attenuator in one factor and with a negative attenuator in the other factor.
We now point out the difference of this paper from the second paper.2 If we pay attention to the exponent, we notice that the integral in the second paper is from the center of the FOV (that is, the detector position) to a location t inside the FOV. Thus the attenuation map in the second paper is needed only in the FOV if we use the quadratic imaging Eq. 2 to reconstruct the image within the FOV and the is zero outside the FOV. On the other hand, this paper assumes that the emission data are also truncated. The assumption that is zero outside the FOV is no longer true. In this paper, we will consider the integral outside the FOV. Outside the FOV, the attenuation map is no longer correct. Fortunately, those incorrect attenuation values only affect the reconstruction of the emission image outside the FOV.
Step 3. FOV emission image reconstruction
In the first paper,1 we developed an iterative algorithm to solve the system of quadratic Eq. 2:
| (3) |
where fi represents the value of the emission object f(x,y) at the pixel with index i, qj is the discrete measurement calculated in Eq. 1 at the detector bin with index j, and is the attenuation map value at the pixel with index . Here, aji is the geometric contribution, ignoring the attenuation effect but including the emission system’s point spread function (PSF) from the image pixel i to detector bin j. Similarly, tji is the geometric contribution, including the transmission system’s PSF from the image pixel i to detector bin j. Thus, the emission system’s PSF can be modeled in both the projector and the backprojector. The transmission system’s PSF can be modeled in the projector. The transmission system’s backprojector is never used.
In Eq. 3, is the discrete version of the line-integral , which is the attenuated projection data acquired by using a virtual detector at the center of rotation and the attenuation coefficient function is . Similarly, is the discrete version of the line-integral , which is the attenuated projection as if the virtual detector is at the center of rotation with the attenuation coefficient function .
The implementation of Eq. 3 is similar to that of a regular emission ML-EM algorithm, except that the projection data are replaced by the modified data q(θ,s) and the forward projection is replaced by a product of two projections along the same path. In one forward projection, the reconstructed attenuation map is used, while in the other projection, the negative attenuation map is used.
In order to make the algorithm more stable, we introduce a step-size control parameter h to the algorithm presented in Eq. 3 as in Hwang and Zeng’s paper5:
| (4) |
If h=1, Eq. 4 reduces to Eq. 3. If h>1, Eq. 4 is an accelerated algorithm with a larger step size. If 0<h<1, Eq. 4 is a decelerated and more stable algorithm with a smaller step size. In our computer simulations, the parameter h is determined experimentally and is chosen as 0.7 in some of computer simulations in this paper.
Similar to Step 1, after each iteration, the FOV of image is multiplied by a constant so that the image value in the sub FOV region equals to the given value in the subregion. After Step 3, an emission image is reconstructed and this image is exact within the FOV based on the result of the second paper.2
RESULTS
Computer simulations have been conducted to verify the proposed algorithm with truncated transmission and emission data for exact FOV image reconstruction. The true attenuator is shown in Fig. 5, where the object is represented in a 128×128 array. The linear attenuation coefficient of the large elliptical soft tissue background is 0.0396 per unit. One unit is the size of the detector bin, which is also equal to the image pixel size. The linear attenuation coefficient for the lungs is 0.0132 per unit and for the bone is 0.066 per unit. These attenuation coefficients are used to simulate 140 keV (Tc-99m) imaging within the patient torso including soft tissue, bones, and lungs. Tc-99m tagged radiopharmaceutical is most popular in cardiac SPECT. If the detector bin size is 3.3 mm, the bone’s attenuation coefficient is 0.2 per cm, the soft tissue 0.12 per cm, and lung 0.04 per cm.
Figure 5.
The nonuniform attenuator is imaged with a smaller detector. The attenuation coefficient in the 10×10 square is assumed to be known.
A small (10×10) square subregion is indicated in the FOV as the “known subregion.” We assume that the attenuation coefficient in this small square is known and it will be used to assist the reconstruction of the attenuation map. The original detector had 128 bins; after truncation of 30 bins on both ends, the detector consists of 68 bins.
The emission object is shown in Fig. 6, where the bright ring represents the heart, the bright disk represents the liver, and the dark ellipses are the lungs. The background activity intensity is 1, the intensity for the heart and the liver is 4, and intensity for the lungs is 0.5.
Figure 6.
The emission object is imaged with a smaller detector. The image intensity in the 10×10 square is assumed to be known.
In the computer simulations, we assume that the detector measures the parallel-beam emission data from the emission object and measures the parallel-beam transmission data from the attenuator. In reality, if convergent-beam transmission data are acquired, the convergent-beam data will be rebinned into parallel-beam data to be consistent with the emission data.3 If the emission data are also acquired with the same convergent geometry as the transmission data, no rebinning is necessary.
The transmission data (i.e., line-integrals of the attenuator) and emission data (i.e., attenuated Radon transform of the object) are generated analytically at 402 views uniformly distributed over 360° to satisfy Nyquist angular sampling criterion. In practice, only approximately 120 views are used in a routine SPECT scan.
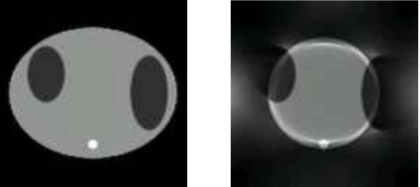
The attenuation map reconstruction algorithm is described in Sec. 2A. No noise is added to the transmission data. The common iterative emission ML-EM algorithm except for the additional “constant scaling in FOV” procedure is used to reconstruct the attenuation map with 200 iterations. The reconstructed attenuation maps are shown in Fig. 7 with truncation-free projections and truncated projections, respectively.
Figure 7.
The reconstructed attenuation maps with truncation-free data (left) and with truncated data (right).
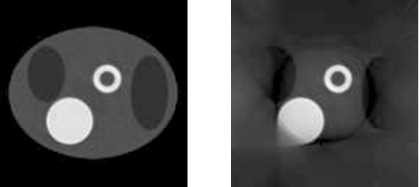
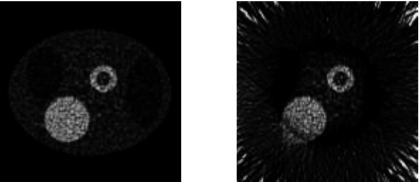
The formula presented in Eq. 4, except for the additional “scaling the FOV by a constant” procedure, is used to reconstruct the emission image with 75 iterations. The reconstructed emission images are shown in Fig. 8 with truncation-free transmission and truncation-free emission projections and with truncated transmission and truncated emission projections, respectively.
Figure 8.
The reconstructed emission images with truncation-free data (left) and with truncated data (right).
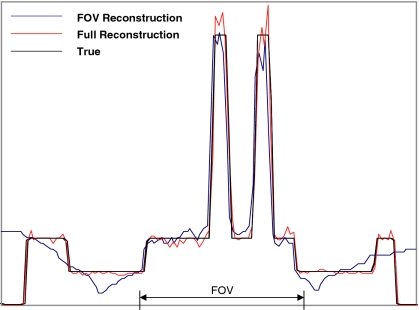
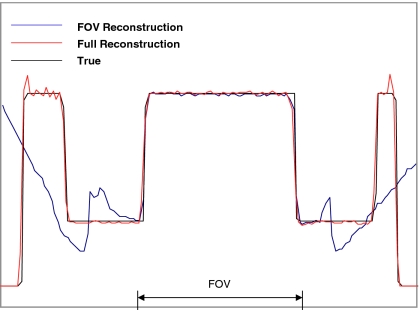
To more quantitatively evaluate the proposed method, profiles are drawn horizontally across the center of the heart. The profiles for the reconstructed attenuation maps are shown in Fig. 9 and the profiles for the emission reconstructions are shown in Fig. 10.
Figure 9.
An emission reconstruction profile comparison. The profiles are drawn in the emission images, horizontally across the center of the heart. The acceleration factor h=0.7 was used.
Figure 10.
An attenuation map reconstruction profile comparison. The profiles are drawn in the emission images, horizontally across the center of the heart.
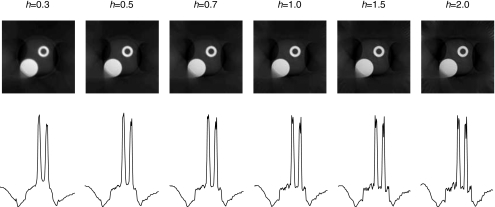
Next, Fig. 11 shows the effect of the acceleration parameter h in Eq. 4. When 0<h<1, the algorithm is more stable; when h>1, the algorithm converges (and diverges) faster with larger oscillations in the image. This can be observed by the profiles drawn horizontally across the center of the heart in Fig. 11; note the flatness of the background. One can select the h value from a wide range, and the resultant image quality is about the same. For example, the image obtained by using h=0.5 and 100 iterations is comparable with the image obtained by using h=0.7 and 75 iterations. There is no single clear-cut favored value of h.
Figure 11.
Algorithm convergence is affected by the acceleration parameter h.
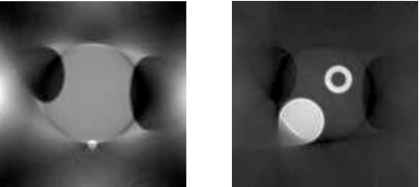
Figure 12 illustrates that for truncated data image reconstruction, if we do not enforce the correct value in the given subregion within the FOV, the transmission and emission images look very similar to those reconstructed with the correct values in the given subregion within the FOV by the proposed algorithm. The image bias is difficult to detect by naked eyes. The true attenuation map value in the small square subregion shown in Fig. 5 is 0.0396, while the attenuation map average value in this small square region is 0.0359 in Fig. 12. The true emission image value in the small square subregion shown in Fig. 6 is 1, while the emission image average value in this small square region is 1.1 in Fig. 12. If one does not need the quantification of the activity, the prior knowledge of the image value in a small subregion of the FOV may not be required.
Figure 12.
Transmission and emission images reconstructed without using the given values in the subregion within the FOV. These images are slightly biased.
Finally, reconstructed emission images with noisy Poisson emission data are shown in Fig. 13, where both a full data set and a truncated data set are used for image reconstruction. There are approximately one million counts in the emission projections for the truncation-free data set.
Figure 13.
The reconstructed emission images with truncation-free noisy data (left) and with truncated noisy data (right).
CONCLUSIONS
In this paper, we have combined the techniques that were previously published and have developed a method to exactly reconstruct SPECT images with nonuniform attenuation correction in the FOV using truncated transmission and emission measurements. This work adds to previous works (see previous papers for references and also Defrise et al.,8 Kudo et al.,9 and Yu et al.6) in solving the truncation problem in SPECT that began with our original work.7
For FOV image reconstruction, the common errors are the bright edges of the FOV and an almost constant bias within the FOV. If the FOV contains an area outside the patient where there is no radioactivity, there is no bias. This is a special property of the multiplicative ML-EM algorithm. No scaling of the FOV is necessary in the proposed emission reconstruction algorithm.
For a general interior tomography case, it is extremely difficult to know the true counts from a certain region within the FOV of the emission image. It has been suggested to perform a quick scout scan which is truncation-free to estimate the true counts. However, the scout images are extremely noisy and are likely to be biased due to noise. Therefore, we do not yet know another case that the true counts for some point in the emission image can be determined accurately.
The FOV reconstruction problem in general does not have a unique solution without the prior information. Because the error is almost a constant bias, the relative image values are almost correct. The scaling step makes a small region within the FOV have a correct value at each iteration, so that the entire FOV can converge to the true unique solution. However, if one does not need the quantification of the activity, the prior knowledge of the image value in a small subregion of the FOV may not be required.
This paper focuses on 2D imaging, and requires that every ray passing through the FOV be measured for both emission and transmission. Therefore, it is possible to rebin the data so that the transmission data and the emission data have the same geometry. The fan-beam to parallel-beam rebinning method is quite popular and is sometimes referred to as data resorting.3 In fact, the algorithm shown in Eq. 3 is processed ray-by-ray and is independent from any imaging geometry.
For 3D imaging, this situation is different because in 3D imaging, it is not required that every ray passing through the FOV must be measured. If there is no transmission ray associated with every emission ray, the proposed method does not apply. In general, the 3D FOV imaging problem with pinhole or cone beam is still open. Our method can only be applied to the 3D imaging problems that for every measured emission ray passing through the FOV, a transmission measurement is available for this ray.
This work is significant because it provides a means to perform nonuniform attenuation correction in SPECT with truncated transmission data and truncated emission data and may have wide applications in small dedicated SPECT cameras. A drawback of the proposed method is that we need to somehow acquire prior information in a small region about the emission image. If the FOV contains a region that is outside the patient’s body, this task is trivial; otherwise, this task is challenging. For the attenuation map, a similar task is readily solved because the linear attenuation coefficient of tissues are known at a given photon energy. Another drawback of the proposed method is the need to acquire SPECT emission projection data for all opposing views. In other words, we must scan over 360°.
ACKNOWLEDGMENTS
This work was supported in part by the Margolis Foundation, NIH Grant No. R01EB00121, and by the Director, Office of Science, Office of Biological and Environmental Research, Medical Science Division of the U.S. Department of Energy under Contract No. DE-AC02-05CH11231.
References
- Zeng G. L. and Gullberg G. T., “Exact emission SPECT reconstruction with truncated transmission data,” Phys. Med. Biol. 54, 3329–3340 (2009). 10.1088/0031-9155/54/11/004 [DOI] [PMC free article] [PubMed] [Google Scholar]
- Zeng G. L. and Gullberg G. T., “Exact iterative reconstruction for the interior problem,” Phys. Med. Biol. 54, 5805–5814 (2009). 10.1088/0031-9155/54/19/009 [DOI] [PMC free article] [PubMed] [Google Scholar]
- Kak A. C. and Slaney M., Principles of Computerized Tomographic Imaging (IEEE, New York, 1988). [Google Scholar]
- Maass P., “The interior Radon transform,” SIAM J. Appl. Math. 52, 710–724 (1992). 10.1137/0152040 [DOI] [Google Scholar]
- Hwang D. S. and Zeng G. L., “Convergence study of an accelerated ML-EM algorithm using bigger step size,” Phys. Med. Biol. 51, 237–252 (2006). 10.1088/0031-9155/51/2/004 [DOI] [PubMed] [Google Scholar]
- Yu H., Yang J., Jiang M., and Wang G., “Interior SPECT—Exact and stable ROI reconstruction from uniformly attenuated local projections,” Commun. Numer. Methods Eng. 25, 693–710 (2009). 10.1002/cnm.1206 [DOI] [PMC free article] [PubMed] [Google Scholar]
- Zeng G. L. and Gullberg G. T., “Single photon emission local tomography (SPELT),” in IEEE Nuclear Science Symposium Conference Record, Anaheim, CA, 2–9 November 1996, pp. 1628–1632.
- Defrise M., Noo F., Clackdoyle R., and Kudo H., “Truncated Hillbert transform and image reconstruction from limited tomographic data,” Inverse Probl. 22, 1037–1053 (2006). 10.1088/0266-5611/22/3/019 [DOI] [Google Scholar]
- Kudo H., Courdurier M., Noo F., and Defrise M., “Tiny a priori knowledge solves the interior problem in computed tomography,” Phys. Med. Biol. 53, 2207–2231 (2008). 10.1088/0031-9155/53/9/001 [DOI] [PubMed] [Google Scholar]


