Abstract
Unilateral laryngeal paralysis leads to tension imbalance and hence to asynchronous movements between the two vocal folds during phonation. In the current study, a computational model of phonation that couples a two-mass model of the vocal folds with a Navier-Stokes model of the glottal airflow, has been used to examine the dynamics of vocal fold configurations with tension imbalance and its implications for phonation. The simulations show that tension imbalance influences phonation onset, intensity as well as the fundamental phonation frequency. Distinct non-linear effects such as period-doubling bifurcation and preferential frequency selection are also observed.
INTRODUCTION
Irregularities in human voice occur very often and these usually manifest as breathy or hoarse voice (Colton and Casper, 1996). It has been pointed out (Steinecke and Herzel, 1995; Belafsky et al., 2002) that vocal instability is induced either by the denervation of the vocal fold or pathological changes of the structure or the mechanical properties intrinsic to larynx. The former condition is referred to as vocal fold paralysis whereas the latter is termed presbylarynx. The disease usually effects one vocal fold (i.e., is unilateral), leading to a significant imbalance of structural tension between the two vocal folds.
By electro-(EGG) and photoglottography (PGG), a variety of irregular vibratory patterns of the vocal folds have been observed for cases associated with disordered voices, such as laryngeal paralysis (Tanabe et al., 1972; Kelman, 1981; Zhang and Jiang, 2005; Schwarz et al., 2006). These irregularities are thought to arise from the intrinsic nonlinearity of the vocal system and have been extensively examined by the theories of nonlinear dynamics. Indeed, subharmonics, bifurcations and low-dimensional chaos are common observations in high-speed recording signals of the pathological voice (Berry et al., 1996; Herzel et al., 1994; Wilden et al., 1998).
In the last few decades, many different computational models have been used to study the mechanisms underlying voice disabilities. The well known two-mass model was first developed by Ishizaka and Flanagan (1972) and then simplified by Steinecke and Herzel (1995) to focus on the oscillatory characteristics of diseased vocal folds. A variety of flow models have been coupled to these two-mass models and these coupled models have provided results which are in general agreement with physiological data (Wong et al., 1991; Pelorson et al., 1994; Jiang and Zhang, 2002). However, in most cases, the glottal aerodynamics is modeled via the Bernoulli’s equation, which can either not model, or model with a low level of fidelity, the effects of viscosity, vortex dynamics, temporal flow variation, and flow gradients in the lateral direction. In particular, the flow through the glottis can exhibit significant asymmetry due to jet deflection (often called the “Coanda effect”) and this could lead to asymmetric aerodynamic force on the two vocal folds. Furthermore, the supra-glottal jet vortex dynamics induces mixing, which enhances the pressure loss. The complex vortex dynamics associated with the jet also induces time-varying aerodynamic loading on the superior portions of the vocal folds and is expected to modify the bifurcations exhibited during phonation (Jiang and Zhang, 2002). None of these features can be produced with a Bernoulli equation based flow model.
Recently, a computational model which combines the two-mass vocal fold model with the Navier-Stokes equation based model for the airflow was proposed (de Vries et al., 2002; Tao et al., 2007). With this model, they successfully predicted the self-oscillations of the vocal folds and captured asymmetric glottal jet deflection during phonation. Compared with models where both the airflow and vocal fold are modeled as continuum (Alipour and Titze, 1997; de Oliveira Rosa et al., 2003; Thomson et al., 2005; Tao et al., 2006; Luo et al., 2008; Zheng et al., 2009; Luo et al., 2009), this Navier-Stokes-two-mass model has the advantage of providing a good physical description of glottal aerodynamics at a reduced computational cost.
In current research, a similar composite phonation model is developed to simulate and study irregular vocal fold vibrations as well as the aerodynamics in an asymmetric configuration designed to model a unilaterally paralyzed larynx. The objective of the study is to gain insights into the underlying physical mechanisms of irregularities induced by left-right vocal fold tension imbalance, with particular focus on the implications that vocal fold asymmetry has on the ability to phonate. The asymmetry in the vocal folds is varied systematically, and we examine a number of features associated with the VF vibration and glottal flow. The current work may be considered complementary to the work of Steinecke and Herzel (1995); whereas Steinecke and Herzel (1995) model a large number of cases which allows them to explore the non-linear dynamics, the current work examines fewer cases (due to the higher computational expense associated with the Navier-Stokes flow model) but is able to focus on the dynamics of the glottal flow in an asymmetric larynx, and its implications for phonation.
METHOD
In this section, we describe the laryngeal model that is employed in the current study. This includes the model for the glottal airflow, a dynamical model for the vocal folds and an appropriate coupling procedure between these two.
Glottal airflow modeling
Based on the assumption of viscous incompressible airflow, the governing equations are the two-dimensional, unsteady, viscous, incompressible Navier-Stokes equations
| (1) |
| (2) |
where vi are velocity components in two directions, p is pressure, and ρ and υ are flow density and kinematic viscosity.
The equations are discretized using a cell-centered, non-staggered arrangement of the variables and integrated in time using the fractional-step method. A second-order Adams-Bashforth scheme is employed for the convective terms while the diffusion terms are discretized using an implicit Crank-Nicolson scheme which eliminates the viscous stability constraint. A line–SOR scheme is used to solve the advection–diffusion equation and an alternating–direction geometric multigrid with a line–SOR smoother is used to solve the pressure Poisson equation (Mittal et al., 2008).
The solver employs a sharp-interface immersed-boundary method (IBM), which is well suited for the simulation of complex and moving boundary problems on a Cartesian grid. Further details of this immersed boundary method can be found in Mittal et al. (2008). In the context of laryngeal modeling, this solver has been employed previously by Luo et al. (2008,2009) and Zheng et al. (2009).
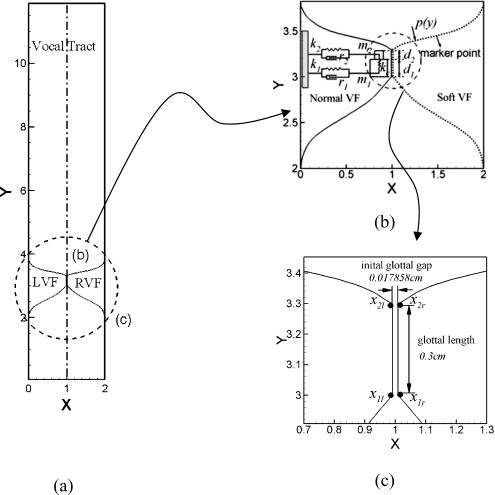
In this study, the vocal tract (shown in Fig. 1) is represented by a 12 cm×2 cm straight channel. The vocal folds extend from x=2 cm to x=3.8 cm. The glottal length is 0.3 cm and both the inferior and superior glottal gaps are 0.17857 cm, which correspond to the model of Tao et al. (2007). The medial surface of the vocal folds is attached to the lateral boundaries by two curves which together with the medial surface represent the total surface of the vocal fold exposed to the airflow. Both curves are smooth 5th-order polynomials. The outline of each vocal fold is represented by 200 uniformly arranged Lagrangian marker points (shown in Fig. 1b), whose displacement and velocity are obtained via linear interpolation from the displacement and velocity of two masses. Details regarding the fluid-structure interaction will be given later.
Figure 1.
(a) The geometric model of larynx. “LVF” represent left vocal fold and “RVF” represent the right vocal fold. The drawing is to scale and all dimensions are in centimeters. (b) View of the vocal-folds with a schematic of the two-mass model and the Lagrangian marker points corresponding to the vocal fold surface. ki, ri and di are the spring constant, damping constant and thickness of mass mi (i=1,2), respectively and kc is the stiffness of the coupling spring between two masses. (c) Zoom-in view of the glottis. Points “1l” and “1r” represent two bottom points on the left and right vocal folds respectively, while “2l” and “2r” represent the two corresponding points on the top.
The outlet pressure is fixed at zero gage and the inlet subglottal pressure, Ps, is varied in the current study. No-penetration and no-slip boundary conditions are applied on the vocal tract walls.
Two-mass model of vocal fold
The two-mass model is a classical model for the dynamics of the vocal folds. The model employed here is based on the two-mass model of Ishizaka and Flanagan (1972), which represents each vocal fold as a system of two-masses connected by springs. Taking the left vocal fold as an example, Fig. 1b shows a schematic structure of the two-mass model, in which m1, k1 and r1 represent the mass, spring constant and damping coefficient respectively of the lower part of the vocal fold, and m2, k2 and r2 the corresponding values of the upper portion. The two masses are coupled by a spring with stiffness kc. As is typical for these models (Steinecke and Herzel, 1995; Ishizaka and Isshiki, 1976; Jiang et al., 2001), the two masses are only allowed to move in the lateral direction.
The differential equations corresponding to this two-mass model system are:
| (3) |
| (4) |
| (5) |
| (6) |
where xi and vi are the displacement and velocity of mass mi in the two-mass system. di is the thickness of the mass, where d1=0.25 cm and d2=0.05 cm. Pi is the average aerodynamic pressure applied on mass mi. The index i denotes the upper and lower masses. L=1.4 cm is the depth of the glottis in the third direction,
The differential equations are solved with a fourth-order Runge-Kutta method. The parameters in the lumped model are set at values that are considered typical of physiological conditions (Ishizaka and Flanagan, 1972; Tao et al., 2007) and are listed in Table 1. Contact between the two vocal folds is modeled by enforcing a minimum glottal gap of 0.001 cm, which is a small fraction of the maximum glottal gap.
Table 1.
Parameter values for the two-mass model used in the current study.
| Parameter | Symbol | Value |
|---|---|---|
| Lower mass | m1 | 0.125 g |
| Upper mass | m2 | 0.025 g |
| Lower spring constant | k1 | 80 kdyn∕cm |
| Upper spring constant | k2 | 8 kdyn∕cm |
| Coupling spring constant | kc | 25 kdyn∕cm |
| Lower damping constant | r1 | 20 g∕s |
| Upper damping constant | r2 | 20 g∕s |
| Lower mass thickness | d1 | 0.25 cm |
| Upper mass thickness | d2 | 0.05 cm |
As has been done in previous studies (Steinecke and Herzel, 1995) a tension imbalance parameter α is introduced to describe the asymmetric activity of the cricothyroid muscle. We assume that the left vocal fold remains normal while the right one is subject to reduced tension. Following Steinecke and Herzel (1995) the parameter α modifies the parameters of the right vocal fold as follows: ki=αki0, ci=αci0, mi=mi0∕α, for i=1,2 and kc=αkc0, where the index 0 denotes the standard parameter set for the left vocal fold.
Fluid-structure interaction
Interaction between the vocal folds and the airflow takes place at the surface of the glottal wall. The fluid-structure interaction is implemented through an explicit coupling between the IBM flow solver and the two-mass model solver wherein the two are solved sequentially in each time-step. The IBM flow solver gets the boundary locations and boundary velocities from the two-mass model system through the maker points (shown in Fig. 1). The aerodynamic force acting on the two masses (denotes as P1 and P2) is computed by integrating the pressure on the vocal fold p(y) as follows:
RESULT AND DISCUSSION
The study focuses on a systematic variation of two parameters: the tension imbalance parameter α and the subglottal pressure Ps. For α, we employ the values 0.4, 0.5, 0.7 and 1.0, where the lower values denote higher tension imbalance and a value of 1.0 denotes no imbalance, i.e., normal vocal folds. For each of the above values of tension imbalance, we also apply the following subglottal pressures (Ps): 0.1, 0.3, 0.5, 0.6, 0.7, 0.8, 0.9, 1.0 kPa (gage). This parameter signifies the effort expended during phonation, with high levels of Ps denoting a higher effort level. Thus, the above set of simulations should allow us to gain insights into the interplay between tension imbalance and phonation effort. We use a variety of data including flow vortex dynamics, frequency spectra, and glottal flow rate to draw conclusion regarding the effect of tension imbalance on phonation onset, effort and quality.
All of the simulations are performed on a non-uniform 289×289 Cartesian grid where higher resolution is provided in the glottal region. The current grid is based on our past experience in simulating these flows and has been subjected to grid refinement analysis in previous studies (Luo et al., 2008; Zheng et al., 2009). The simulations employ a small time-step corresponding to about 3.5 microseconds, which results in 1500–4500 time-steps per vibration cycles. Simulations are run for over 10 cycles until a stationary state is achieved and all results presented here correspond to this state. Each simulation takes 300–500 h of CPU time on a single processor 2.01 GHz AMD Opteron computer.
Qualitative features
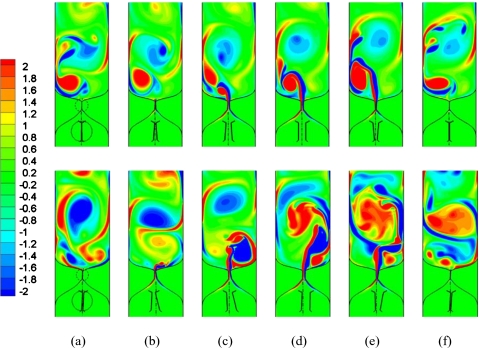
In Fig. 2, we present a time sequence of spanwise vorticity contours in the vocal tract during one vibration cycle for two extreme cases: α=1.0 and α=0.4. For both these cases, Ps=1.0 kPa, which corresponds to a nominal physiological condition. The motion and conformation of the vocal-folds are also shown for both the cases. The figure clearly indicates that the vibration pattern is highly asymmetric for the case with tension imbalance, whereas the vibration is quite symmetric for the balanced VF case. We also note that the imbalanced vocal folds do not exhibit complete closure during the vibration cycle, a fact confirmed by past studies (Ishizaka and Isshiki, 1976; Story and Titze, 1995).
Figure 2.
A time sequence of spanwise vorticity contours in the asymmetric and symmetric models for one full vibration cycle. The first row represents the symmetric model and the second row corresponds to the asymmetric model with α=0.4. In both of the cases, Ps=1.0 kPa. Zoom-in view in each figure shows the vocal fold configuration at each time-instance.
Despite the large difference in the vibratory patterns, the two cases have a glottal jet vorticity pattern that is qualitatively quite similar. In both cases, the glottal jet vortices show a deflection from the centerline. The deflection of airflow is found to be random from cycle-to-cycle and this phenomenon has been described in detail by Zheng et al. (2009). However, the deflection of airflow is more significant in the asymmetric case due to the significant tension imbalance.
Glottal flow and implications for phonation
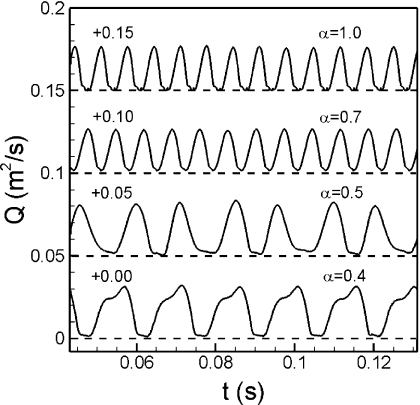
It is well known that the phonation is essentially an energy-transfer process through the interaction of airflow and tissue. During the phonation, a pulsatile jet flow is generated through the glottis by the sustained oscillations of the human vocal folds and this jet is directly responsible for the sound production (Story, 2002). Figure 3 shows the history of glottal volume flow rate for cases with Ps fixed at 1.0 kPa and α varying from 0.4 to 1.0. This plot shows interesting behavior indicative of a significant effect of tension imbalance on voice. First, the tension imbalance clearly affects the frequency of phonation, with the highest frequency occurring for the normal case. Second, as the tension-imbalance increases, the time-variation of the glottal flow rate transits from a purely periodic behavior to a more complex quasi-periodic variation. For example, at α=0.5, the history of flow rate starts to show alternating low and high peaks, which implicate the presence of a subharmonic in the flow.
Figure 3.
The history of glottal flow rate for cases with varied α value and fixed Ps at 1.0 kPa. Each curve has been offset along the ordinate and horizontal dashed lines represent the datum for each curve.
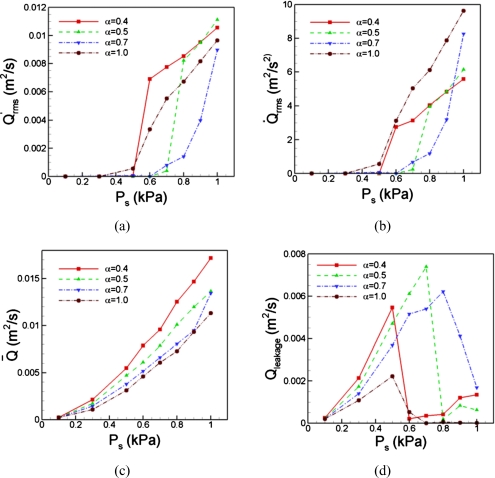
Since the glottal flow-rate is the primary determinant of phonatory sound, we examine this quantity further to better understand the implications of tension imbalance phonation onset, effort and quality. In Fig. 4a, we plot the root-mean-square fluctuation of the glottal volume flow rate which is a measure of the intensity of the fluctuation in the glottal flow-rate. This plot indicates that for the cases with α=1 and 0.4, the intensity of the glottal flow fluctuations increase rapidly beyond a subglottal pressure of 0.5 kPa, whereas the other two cases only show substantial increase in glottal flow fluctuation for subglottal pressures above 0.7 kPa. This would seem to imply, somewhat counter-intuitively, that the case with the tension imbalance, i.e., α=0.4, phonates in a manner similar to the normal symmetric case. However, the following discussion indicates that this is not the case.
Figure 4.
Comparing the important flow parameters affecting on the sound quality in both the asymmetric and symmetric cases. (a) The fluctuation amplitude of volume flow rate, which represents the strength of the vocal fold vibration. (b) The time-rate of change of the volume flow rate, which is related to the monopole sound strength. (c) The mean value of volume flow rate which is indicative of the flow impedance. (d) The leakage, which is the average of minimum volume flow rate over cycles, reveals the glottal gap size.
Noting that the monopole sound strength of the glottal jet is directly related to the time-rate of change of the flow rate, , of the jet (Zhao et al., 2002; Zhang et al., 2002) we plot the root-mean-square fluctuation intensity of this quantity in Fig. 4b. This plot shows a number of interesting features with direct implications for phonation onset and intensity. First, the plot shows that the case with normal, symmetric vocal fold has the lowest threshold pressure and starts to show significant magnitude of this quantity at a subglottal pressure of 0.5 kPa. Note that this is different from the behavior seen in Fig. 4a which shows a more rapid and sustained increase in glottal flow rate fluctuation for the case with the highest level of asymmetry. The two cases with α=0.5 and 0.7 require the highest subglottal pressures (approximately 0.7 kPa) to produce noticeable magnitudes of fluctuations, indicating a higher effort for phonation onset. Interestingly, the case with the highest tension imbalance shows phonation onset which, although slightly delayed, is initially very similar to that for the normal case. This indicates that the effect of tension imbalance on phonation onset is quite non-linear, and that phonation onset pressure does not increase monotonically with tension imbalance.
The plot in Fig. 4b also provides insights into the increase in phonation intensity with effort. The usual way to increase the intensity of sound in phonation is to increase the subglottal pressure, which leads to increase in vibratory amplitude of the vocal folds and thence to increase in phonatory sound intensity. Given this, we note that the Figure 4b indicates a rapid and monotonic increase in phonation intensity with subglottal pressure for the normal (symmetric) vocal folds. The case with slight tension imbalance (α=0.7) also shows a similar increase in phonation intensity with subglottal pressure, but this increase happens at higher pressures due to delay in phonation onset.
The two cases with higher tension imbalance (α=0.5 and 0.4) show a trend that is qualitatively different from these other two cases. Both of these show an initial rapid increase in phonation intensity with subglottal pressure followed by a transition where the rate of increase of sound intensity reduces and stays at this reduced level over the range of subglottal pressures investigated in the current study. The subglottal pressure at which this transition occurs reduces with increasing tension imbalance, which suggests that the effort required to raise phonation intensity increases with tension imbalance. A comparison of Fig. 4a, 4b also shows that while the cases with the highest symmetry vibrate with the larger amplitudes than the symmetric case for large subglottal pressure, the corresponding phonation intensity (as shown in Fig. 4b) is in fact significantly lower than the symmetric case. This indicates that the sound intensity is severely limited in a paralyzed larynx even though the vocal folds could be undergoing larger vibrations.
Next we analyze the data to examine what we can learn regarding the effect that tension imbalance has on the quality of sound that is produced. In order to do this, we plot two quantities related to the volume flow rate; Fig. 4c shows the mean volume flow rate and Fig. 4d shows the leakage flow rate Qleakage. The mean flow rate is simply the time-mean of the flow through the glottis. The leakage flow on the other hand is the time-mean of the minimum flow during each cycle of vocal fold vibration. It is a measure of the flow that leaks through the glottis at a phase where the glottal gap is at its minimum and nonzero values are indicators of incomplete glottal closure. The implication of these quantities on the quality of sound produced during phonation can be understood by noting that during regular breathing, both of these quantities have high values, especially relative to the fluctuation intensity of the flow rate. Thus, high values of both these quantities are indicative of a “breathy” quality in the voice.
Figure 4c clearly shows that for all subglottal pressures, the normal vocal fold case has the lowest mean flow rate and that the mean flow rate increases monotonically with tension imbalance at any given subglottal pressure. Figure 4d however shows a more complex behavior of the leakage flow with subglottal pressure and tension imbalance. For all cases, the leakage flow initially increases with subglottal pressure. We note that the rate of increase of this quantity with subglottal pressure is lowest for the normal symmetric case, and increases monotonically with tension imbalance. However, as the subglottal pressure is increased further and the glottal vibration amplitude increases to what we consider to correspond to phonation onset, there is a sharp drop in the leakage flow. For the normal, symmetric vocal fold case, for higher values of the subglottal pressure, we find that the leakage flow essentially stays at zero, indicating full glottal closure during each cycle. For α=0.5 and 0.4, the leakage flow never becomes zero and in fact, starts to increase slowly with subglottal pressure indicating that high amplitudes of vocal fold vibrations are accompanied by nonzero leakage flow. For the α=0.7, the leakage flow remains high for the entire range of subglottal pressure studied here. The above analysis therefore indicates that the cases with tension imbalance will have a “breathy” voice quality. In contrast, post phonation onset, the normal symmetric vocal fold case settles into a vibration mode that ensures full glottal closure during each vibration cycle and would thus produce a clearer voiced sound.
Fundamental phonation frequency
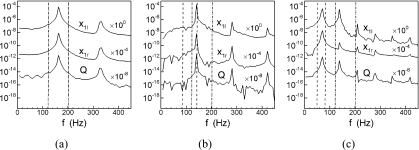
Previous work (Titze, 1976; Herzel et al., 1994, 1995) has pointed out that during normal phonation, the oscillations of the two vocal folds are entrained to the same frequency, which is governed by the natural frequencies of vocal folds. However, it is not clear if such entrainment occurs when one fold is affected by the paralysis. In this case, the natural frequencies of the paralyzed vocal fold deviate from the normal vocal fold and this can effect the vibration of both vocal folds as well as the dynamics for the flow. To gain a better understanding of the effects of tension imbalance on the phonation frequency, we consider four specific cases in which the subglottal pressure is fixed at 1.0 kPa and α changes from 0.4 to 1. The Fourier spectrum corresponding to the displacement of the lower masses of the two vocal folds and the glottal flow rate are shown in Fig. 5. The natural frequencies of vocal folds obtained via an eigen-analysis of the two-mass system are also plotted, with the dash-dotted line representing the two natural frequencies of the left (normal) side and the dashed line representing the two natural frequencies of right (soft) side.
Figure 5.
The Fourier spectrum corresponding to displacement of the two lower masses and the glottal volume flow rate for cases with Ps=1.0 kPa. The vertical dash-dot lines represents the two natural frequencies of left (normal) vocal fold and the dash line represents two natural frequencies of right (soft) vocal fold. x1l and x2l represent the locations of the lower masses on the left and right vocal folds respectively. (a) α=1.0, (b) α=0.7, (c) α=0.4. Plots have been offset in the ordinate.
Figure 5a, shows the frequency spectra for a healthy phonation case. The plot indicates a fundamental phonation frequency of approximately 165 Hz and an overtone frequency of approximately 330 Hz. Note that the fundamental phonation frequency is between the two eigenfrequencies, and is indicative of an entrainment between the two eigenmodes. However, as α reduces below 1, more complex vibratory behaviors are observed. Figure 5b shows the frequency spectra for the α=0.7 case which has a slight level of tension imbalance. For this case, we find that both vocal folds as well as the glottal flow show a dominant peak at about 140Hz and overtones of relatively reduced magnitudes at 280Hz and 420Hz. The fundamental phonation frequency for this case coincides with the second eigenfrequency of the softer vocal fold and due to this mode entrainment, the peak in this case is much sharper than that observed for the normal case.
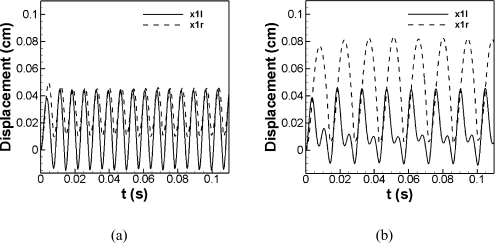
To provide a detailed description of the vibratory entrainment pattern of the left and right vocal folds for this case, a plot of the displacement history of the two lower masses of vocal folds is shown in Fig. 6a. This result indicates that the two vocal folds are entrained at the same fundamental frequency and the normal (left) vocal fold precedes the soft (right) side. A similar phenomenon was also observed in one of the cases of Steinecke and Herzel (1995). However, there is an interesting difference that in our case the greater amplitude happens on the normal side while in Steinecke & Herzel’s case it happens on the soft side. This difference may be due to a number of factors including the asymmetric effect associated with the vortical flow through and beyond the glottis or due to the different contact models employed in these two studies.
Figure 6.
The displacement history of the two lower masses of the left and right vocal folds for cases with Ps=1.0 kPa. (a) α=0.7, (b) α=0.4.
Figure 5c is for the α=0.4 case and this case is interesting in that it shows the present of a strong overtone. The fundamental phonation frequency is about 70Hz and the dominance of this frequency for the softer (right) vocal fold clearly indicates that this frequency is a result of 1:1 entrainment of the two eigenmodes of the soft vocal fold. However, the spectra for the left (normal) vocal fold shows an overtone frequency of about 140Hz which has an amplitude comparable to the amplitude at the fundamental frequency. It should be noted that this is one case where the overtone frequency lies within a range bracketed by the two eigenfrequencies of the normal vocal fold. This suggests the possibility that the overtone might be associated with an entrainment of the two eigenmodes of the normal vocal fold, although other scenarios which involve mode-entrainment between the two vocal folds are also possible. This overtone also appears quite strongly in the glottal flow signal and would therefore be evident in the sound. Thus, while the fundamental phonation frequency seems to be dominated by the dynamics of the soft vocal fold, the normal vocal fold does have a direct impact on the sound production. It should be noted that Steinecke and Herzel (1995) also concluded that the flow is mainly governed by the soft vocal fold whereas the normal vocal fold influences the intensity of harmonics in the frequency spectrum. The displacement history of lower masses of two vocal folds for this case is shown in Fig. 6b. A 1:2 locking ratio of the number of the peak of x1r and x1l can be clearly observed. This suggests that the strong overtone appearing on the left (normal) vocal fold is in fact the result of 1:2 mode entrainment between the two vocal folds.
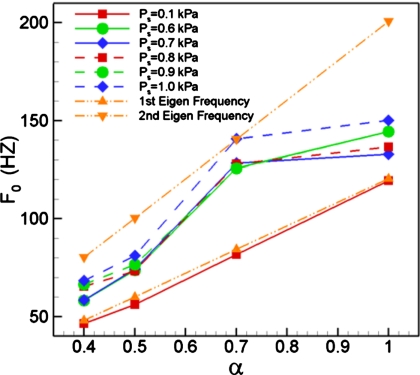
We summarize the dependence of phonation frequency (i.e., frequency corresponding to the glottal airflow) on subglottal pressure and tension imbalance in Fig. 7. Also plotted in the figure with dash-dot-dot lines are the eigenfrequencies of the soft vocal fold. Given the linear spring model used in the current study, both these lines are straight lines. In addition to the phonation cases, we also plot one pre-phonatory at a low subglottal pressure of 0.1 kPa. The small scale glottal flow oscillation for this case occur at a frequency corresponding to the lower eigenmode of the soft vocal fold, indicating that in the linear, pre-phonatory regime, the vocal fold vibrations are governed primarily by the dynamics of the soft vocal fold.
Figure 7.
Comparing the fundamental frequencies of glottal airflow and natural frequencies of two vocal folds in both asymmetric and symmetric cases.
For higher subglottal pressures, where large-scale phonatory vocal fold vibrations occur, we find that in general, the fundamental phonation frequency lies between the two eigenfrequencies of the softer vocal folds. This indicates that the dynamics of the vibration are determined by an entrainment of the two eigenmodes associated with the soft vocal fold. Furthermore, there is no clear trend in terms of frequency change with subglottal pressure for the various cases.
Interestingly, the case with α=0.7 is different from all the other cases and violates both these trends. The fundamental phonation frequency is significantly skewed toward the higher eigenfrequency so much so that the frequency for the Ps=1.0 kPa case coincides exactly with frequency of the second eigenmode of the soft vocal fold. Furthermore, for this tension imbalance, the phonation frequency also does not show a strict monotonic increase with subglottal pressure. The singular behavior of this case can be explained by noting that this is the only case among those studied here, where there is an overlap region, extending from 120Hz to 140Hz, between the entrainment regions of the two vocal folds. This common entrainment zone between the two vocal folds serves as a basin of attraction for the system, and drives the vibration to a frequency which lies within this zone. Consequently, this particular case defies the general trends observed in this study. Furthermore, this is yet another manifestation of the indirect effect of the normal vocal fold on the vibratory dynamics and the phonation frequency.
Period-doubling bifurcation
Period-doubling, which refers to a bifurcation wherein a system undergoing periodic limit-cycle oscillations changes to a state where the cycle has two peaks, is a ubiquitous phenomenon in non-linear dynamics. Thus, period-doubling is associated with the appearance of a subharmonic in the frequency spectra. Past studies of the dynamics of asymmetric vocal folds which have employed simple structural and∕or flow models have indicated that period-doubling bifurcations can occur in such configurations (Steinecke and Herzel, 1995). Subharmonics have also been detected in sound spectra (Herzel et al., 1995; Omori et al., 1997; Wilden et al., 1998) which might be indicative of period-doubling bifurcations. Strong subharmonics might also be implicated in diplophonia. It is therefore of interest to examine if such bifurcations are observed in the current study. The presence of a temporally and spatially complex aerodynamic forcing on the vocal-folds that occurs with the current full Navier-Stokes model, could possibly act to modify the bifurcation phenomena.
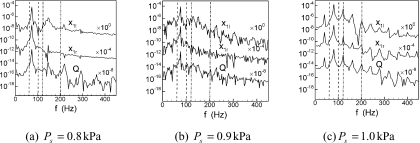
Examination of the computed cases shows that period-doubling does occur for the case with α=0.5. Figures 8a, 8b, 8c display the frequency spectra for this configuration for three subglottal pressures: Ps=0.8, 0.9 and 1.0 kPa. Furthermore, Fig. 9 shows phase-plane plots for the corresponding cases. For Ps=0.8 kPa, the spectra is dominated by a fundamental frequency and its superharmonics. This, along with the corresponding phase-plane plot in Fig. 9a indicates that the system is undergoing a fairly periodic, limit-cycle oscillation.
Figure 8.
The Fourier spectrum of displacement waveforms of each mass and the volume flow rate of glottal airflow for cases at α=0.5. (a) Ps=0.8 kPa, (b) Ps=0.9 kPa, (c) Ps=1.0 kPa.
Figure 9.
The phase portraits of x1l-x1r planes for cases at α=0.5. (a) Ps=0.8 kPa, (b) Ps=0.9 kPa, (c) Ps=1.0 kPa.
As the pressure is increased to 0.9kPa, there is a significant change in the dynamics of the system. While there is still a dominant fundamental frequency, the spectrum is noisier, and clear superharmonics can no longer be distinguished. There is also a roughly two-orders of magnitude increase in the energy at frequencies lower than the fundamental frequency. The corresponding phase-plane plot in Fig. 9b also shows that the limit-cycle that was present at the lower pressure has now devolved into a more complex orbit which consists of two loops with significantly cycle-to-cycle variability. As we will see presently, this case represents the onset of the period-doubling bifurcation and the observed dynamics are indicative of this transitional state. In fact, the cycle-to-cycle variations in Fig. 9a are indicative of the fact that even the lower pressure case shows some transitional features.
Further increase of Ps to 1.0kPa completes the period-doubling bifurcation and results in a new stable state. The spectra for this case show the clear presence of a subharmonic frequency and the spectra is dominated by the fundamental frequency, the subharmonic and linear combinations of the two. The phase-plane plot in Fig. 9c shows the classical double loop that is characteristic of a system that has undergone a period-doubling bifurcation and this behavior is similar to that observed by Steinecke and Herzel (1995) for a similar value of the tension imbalance parameter.
Conclusions
A computational model, which combines the Navier-Stokes equations and a two-mass vocal fold model, has been used to study the effect of vocal fold asymmetry associated with tension imbalance on phonation. The vibratory dynamics of the asymmetric vocal fold configuration are studied in the presence of complex glottal flow effects, which are enabled by the high fidelity Navier-Stokes based flow model employed here. The data from the simulations is analyzed in order to yield insights into the effects of tension imbalance on vocal-fold vibration and glottal jet dynamics and their implications for voice.
The simulations show that tension imbalance delays phonation offset to higher subglottal pressure and also increases the effort required to increase the intensity of sound. The simulations also suggest that for vocal folds with tension imbalance, incomplete glottal closure is one factor that is responsible for the “breathy” quality of voice usually associated with this type of pathology. The fundamental frequency of phonation is found to be governed by the properties of the soft vocal fold and usually results from the entrainment of the two fundamental eigenmodes of this vocal fold.
A variety of non-linear effects associated with tension imbalance are manifested in these simulations. Frequency ranges that overlap the entrainment regions of both vocal folds, act as basins of attractions and produce behavior that is different from cases where these overlap ranges do not exist. Increasing subglottal pressure is also found to result in a period-doubling bifurcation in one case with significant tension imbalance, indicating that such bifurcations occur despite the complicating effects of asymmetric flow and pressure in the glottis as well as the supraglottal region. Our future work in this arena is focusing on more realistic three-dimensional models with continuum based vocal-fold models.
ACKNOWLEDGMENTS
The project described was supported by Grant Number ROIDC007125 from the National Institute on Deafness and Other Communication Disorders (NIDCD). The content is solely the responsibility of the authors and does not necessarily represent the official views of the NIDCD or the NIH. This research was also supported in part by the National Science Foundation through TeraGrid resources provided by NICS under grant number TG-CTS100002.
References
- Alipour, F., and Titze, I. R. (1997). “Combined simulation of two-dimensional airflow and vocal fold vibration (A),” J. Acoust. Soc. Am. 102, 3204. 10.1121/1.420935 [DOI] [Google Scholar]
- Belafsky, P. C., Postima, G. N., Reulbach, T. R., Holland, B. W., and Koufman, J. A. (2002). “Muscle tension dysphonia as a sign of underlying glottal insufficiency,” Otolaryngol.-Head Neck Surg. 127, 448–451. 10.1067/mhn.2002.128894 [DOI] [PubMed] [Google Scholar]
- Berry, D. A., Herzel, H., Titze, I. R., and Story, B. (1996). “Bifurcations in excised larynx experiments,” J. Voice 10, 129–138. 10.1016/S0892-1997(96)80039-7 [DOI] [PubMed] [Google Scholar]
- Colton, R., and Casper, J. K. (1996). Understanding Voice Problems: A Physiological Perspective for Diagnosis and Treatment (Williams and Wilkins, Baltimore: ). [Google Scholar]
- de Oliveira Rosa, M., Pereira, J. C., Grellet, M., and Alwan, A. (2003). “A contribution to simulating a three-dimensional larynx model using the finite element method,” J. Acoust. Soc. Am. 114, 2893–2905. 10.1121/1.1619981 [DOI] [PubMed] [Google Scholar]
- de Vries, M. P., Schutte, H. K., Veldman, A. E. P., and Verkerke, G. J. (2002). “Glottal flow through a two-mass model: Comparison of Navier-Stokes solutions with simplified models,” J. Acoust. Soc. Am. 111, 1847–1853. 10.1121/1.1323716 [DOI] [PubMed] [Google Scholar]
- Herzel, H., Berry, D., Titze, I., and Steinecke, I. (1995). “Nonlinear dynamics of the voice: Signal analysis and biomechanical modeling,” Chaos 5, 30–34. 10.1063/1.166078 [DOI] [PubMed] [Google Scholar]
- Herzel, H., Berry, D., Titze, I. R., and Saleh, M. (1994). “Analysis of vocal disorders with methods from nonlinear dynamics,” J. Speech Hear. Res. 37, 1008–1019. [DOI] [PubMed] [Google Scholar]
- Ishizaka, K., and Flanagan, J. L. (1972). “Synthesis of voiced sounds from a two-mass model of the vocal cords,” Bell Syst. Tech. J. 51, 1233–1268. [Google Scholar]
- Ishizaka, K., and Isshiki, N. (1976). “Computer simulation of pathological vocal-cord vibration,” J. Acoust. Soc. Am. 60, 1193–1198. 10.1121/1.381221 [DOI] [PubMed] [Google Scholar]
- Jiang, J. J., and Zhang, Y. (2002). “Chaotic vibration induced by turbulent noise in a two-mass model of vocal folds,” J. Acoust. Soc. Am. 112, 2127–2133. 10.1121/1.1509430 [DOI] [PubMed] [Google Scholar]
- Jiang, J. J., Zhang, Y., and Stern, J. (2001). “Modeling of chaotic vibrations in symmetric vocal folds,” J. Acoust. Soc. Am. 110, 2120–2128. 10.1121/1.1395596 [DOI] [PubMed] [Google Scholar]
- Kelman, A. W. (1981). “Vibratory pattern of the vocal folds,” Folia Phoniatr. (Basel) 33, 73–99. 10.1159/000265581 [DOI] [PubMed] [Google Scholar]
- Luo, H., Mittal, R., and Bielamowicz, S. (2009). “Analysis of flow-structure interaction in the larynx during phonation using an immersed-boundary method,” J. Acoust. Soc. Am. 126, 816–824. 10.1121/1.3158942 [DOI] [PMC free article] [PubMed] [Google Scholar]
- Luo, H., Mittal, R., Zheng, X., Bielamowize, S., Walsh, R., and Hahn, J. (2008). “An immersed-boundary method for flow-structure interaction in biological systems with applications to phonation,” J. Comput. Phys. 227, 9303–9332. 10.1016/j.jcp.2008.05.001 [DOI] [PMC free article] [PubMed] [Google Scholar]
- Mittal, R., Dong, H., Bozkuittas, M., Najiar, F. M., Vargas, A., and Loebbecke, A. (2008). “A versatile sharp interface immersed boundary method for incompressible flows with complex boundaries,” J. Comput. Phys. 227, 4825–4852. 10.1016/j.jcp.2008.01.028 [DOI] [PMC free article] [PubMed] [Google Scholar]
- Omori, K., Kojima, H., Kakani, R., Slavit, D. H., and Blaugrund, S. M. (1997). “Acoustic characteristics of rough voice: Subharmonics,” J. Voice 11, 40–47. 10.1016/S0892-1997(97)80022-7 [DOI] [PubMed] [Google Scholar]
- Pelorson, X., Hirschberg, A., Hassel, R. R., Wijnands, A. P. J., and Auregan, Y. (1994). “Theoretical and experimental study of quasisteady-flow separation within the glottis during phonation. Application to a modified two-mass model,” J. Acoust. Soc. Am. 96, 3416–3431. 10.1121/1.411449 [DOI] [Google Scholar]
- Schwarz, R., Hoppe, U., Schuster, M., Wurzbacher, T., Eysholdt, U., and Lohscheller, J. (2006). “Classification of unilateral vocal fold paralysis by endoscopic digital high-speed recordings and inversion of a biomechanical model,” IEEE Trans. Biomed. Eng. 53, 1099–1108. 10.1109/TBME.2006.873396 [DOI] [PubMed] [Google Scholar]
- Steinecke, I., and Herzel, H. (1995). “Bifurcations in an asymmetric vocal-fold model,” J. Acoust. Soc. Am. 97, 1874–1884. 10.1121/1.412061 [DOI] [PubMed] [Google Scholar]
- Story, B. H. (2002). “An overview of the physiology, physics and modeling of the sound source for vowels,” Acoust. Sci. & Tech. 23, 195–206. 10.1250/ast.23.195 [DOI] [Google Scholar]
- Story, B. H., and Titze, I. R. (1995). “Voice simulation with a body-cover model of the vocal folds,” J. Acoust. Soc. Am. 97, 1249–1260. 10.1121/1.412234 [DOI] [PubMed] [Google Scholar]
- Tanabe, M., Isshiki, N., and Kitajima, K. (1972). “Vibratory pattern of the vocal cord in unilateral paralysis of the cricothyroid muscle: An experimental study,” Acta Oto-Laryngol. 74, 339–345. 10.3109/00016487209128460 [DOI] [PubMed] [Google Scholar]
- Tao, C., Jiang, J. J., and Zhang, Y. (2006). “Simulation of vocal fold impact pressures with a self-oscillating finite-element model,” J. Acoust. Soc. Am. 119, 3987–3994. 10.1121/1.2197798 [DOI] [PubMed] [Google Scholar]
- Tao, C., Zhang, Y., Hottinger, D. G., and Jiang, J. J. (2007). “Asymmetric airflow and vibration induced by the Coanda effect in a symmetric model of the vocal fold,” J. Acoust. Soc. Am. 122, 2270–2278. 10.1121/1.2773960 [DOI] [PubMed] [Google Scholar]
- Thomson, S. L., Mongeau, L., and Frankel, S. H. (2005). “Aerodynamic transfer of energy to the vocal folds,” J. Acoust. Soc. Am. 118, 1689–1701. 10.1121/1.2000787 [DOI] [PubMed] [Google Scholar]
- Titze, I. R. (1976). “On the mechanics of vocal-fold vibration,” J. Acoust. Soc. Am. 60, 1366–1380. 10.1121/1.381230 [DOI] [PubMed] [Google Scholar]
- Wilden, I., Herzel, H., Peter, G., and Tembrock, G. (1998). “Subharmonics, biphonation, and deterministic chaos in mammal vocalization,” Bioacoustics 9, 171–196. [Google Scholar]
- Wong, D., Ito, M. R., Cox, N. B., and Titze, I. R. (1991). “Observation of perturbations in a lumped-element model of the vocal folds with application to some pathological cases,” J. Acoust. Soc. Am. 89, 383–394. 10.1121/1.400472 [DOI] [PubMed] [Google Scholar]
- Zhang, C., Zhao, W., Frankel, S. H., and Mongeau, L. (2002). “Computational aeroacoustics of phonation, Part II: Effects of flow parameters and ventricular folds,” J. Acoust. Soc. Am. 112, 2147–2154. 10.1121/1.1506694 [DOI] [PubMed] [Google Scholar]
- Zhang, Y., and Jiang, J. J. (2005). “Spatiotemporal chaos in excised larynx vibrations,” Phys. Rev. E 72, 035201. 10.1103/PhysRevE.72.035201 [DOI] [PubMed] [Google Scholar]
- Zhao, W., Zhang, C., Frankel, S. H., and Mongeau, L. (2002). “Computational aeroacoustics of phonation, Part I: Computational methods and sound generation mechanisms,” J. Acoust. Soc. Am. 112, 2134–2146. 10.1121/1.1506693 [DOI] [PubMed] [Google Scholar]
- Zheng, X., Bielamowicz, S., Luo, H., and Mittal, R. (2009). “A computational study of the effect of false vocal folds on glottal flow and vocal folds vibration during phonation,” Ann. Biomed. Eng. 37, 625–642. 10.1007/s10439-008-9630-9 [DOI] [PMC free article] [PubMed] [Google Scholar]


