

Abstract
Photodynamic therapy (PDT) is a rapidly developing approach to treating cancer that combines harmless visible and near-infrared light with a nontoxic photoactivatable dye, which upon encounter with molecular oxygen generates the reactive oxygen species that are toxic to cancer cells. Bacteriochlorins are tetrapyrrole compounds with two reduced pyrrole rings in the macrocycle. These molecules are characterized by strong absorption features from 700 to >800 nm, which enable deep penetration into tissue. This report describes testing of 12 new stable synthetic bacteriochlorins for PDT activity. The 12 compounds possess a variety of peripheral substituents and are very potent in killing cancer cells in vitro after illumination. Quantitative structure–activity relationships were derived, and subcellular localization was determined. The most active compounds have both low dark toxicity and high phototoxicity. This combination together with near-infrared absorption gives these bacteriochlorins great potential as photosensitizers for treatment of cancer.
Introduction
Photodynamic therapy (PDTa) employs a nontoxic dye termed a photosensitizer and visible light, which in the presence of oxygen produces reactive oxygen species, such as singlet oxygen, superoxide, and hydroxyl radical.1 The reactive oxygen species produced during PDT are effective in killing both malignant and normal cells via necrosis, apoptosis, or autophagy depending on the cell type, structure of the photosensitizer, and the light parameters chosen.2-4 PDT has the advantage of dual selectivity in that the photosensitizer can be targeted to its destination cell or tissue, and in addition the illumination can be spatially directed to the lesion.
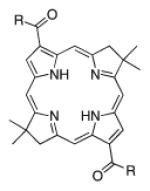
Bacteriochlorins are tetrapyrrole compounds with two opposing pyrroline (i.e., reduced pyrrole) rings. The ring structure occurs naturally in photosynthetic pigments (bacteriochlorophylls a and b) from purple photosynthetic bacteria of the orders Rhodospirillales and Rhizobiales.5 Reduction of two pyrrolic rings in the tetrapyrrole macrocycle has a pronounced effect on the absorption spectra. Bacteriochlorins and bacteriopurpurins have large absorption bands in the region of 720–850 nm where chlorins (one reduced ring) and porphyrins (no reduced rings) effectively do not absorb. The characteristic absorption of bacteriochlorins and bacteriopurpurins in the near-infrared spectral region is considered to be ideal for maximizing light penetration through tissue because both absorption and scattering of light at these wavelengths by endogenous entities are minimal.
During the past decade, several naturally derived bacteriochlorins have been evaluated for PDT and some of them have shown significant in vivo efficacy. The most frequently employed bacteriochlorin for PDT has been the Pd-containing bacteriopheophorbide derivative known as TOOKAD, padoporfin, or WST09 that is in clinical trials for prostate cancer.6 A related water-soluble Pd-bacteriochlorin derivative called WST11 has been tested for PDT of mouse melanoma xenografts.7 A recent report has shown that the application of bacteriochlorin p6 is effective for in vitro and in vivo treatment of radiation-induced fibrosarcoma (RIF) tumors.8
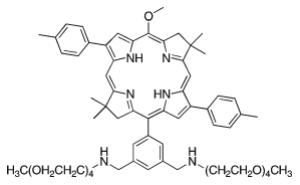
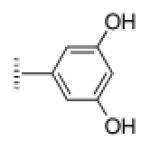
Unfortunately, stable bacteriochlorins and bacteriopurpurins are notoriously difficult to synthesize from porphyrins or other chlorin intermediates. Many naturally occurring and naturally derived bacteriochlorins tend to be unstable in the presence of oxygen and light, and are rapidly converted to chlorins and porphyrins. To overcome these limitations, we developed a de novo synthetic pathway to stable bacteriochlorins.9 A key design feature of the synthetic bacteriochlorins is the use of a geminal dimethyl group in each reduced pyrroline ring (Table 1). This geminal dimethyl group in the pyrroline rings locks in the bacteriochlorin chromophore and precludes dehydrogenation or tautomerization processes, thereby affording a stable macrocycle. However in addition to good optical absorption properties and stability, it is necessary for a photosensitizer to also possess the appropriate molecular structure that will optimize the uptake, subcellular localization, and PDT-induced toxicity to cancer cells. To this end, the synthesis is compatible with a variety of groups including aryl, alkyl, and halo substituents.9-11 The introduction of halo substituents affords building blocks that can be derivatized with peripheral groups that are cationic, anionic, lipophilic, or amphipathic.10,12,13 Furthermore, the synthesis also affords the ability to incorporate auxochromes that allow tuning of the position of the long-wavelength absorption band from ~700 to ~800 nm (with substituents tested to date).14 Taken together, the chemical robustness of the synthetic bacteriochlorins and the versatility of the synthesis provide access to the desired features of wavelength tunability and substituent tailorability (e.g., lipophilicity, molecular asymmetry) needed for PDT applications.
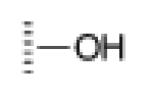
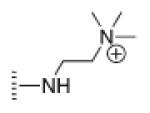
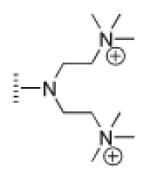
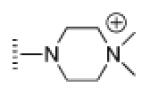
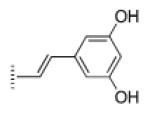
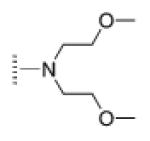
Table 1.
Chemical Structures of Bacteriochlorinsa
| Cmpd | ||
|---|---|---|
| 1 |
|
|
| 2 |
|
|
|
| ||
| 3 |
|
|
| 4 |
|
|
| 5 |
|
|
| 6 |
|
|
|
| ||
| 7 |
|
|
| 8 |
|
|
| 9 |
|
|
| 10 |
|
|
| 11 |
|
|
| 12 |
|
|
Iodide counterions for cationic compounds omitted for clarity.
The goal of the present study was to test a group of 12 previously synthesized bacteriochlorins9-13 (Table 1) with varying peripheral substituents as photosensitizers for killing HeLa human cervical cancer cells and to deduce quantitative structure–function relationships. Various physicochemical properties of the molecules were also characterized to aid in the analysis of the PDT activity.
Results and Discussion
Molecular Characteristics and log P Values
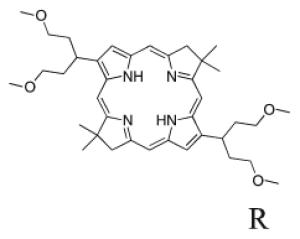
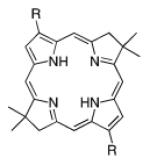
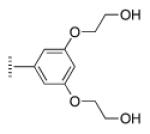
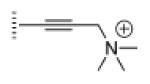
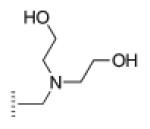
A de novo synthetic pathway to bacteriochlorins that contain a geminal dimethyl group in each pyrroline ring was recently developed.9 This structural attribute blocks adventitious dehydrogenation and thereby affords a stable macrocycle. This synthetic route has provided the foundation for the preparation of the 12 bacteriochlorins, which are shown in Table 1. The 12 compounds encompass a range of polarity that extends from rather lipophilic (1, 2, 12) to more amphipathic (3, 4, 6, 11) to polar (5, 7, 8, 9, 10). This set of compounds is valuable for examination of structure–activity relationships. Bacteriochlorin 1 contains two 3,6,9,12-tetra-oxatridecylamine groups, while bacteriochlorins 2 and 12 contain symmetrically branched 1,5-dimethoxypentyl groups for solubility in lipophilic environments. Bacteriochlorins 3, 4, 6, and 11 each contain four hydroxyl groups. Bacteriochlorins 4 and 11 each have four phenolic hydroxyl groups, whereas the hydroxyl groups are attached to more flexible alkyl chains in bacteriochlorins 3 and 6. The hydroxyl groups are placed closest to the macrocycle in bacteriochlorin 4 and farthest from the macrocycle in bacteriochlorin 3. The cationic bacteriochlorins contain either two positive charges (5, 8, 10) or four positive charges (9). Bacteriochlorins 5 and 10 have substituents that are structurally more rigid than the substituents on bacteriochlorins 8 and 9. In comparison to the cationic bacteriochlorins (5, 8, 9, 10), bacteriochlorin 7 is expected to be anionic at physiological pH.
The measured partition coefficient (mLogP) values for relative solubility in octanol versus water were obtained experimentally by the stir-flask method, and the values were also calculated (cLogP) on the basis of the bacteriochlorin structure. A positive versus negative log P value reflects preferential solubilization in the octanol versus water phases, respectively. For bacteriochlorins 1–4, 11, and 12 there was no observable amount of bacteriochlorin in the water layer. The cationic bacteriochlorins 8–10 exhibited negative mLogP values, whereas the cationic bacteriochlorin 5 gave a mLogP value of 0.9. Bacteriochlorins 6 and 7 had mLogP values of 2.3 and 1.4, respectively. The mLogP and cLogP values are listed in Table 2.
Table 2.
Properties of Bacteriochlorins
| Qy(0,0)f absorption |
Qy(0,0)f fluorescence |
orbital energy |
|||||||||||||
|---|---|---|---|---|---|---|---|---|---|---|---|---|---|---|---|
| compd | LD50a (nM) |
mlogPb | clogP c | uptaked (nmol/mg) |
SF/unit uptakee (nmol/mg) |
λ (nm) |
fwhm (nm) |
λ (nm) |
fwhm (nm) |
Θ fg |
τSh (ns) |
i |
τTj (μs) |
HOMO (eV) |
LUMO (eV) |
| 1 | 500 | ≥2.2 | 9.3 ± 1.6 | 3.9 | 0.1 | 732 | 21 | −4.39 | −2.20 | ||||||
| 2 | 100 | ≥2.5 | 6.9 ± 1.5 | 11.7 | 0.02 | 717 | 13 | 722 | 20 | 0.093 | 4.0 | 0.51 | 189 | −4.36 | −2.12 |
| 3 | 15 | ≥2.2 | 4.7 ± 1.5 | 10.4 | 0.001 | 732 | 19 | 738 | 24 | 0.15 | 3.0 | 0.55 | 159 | −4.44 | −2.26 |
| 4 | 80 | ≥2.5 | 6.8 ± 1.5 | 13.5 | 0.01 | 732 | 21 | 737 | 26 | 0.12 | 3.7 | 0.52 | 190 | −4.46 | −2.28 |
| 5 | 2000 | 0.9 | 4.2 ± 1.7 | 8.2 | 0.6 | 749 | 16 | 754 | 22 | 0.11 | 3.8 | 0.51 | 104k | −4.77 | −3.31 |
| 6 | 100 | 2.3 | 4.8 ± 1.5 | 8.2 | 0.04 | 718 | 18 | 724 | 23 | 0.095 | 3.8 | 0.53 | 190 | −4.42 | −2.19 |
| 7 | 4000 | 1.4 | 5.6 ± 1.7 | 0.72 | 0.35 | 734 | 26 | 742 | 19 | 0.077 | 3.7 | 0.56 | 70 | −4.86 | −2.77 |
| 8 | 3000 | −0.5 | −1.1 ± 1.7 | 7.7 | 0.88 | 742 | 23 | 750 | 25 | 0.13 | 4.0 | 0.48 | 77k | −4.72 | −3.34 |
| 9 | 800 | −1.4 | −5.3 ± 1.7 | 1.8 | 0.9 | 729 | 19 | 735 | 24 | 0.12 | 3.5 | 0.53 | 54l | −5.04 | −3.89 |
| 10 | 800 | −1.0 | −1.0 ± 1.8 | 1.8 | 1 | 731 | 21 | 740 | 28 | 0.12 | 3.8 | 0.50 | 100k | −4.62 | −2.45 |
| 11 | 200 | ≥1.8 | 7.6 ± 1.7 | 1.8 | 0.23 | 781 | 35 | 800 | 40 | 0.021 | 3.4 | 0.66 | 78 | −4.72 | −2.74 |
| 12 | 60 | ≥1.9 | 2.8 ± 1.7 | 15.0 | 0.02 | 727 | 20 | 733 | 27 | 0.10 | 3.3 | 0.57 | 105 | −4.68 | −2.51 |
Values taken from Figure 3.
Measured value of log P.
Calculated value of log P.
Values taken from Figure 3 and applied to a bacteriochlorin concentration of 20.5 μM.
Survival fraction at uptake of 0.3 nmol/(mg protein). The values are taken from Figures 2 and 3 by determining the bacteriochlorin concentration in the incubation medium necessary to produce a cell uptake of 0.3 nmol/(mg protein) and then determining the survival fractions at these bacteriochlorin concentration values after 10 J/cm2 light was delivered.
Peak wavelength (λ) and full width at half-maximum (fwhm) of spectral feature for compound in aerated methanol unless indicated otherwise.
Fluorescence quantum yield for compound in Ar-purged methanol.
Lifetime of the lowest singlet excited state for compound in Ar-purged methanol determined using fluorescence detection.
Yield of the lowest triplet excited state determined using the expression , with kic = (10 ns)−1.
Lifetime of the lowest triplet excited state for the compound in Ar-purged 2-methyltetrahydrofuran unless indicated otherwise.
In freeze–pump–thaw degassed methanol.
In freeze–pump–thaw degassed ethanol.
The mLogP and cLogP values are plotted against one another in Figure 1A. The linear correlation is good (R2=0.78) but not perfect. Because of the lack of a perfect correlation, a quantitative structure–activity relationship (QSAR) was constructed for each of the experiment-derived parameters that reflect PDT effectiveness (LD50, cellular uptake, PDT toxicity per unit uptake) against both cLogP and mLogP. The results of the QSAR studies along with the photophysical and molecular-orbital characteristics described next give insights into the factors most important for the relative PDT effectiveness of the diverse bacteriochlorins shown in Table 1.
Figure 1.

(A) Octanol–water partition coefficients. Calculated log P (cLogP) versus measured log P (mLogP). The line is a linear least-squares fit with an R2 value of 0.78. The data used to construct this plot are given in Table 2. The values of mLogP are lower limits for compounds 1, 2, 3, 4, 11, and 12. (B) Absorption spectra. Data are shown for representative bacteriochlorins in methanol at 295 K.
Photophysical Properties
Each compound studied herein exhibits a characteristic bacteriochlorin absorption spectrum,15 with a broad near-UV Soret feature and a near-infrared Qy band of comparable intensity. Representative spectra (for bacteriochlorins 3, 4, and 11 in methanol) are shown in Figure 1B. The wavelength tunability of synthetic bacteriochlorins obtained via functionalization of the 3- and 13-position has been described previously.14 The Qy(0,0) absorption maximum of 1–12 in methanol ranges from 717 to 781 nm, and in each case the Qy(0,0) fluorescence peak is bathochromically shifted by ≤10 nm (Table 2). The fluorescence quantum yields of these bacteriochlorins are typically 0.09–0.12. The lifetimes of the lowest singlet excited state are in the range 3–4 ns, and the lifetimes of the lowest triplet excited state are in the range 50–190 μs (both in the absence of oxygen). The triplet lifetimes are reduced to <1 μs in the presence of atmospheric oxygen, indicating facile excitedstate quenching. The yields of the lowest triplet excited state determined using a reference technique16 for 1–12 (Table 2) have an average value of 0.52 ± 0.02. This value is similar to 0.54 for bacteriopheophytin a.17 Overall, these results indicate that significant differences in phototoxicity of the bacteriochlorins must stem primarily from sources other than the lifetime and yield of the triplet excited state (from which the reactive oxygen species is produced).
Molecular Orbital Characteristics
The energies of the highest occupied molecular orbital (HOMO) and lowest unoccupied molecular orbital (LUMO) of each bacteriochlorin were obtained from DFT calculations. Table 2 shows that the HOMO energy becomes more negative along the following series: 2 (−4.36 eV)>1 (−4.39 eV)>6 (−4.42 eV) > 3 (−4.44 eV) > 4 (−4.46 eV) > 10 (−4.62 eV) > 12 (−4.68 eV)>8 (−4.72 eV) ~ 11 (−4.72 eV)>5 (−4.77 eV)>7 (−4.86 eV)>9 (−5.04). Along this series, the bacteriochlorins will be progressively harder to oxidize. Table 2 also shows that the LUMO energy becomes more negative along the following series: 2 (−2.12 eV)>1 (−2.20 eV)>6 (−2.19 eV) >3 (−2.26 eV)>4 (−2.28 eV)>10 (−2.45 eV)>12 (−2.51 eV)>11 (−2.74 eV)>7 (−2.77 eV)>5 (−3.31 eV)>8 (−3.34 eV)>9 (−3.89). Along this series, the bacteriochlorins will be progressively easier to reduce.
A prior study of a series of zinc chlorins showed excellent linear correlations between the calculated orbital energies and measured redox potentials, with a shift in the HOMO or LUMO energy of 100 meV giving a shift in the oxidation or reduction potential on the order of 100 mV.18 These findings suggest that differences in oxidation and/or reduction potentials among the bacteriochlorins studied here may be substantial. One caveat is that the redox properties of a bacteriochlorin may differ considerably depending on the subcellular localization site. The second caveat is that the triplet excited state (T1) redox potentials will differ from those for the ground state (S0) by the T1–S0 energy gap, which typically will vary similarly to the S1–S0 energy gaps derived from Qy(0,0) spectral positions (Table 2).
With these considerations in mind, several points can be made. In a comparison of bacteriochlorins bearing aromatic alcohols, 11 will be harder to oxidize and easier to reduce than 4, which in turn has similar redox properties to 3. Carboxylic acid containing 7 should have redox properties comparable to 11. Positively charged bacteriochlorins 5 and 8 will have redox properties similar to one another and oxidation potentials comparable to 11 but will be be considerably easier to reduce than 11. These anticipated differences in redox properties for this subset of compounds studied (3 > 4>11>5>8>7), or the entire set (1–12), show no general correlation with the relative PDT activities discussed below. The only possible connection is that among similar bacteriochlorins (e.g., those bearing aromatic alcohols), compounds that should be easier to oxidize and harder to reduce tend to have higher activity (e.g., 3 versus 11).
Redox and photophysical properties contribute substantially to the photochemical mechanisms (type I versus type II) of PDT activity.19,20 The results described above indicate that these properties do not track activity (redox) or do not change substantially (photophysics) for the 12 bacteriochlorins and thus contribute only marginally if at all to the observed differences in phototoxicity described below.
In Vitro PDT on HeLa Cells
The best way to compare the phototoxicity of a group of photosensitizers having very different potencies is to vary the concentration over several orders of magnitude and determine the cell survival fraction with and without a single light dose. The results of such studies are shown in Figure 2. The results allow a LD50 concentration (in nM or μM) to be calculated after 10 J/cm2 of 732 nm laser (780 nm LED for 11) is delivered. The order of effectiveness for PDT activity was as follows: 3>12>4>6 ~ 2>11>1>10 ~ 9>5>8>7 (Table 2). The most active compounds have LD50 values of 100 nM or less (3, 12, 4, 6, 2). The compounds with intermediate activity have LD50 values between 100 nM and 1 μM(11, 1, 10, 9). The least active compounds have LD50 values greater than 1 μM (5, 8, 7). The relative order of effectiveness for dark toxicity (cell toxicity with no light) was 6 ~ 5>3 ~ 1 ~ 2 ~ 12 ~ 8>4>7 ~ 11 ~ 10 ~ 9. Note that dark toxicity is very minor for all compounds with only 5 and 6 approaching a 50% toxicity level at 10 μM (Figure 2). Thus, some of the most PDT-active compounds (e.g., 4 and 12) also have about the lowest dark toxicity.
Figure 2.

In vitro PDT toxicity. HeLa cells were incubated with concentrations of bacteriochlorin ranging from 10 nM to 10 μM for 24 h in complete medium followed by exposure (light) or not (dark) to 10 J/cm2 of a 732 nm laser (780 nm LED for 11). MTT assay was carried out 24 h later, and survival fractions are relative to untreated controls. Error bars are standard deviation of results from six wells.
The QSAR between LD50 (in nM) and cLogP is shown in Figure 3A and with mlogP in Figure 3B. There is no obvious correlation between LD50 and cLogP, but an inverted parabolic relationship with mLogP is apparent. There is a minimum in PDT activity at a mLogP value of about +0.5. There is a small increase in activity as mLogP becomes less positive than +0.5 and then changes sign (and takes on values near −1). There is a substantial and steep increase in activity as mLogP becomes more positive than +0.5 and takes on values of +2 or greater. This parabolic shape is inverted from that found in a prior QSAR study.21 In that investigation, a series of pyropheophorbides substituted with alkyl ether groups were used to kill RIF-1 tumor cells after illumination. That study revealed instead a maximum in PDT activity at a certain cLogP value (about +6.0) and showed progressively lower activities on either side (cLogP values approaching +4.5 and +8.5).
Figure 3.

Quantitative structure–activity relationship (QSAR) plots: (A) LD50 versus cLogP; (B) LD50 versus mLogP; the curve is a nonlinear-least-squares fit of the data using the function y=y0+(2A/π)[w/(4(x − xc)2+w2)] with a goodness of fit parameter R2= 0.46; (C) uptake versus cLogP; the linear fit has R2 = 0.046; (D) uptake versus mLogP; the linear fit has R2=0.20; (E) cell survival per unit uptake versus cLogP; the linear fit has R2=0.61; (F) cell survival per unit uptake versus mLogP; the linear fit has R2=0.94. Note that for panels B, D, and F, the values of mLogP are lower limits for compounds 1, 2, 3, 4, 11, and 12 (see Table 2).
How can the disparate inverted shapes found here (Figure 3B) and in the previous study21 be explained? The answer must lie in the substantial differences between the two studies. For example, the prior study employed a homologous series of pheophorbides in which only the length of the alkyl chain on the ether substituent was varied (the other functional groups and the tetrapyrrole backbone remained unchanged). On the other hand, in the present study the series of bacteriochlorins differ in the use of alcohols, phenols, ethers, carboxylic acids, and groups containing quaternized and tertiary nitrogen atoms as macrocycle substituents. One could speculate that if the compounds had been even more hydrophobic (higher log P values), the curve may turn around and tend upward again (reflecting a decrease in PDT activity) as the log P approached +8.5 as found in the pheophorbide study.21 There are also differences in the range of charge on the photosensitizers that influence localization, as discussed below. An additional difference between the two studies is the use of different cell lines, RIF-1 cells in the Henderson study21 and HeLa cells in the present study.
Cellular Uptake
Figure 4 plots the uptake values (in nmol of bacteriochlorin per mg of cell protein) versus concentration of the 12 bacteriochlorins. These values were determined after a 24 h incubation with the bacteriochlorin having a concentration between 10 nM and 20.5 μM in complete medium. The relative order of uptake measured at the highest concentration (20.5 μM) is as follows: 12>4>2>3>5>6>8>1 ~ 9 ~ 10>7. The highest uptake was found for the tetrakis-amide-ether 12, followed by the phenolic 4, ether 2, and hydroxy-containing bacteriochlorin 3. Intermediate uptake levels were found for the bis-cationic compounds 5 and 8 and the amino alcohol 6. Low to intermediate uptake was found for the PEGylated 1, while the tetrakis-cationic 9, bis-cationic 10 and the conjugated phenol 11 all had low uptake, and the di-carboxylic acid 7 had the lowest uptake.
Figure 4.

Uptake into cells. HeLa cells were incubated with concentrations of bacteriochlorin ranging from 100 nM to 120 μM for 24 h in complete medium. Cells were dissolved in SOLVABLE. Fluorescence was quantified and compared with 12 separate calibration curves and protein in cell extract measured. Results are expressed in nmol of bacteriochlorin per mg of cell protein.
Greater cellular uptake of a photosensitizer frequently correlates with higher levels of phototoxicity.22 The uptake of tetrapyrrole compounds into cells is thought to be largely governed by the relative lipophilicity as reflected in their relative log P values.23 The proviso here is that extremely lipophilic compounds may aggregate in aqueous culture medium, with the consequences that (i) these aggregates may be too large to diffuse through plasma membranes and (ii) even if it is possible that aggregates could be taken up by endocytosis, their aggregated state may markedly reduce their photodynamic activity. Therefore, there is an optimum log P value at which photosensitizer diffusion into lipid bilayers is maximized without undue aggregation, and therefore cellular uptake is maximized.21
Cellular uptake of the bacteriochlorins is plotted against cLogP in Figure 3C and against mLogP in Figure 3D. Although the linear correlations are poor for both parameters, they are somewhat better for mLogP than for cLogP. This observation can be explained by the tendency of tetrapyrroles to aggregate in media in which they are not highly soluble. Such intermolecular interactions between photosensitizers are taken into account in the mLogP value. Thus, this measured quantity is a more accurate measure of the actual degree of hydrophobicity and is preferable for correlating with PDT activity than cLogP, which is derived from an isolated gas-phase molecule. However, even the mLogP value may not truly reflect the full set of characteristics that the bacteriochlorin possesses that affect uptake and localization. For example, there may be specific electrostatic interactions between the charged groups on the photosensitizer and species or sites in the cells that are not reflected in the tendency of the bacteriochlorin to solubilize in octanol versus water.
Subcellular Localization
Three of the bacteriochlorins with different structural features were examined using confocal microscopy. For these studies the bacteriochlorin was co-incubated with green-fluorescent probes specific for lysosomes (LysoTracker), mitochondria (MitoTracker), or endoplasmic reticulum (ER-Tracker). The overlaid images are shown in Figure 5A, where the fluorescence of the bacteriochlorin is shown in red and the fluorescence of the organelle-specific probe is shown in green. The lipophilic 4 (high mLogP and cLogP values) can be seen to have a high degree of localization in endoplasmic reticulum and, to a slightly lower extent, in mitochondria, whereas no overlap was detectable with the lysosomal probe. By contrast, the bis-cationic 8 with low lipophilicity (negative mLogP and cLogP values) shows the most overlap with the lysosomal probe and hardly any overlap with probes for mitochondria and endoplasmic reticulum. Note that the red (bacteriochlorin) fluorescence is lower for 8 (Figure 5), which is consistent with its low cell uptake (Table 2). Bacteriochlorin 6, which is moderately lipophilic with two basic nitrogen atoms, showed good overlap with lysosomal and endoplasmic reticulum probes and no detectable overlap with the mitochondrial probe.
Figure 5.

(A) Fluorescence microscopy. HeLa cells were incubated with 1 μM bacteriochlorin (4, 6, or 8) for 24 h, washed, and 5 μg/mL of (i) LysoTracker green, (ii) MitoTracker green, or (iii) ER-Tracker green was added and incubated for 30 min. Confocal fluorescence microscopy images are shown with overlaid tracker fluorescence (515 ± 10 nm, green false color) and bacteriochlorin fluorescence (>580 nm, red false color). Scale bar =50 μm. (B) Time-course. HeLa cells were incubated with 0.5 μM 4, 6,or 8 for various times, and 10 J/cm2 of 732 nm light was delivered. Dark controls received the photosensitizer but no light. MTT assay was carried out after 24 h to establish differences in toxicity.
Intracellular localization of the photosensitizer is considered to be important for maximizing PDT-mediated cell toxicity.24 In this regard, the accumulation of the photosensitizer in certain specific organelles (mitochondria and endoplasmic reticulum) is thought to lead to more efficient triggering of cell death upon illumination.25 On the other hand, accumulation in other locations (lysosomes and plasma membrane) that are not thought to be as sensitive to photodamage tends to lessen PDT efficiency.26 It is noted that the specific localization of the photosensitizer within the cell can change according to the incubation time,27,28 and indeed, so can the aggregation state.29
The high subcellular localization of bacteriochlorin 4 in endoplasmic reticulum and mitochondria, of 6 in the endoplasmic reticulum (and lysosomes), and of 8 predominantly in lysosomes correlates with the finding that both 4 and 6 are much more active than 8. This connection supports the hypothesis that both the mitochondria and the endoplasmic reticulum are highly sensitive sites for photodamage while lysosomes are less sensitive to PDT effects. The destruction of mitochondria and the change in mitochondrial membrane potential have been shown to correlate with induction of apoptosis by PDT agents, while PDT in endoplasmic reticulum leads to stress in this organelle and triggers several independent adaptive responses collectively referred to as unfolded protein response. The function of this response is to reestablish protein homeostasis and normal endoplasmic reticulum function, and its failure can lead to tumor cell death.30 We carried out time-course experiments in order to study the incubation period needed to effectively exert PDT toxicity. As can be seen in Figure 5B, 4 had the most rapid toxicity followed by 6 while 8 needed the longest incubation times. The presented time-course results suggest that selected bacteriochlorins could act at a much shorter incubation time point than the 24 h used in the main study and provide additional evidence of their possible behavior in an in vivo setting.
Molecular charge is an important determinant in subcellular localization of photosensitizers and also determines to which proteins inside particular cellular organelles specific photosensitizers can bind. In this regard, the variation in the chemical/electronic nature of the bacteriochlorin substituents utilized here is sufficiently large that both cLogP and mLogP span negative to positive values (Table 2 and Figure 3A,B). This switch reflects a preference for the molecule to reside in a hydrophobic versus hydrophilic environment, respectively. In comparison, in the prior study21 described above, the cLogP values of the substituted bacteriophorbides were all sufficiently positive (+4.5 to +8.5) that the molecules had an overall hydrophobic nature for all the substituents employed. This factor likely contributes to the differences in the QSAR results between the two studies.
PDT Toxicity per Unit uptake
Several factors described above influence the relative effectiveness of the bacteriochlorins (like any photosensitizer) in mediating PDT toxicity. In order to remove the cellular-uptake contribution, a new parameter denoted the “survival fraction per unit uptake” was obtained. The values were derived from data in Figures 2 and 3 by determining the concentration in the incubation medium necessary to produce a cell uptake of 0.3 nmol of bacteriochlorin per mg of protein and then determining the survival fractions at these bacteriochlorin concentrations after 10 J/cm2 light was delivered. The numerical results are given in Table 2, and the associated QSAR plots against cLogP and mLogP are given in Figure 3E and Figure 3F, respectively. The correlation of PDT toxicity per unit uptake with mLogP is markedly better (R2=0.94) than with cLogP (R2 = 0.61). However, in both cases, the correlations are better than those for LD50 versus cLogP and mLogP (Figure 3A and Figure 3B).
Once the variation in cell uptake of different photosensitizers has been normalized by calculating PDT toxicity at the same uptake level, variations in the effectiveness of the photosensitizers can be due to two remaining factors: (i) differences in subcellular localization (mitochondria, endoplasmic reticulum, Golgi apparatus, lysosomes, etc.) and (ii) differences in photochemical mechanism (type I or type II). In principle hydrophobicity (or log P) could directly affect both these factors. More hydrophobic photosensitizers are localized in regions with high lipid bilayer content (mitochondria and endoplasmic reticulum) where PDT-induced damage to these organelles is likely to cause cell toxicity. Moreover, hydrophobic photosensitizers, when in an aqueous environment, may have a higher tendency to undergo type I photochemistry and produce species such as hydroxyl radicals that are highly toxic to cells. In contrast hydrophilic photosensitizers may be localized in less sensitive organelles such as lysosomes and may tend to produce more singlet oxygen. Taking these considerations into account, the excellent (R2=0.94) correlation between phototoxicity per unit uptake and mLogP (Figure 3F) can be understood. Compounds such as 2, 3, 4, 6, and 12 with alcohol, phenol, or ether groups display high values of phototoxicity per unit uptake, while charged compounds 5, 8, 9, and 10 tend to have much lower values.
Conclusions
Twelve bacteriochlorins were designed and studied to probe electronic and chemical attributes that are likely to impact PDT activity. The results demonstrate that a number of these bacteriochlorins are extremely active photosensitizers. They are capable of killing cancer cells in nanomolar concentrations (even as low as 15 nM) when combined with modest fluences (10 J/cm2) of near-infrared (732 or 780 nm) light. It is noted that all experiments were carried out under normal atmospheric oxygen concentrations and that the PDT effect may be reduced at lower oxygen tensions such as those found in tumors. The combination of high PDT activity with the good tissue-penetrating properties of near-infrared light suggests that these compounds should be further tested in PDT especially for tumor types such as melanoma, against which traditional photosensitizers do not perform well.
Materials and Methods
Bacteriochlorins and log P Values
The 12 known bacteriochlorins were synthesized as previously described.9-13,31 The purity of the bacteriochlorins was determined in the original publications by multiple methods employed in combination. These methods include (low-resolution) laser desorption mass spectrometry, (high-resolution) electrospray mass spectrometry, 1H and 13C NMR spectroscopy, UV–visible absorption spectroscopy, fluorescence spectroscopy, and thin-layer chromatography. In all cases the purity was estimated to be ≥95%. The compounds had substituents as follows: p-tolyl and oligoethylene glycol (1),9,12 branched alkyl chains (“swallowtail”) (2),11 3,5-bis(2-hydroxyethyloxy)phenyl (3),10 3,5-dihydroxyphenyl (4),10 propargyl trimethylammonium (5),10 N,N-bis(2-hydroxyethyl)-amino (6),10 carboxylic acid (7),10 quaternized tetraalkylammonium units attached via amides (8–10),10 a chalcone bearing 3,5-dihydroxy substituents (11),13 and an amide bearing N,N-bis-(2-methoxyethyl) groups (12).10
A mixture of 2 mL of octanol and 2 mL of water in a 20 mL scintillation vial was stirred at room temperature for 3 h. Then less than 0.5 mg of bacteriochlorin was introduced. Stirring was continued at room temperature at 100–200 rpm for 24 h. The mixture was allowed to stand for 30 min to allow separation of the phases. A 30 μL aliquot of each phase was placed in 3.0 mL of dimethyl sulfoxide (DMSO), and the absorption spectrum of each phase was measured. The ratio of the peak intensity of the near-infrared feature, the Qy(0,0) band, for the two phases (octanol/water) was calculated. When there was no detectable amount of bacteriochlorin in a given phase, the noise level (A=0.001) was used as the limiting reading and the log P value was bounded accordingly; these measured quantities are hereafter denoted mLogP values. The values were also calculated on the basis of the bacteriochlorin structure using ACD Labs (Toronto, Canada) software, version 11.01; these calculated quantities are hereafter denoted cLogP values.
Photophysical Measurements
Photophysical measurements were performed as described previously.16 Measurement of the fluorescence (Φf) and triplet-excited-state (Φisc) quantum yields and singlet (τS) and triplet (τT) lifetimes utilized Ar-purged solutions (methanol or 2-methyltetrahydrofuran) except that the triplet lifetimes for 5, 8, and 10 in methanol and 9 in ethanol utilized rigorously degassed (by five freeze-pump-thaw cycles) solutions. The Φf values were determined with respect to 8,8,18,18-tetramethylbacteriochlorin14 in Ar-purged toluene, for which Φf=0.125 was established with respect to chlorophyll a in benzene (Φf=0.325 32) and free base tetraphenylporphyrin in toluene (Φf=0.090 33) using Soret and Qx excitation. Triplet yields for all the bacteriochlorins were determined using a reference technique in order to facilitate comparisons.16 First, the Φisc values for 2 (0.58), 4 (0.41), and 9 (0.57) were measured. For each of these three compounds, this value along with the respective Φf and τS (Table 2) was used to obtain the rate constant for internal conversion of the lowest singlet excited state to the ground state (kic) via the expression kic = (τS)−[1 − Φf − Φisc]. The resulting values of kic for 2, 4, and 9 are (12.2 ns)−1, (7.7 ns)−1 and (11.4 ns)−1, respectively. The average value of (10 ns)−1 was used to obtain the triplet yield for each of the twelve bacteriochlorins using the expression (Table 2).
Molecular Orbital Calculations
Density functional theory (DFT) calculations were performed with Spartan '06 for Windows (Wavefunction, Inc.) using the hybrid B3LYP functional, 6-31G* basis set, and equilibrium geometries fully optimized using the default program parameters.34
Cell Culture
A human cervical cancer cell line, HeLa,35 was obtained from ATCC (Manassas, VA). The cells were cultured in RPMI medium with l-glutamine and NaHCO3 supplemented with 10% heat-inactivated fetal bovine serum, penicillin (100 U/mL) (Sigma, St. Louis, MO) at 37 °C in 5% CO2-humidified atmosphere in 75 cm2 flasks (Falcon, Invitrogen, Carlsbad, CA). When the cells reached 80% confluence, they were washed with phosphate buffered saline (PBS) and harvested with 2 mL of 0.25% trypsin–EDTA solution (Sigma). Cells were then centrifuged and counted in trypan blue to ensure viability and plated at a density of 5000/well in flat-bottom 96-well plates (Fisher Scientific, Pittsburgh, PA).
Light Sources
Two different light sources were used for these studies. For all bacteriochlorin compounds except 11 a 732 nm laser source (732/6 Diode Laser, Pharmacyclics, Sunnyvale, CA) was used. A lens was used to give a uniform spot of 2.5 cm in diameter with an irradiance of 130 mW/cm2 as measured with a power meter (model DMM 199 with 201 standard head, Coherent, Santa Clara, CA). For bacteriochlorin 11, a LED array (780 ± 15 nm) fitted with a heat sink and lens (Marubeni Corp, Santa Clara, CA) was used and gave a spot of 3 cm in diameter with an irradiance of 50 mW/cm2.
In Vitro PDT Studies
After cells had grown for 24 h, dilutions of bacteriochlorins 1–12 were prepared in complete RPMI medium containing 10% serum and 100 U/mL penicillin/100 μg/mL streptomycin, and they were added to the cells at 0.001–10 μM concentrations for an additional 24 h incubation. The highest DMSO concentration in the medium did not exceed 0.2%. The medium was replaced with fresh complete medium, and 10 J/cm2 of illumination was delivered. The light spot covered four wells, which were considered as one experimental group illuminated at the same time. Control groups were as follows: no treatment, light alone, and bacteriochlorin alone (at the same dilution used for PDT experiments). For time-course incubation studies the bacteriochlorins 4, 6, and 8 at 0.5 μM were incubated with HeLa cells for various times and subsequently PDT with 10 J/cm2 of 732 nm light was delivered. Following PDT treatment the cells were returned to the incubator overnight and a 4 h MTT assay36-39 was carried out the next day and read at 562 nm using a microplate spectrophotometer (Spectra Max 340 PC, Molecular Devices, Sunnyvale, CA). Each experiment was repeated three times.
Uptake Studies
After 24 h of incubation with a bacteriochlorin solution (diluted as described above), the supernatant was transferred to a flat-bottom 96-well plate and mixed with an equal volume of SOLVABLE solution (PerkinElmer Inc., Waltham, MA). The cells were rinsed gently with warmed PBS and then lysed with SOLVABLE solution at 37 °C in an incubator for 2 h. The fluorescence of both the supernatant and cell lysate was measured using excitation at 402 nm and detection at 730 nm with a fluorescence plate reader (Molecular Devices, Sunnyvale CA). Following the fluorescence measurement, the total protein concentration was determined with a bicinchoninic acid protein assay kit (Sigma) using bovine serum albumin to prepare protein calibration curves. Fluorescence calibration curves were prepared for known concentrations of each of the 12 compounds in SOLVABLE that allowed results to be expressed in mol of bacteriochlorin per mg of cell protein. Each experiment was repeated three times.
Subcellular Localization by Fluorescence Microscopy
Cells were plated in 35 mm dishes and allowed to attach overnight. The next day 1 μM bacteriochlorin (4, 6,or 8) in complete medium was added and incubated for 24 h. Cells were washed in PBS, and 5 μg/mL of (i) LysoTracker green DND-26, (ii) MitoTracker green FM, or (iii) ER-Tracker green (Molecular Probes Invitrogen, Carlsbad, CA) was added and the mixture incubated for 30 min at 37 °C. Cells were again washed in PBS, and 5–10 min later a Leica DMR confocal laser fluorescence microscope (Leica Mikroskopie and Systeme GmbH, Wetzler, Germany) was used to image the cells at a resolution of 1024 × 1024 pixels. The microscope used excitation with a 488 nm argon laser and emission using either a bandpass filter (515 ± 10 nm) or a 580 nm long pass filter and a 63 × 1.20 NA water immersion lens. Images were acquired using TCS NT software (version 1.6.551, Leica Lasertechnik, Heidelberg, Germany).
Statistical Analysis
Each value is the mean of three separate experiments with an error bar that reflects the standard deviation or standard error of the mean for that determination. The fits of the data in Figures 1A and 5 were performed using Origin 8.0 software (OriginLab Corp.). Each analysis returned a goodness-of-fit parameter R2.
Acknowledgment
This work was supported by the NIH (Grant GM36238 to J.S.L. and Grant AI050875 to M.R.H.), by a Burroughs-Wellcome fellowship (to M.K.), and by the Jimmy V. NCSU Cancer Therapeutics Training Program. Y.-Y.H. and T.B. were supported by Grant R41AI072854 from the National Institute of Allergy and Infectious Diseases to NIRvana Pharmaceuticals, Inc. P.M. was partially supported by Genzyme-Partners Translational Research Grant. Characterization of the photophysical and redox properties of the bacteriochlorins described herein were initially motivated by solar-energy studies and supported by grants from the Division of Chemical Sciences, Geosciences and Biosciences Division, Office of Basic Energy Sciences of the U.S. Department of Energy to D.F.B. (Grant DE-FG02-05ER15660) and D.H. (Grant DE-FG02-05ER15661).
Footnotes
Abbreviations: cLogP, calculated logarithm of octanol–water partition coefficient; DFT, density functional theory; DMSO, dimethyl sulfoxide; EDTA, ethylenediaminetetraacetic acid; ER, endoplasmic reticulum; HOMO, highest occupied molecular orbital; LD50, dose causing 50% cell death; LED, light emitting diode; LUMO, lowest unoccupied molecular orbital; mLogP, measured logarithm of octanol water partition coefficient; MTT, 3-(4,5-dimethylthiazol-2-yl)-2,5-di-phenyltetrazolium bromide; QSAR, quantitative structure–activity relationship; PBS, phosphate buffered saline; PDT, photodynamic therapy; PEG, polyethylene glycol; RIF, radiation-induced fibrosarcoma; RPMI, Roswell Park Memorial Institute; UV, ultraviolet.
References
- 1.Hamblin MR, Mroz P. Advances in Photodynamic Therapy: Basic, Translational and Clinical. Artech House; Norwood, MA: 2008. [Google Scholar]
- 2.Castano AP, Demidova TN, Hamblin MR. Mechanisms in photodynamic therapy: part one—photosensitizers, photochemistry and cellular localization. Photodiagn. Photodyn. Ther. 2004;1:279–293. doi: 10.1016/S1572-1000(05)00007-4. [DOI] [PMC free article] [PubMed] [Google Scholar]
- 3.Castano AP, Demidova TN, Hamblin MR. Mechanisms in photodynamic therapy: part three—photosensitizer pharmacokinetics, biodistribution, tumor localization and modes of tumor destruction. Photodiagn. Photodyn. Ther. 2005;2:91–106. doi: 10.1016/S1572-1000(05)00060-8. [DOI] [PMC free article] [PubMed] [Google Scholar]
- 4.Castano AP, Demidova TN, Hamblin MR. Mechanisms in photodynamic therapy: part two—cellular signalling, cell metabolism and modes of cell death. Photodiagn. Photodyn. Ther. 2005;2:1–23. doi: 10.1016/S1572-1000(05)00030-X. [DOI] [PMC free article] [PubMed] [Google Scholar]
- 5.Lapouge K, Naveke A, Gall A, Ivancich A, Seguin J, Scheer H, Sturgis JN, Mattioli TA, Robert B. Conformation of bacteriochlorophyll molecules in photosynthetic proteins from purple bacteria. Biochemistry. 1999;38:11115–11121. doi: 10.1021/bi990723z. [DOI] [PubMed] [Google Scholar]
- 6.Trachtenberg J, Weersink RA, Davidson SR, Haider MA, Bogaards A, Gertner MR, Evans A, Scherz A, Savard J, Chin JL, Wilson BC, Elhilali M. Vascular-targeted photodynamic therapy (padoporfin, WST09) for recurrent prostate cancer after failure of external beam radiotherapy: a study of escalating light doses. BJU Int. 2008;102:556–562. doi: 10.1111/j.1464-410X.2008.07753.x. [DOI] [PubMed] [Google Scholar]
- 7.Mazor O, Brandis A, Plaks V, Neumark E, Rosenbach-Belkin V, Salomon Y, Scherz A. WST11, a novel water-soluble bacteriochlorophyll derivative; cellular uptake, pharmacokinetics, biodistribution and vascular-targeted photodynamic activity using melanoma tumors as a model. Photochem. Photobiol. 2005;81:342–351. doi: 10.1562/2004-06-14-RA-199. [DOI] [PubMed] [Google Scholar]
- 8.Chen Y, Potter WR, Missert JR, Morgan J, Pandey RK. Comparative in vitro and in vivo studies on long-wavelength photosensitizers derived from bacteriopurpurinimide and bacteriochlorin p6: fused imide ring enhances the in vivo PDT efficacy. Bioconjugate Chem. 2007;18:1460–1473. doi: 10.1021/bc070092i. [DOI] [PubMed] [Google Scholar]
- 9.Kim HJ, Lindsey JS. De novo synthesis of stable tetrahydro-porphyrinic macrocycles: bacteriochlorins and a tetradehydrocorrin. J. Org. Chem. 2005;70:5475–5486. doi: 10.1021/jo050467y. [DOI] [PubMed] [Google Scholar]
- 10.Ruzié C, Krayer M, Balasubramanian T, Lindsey JS. Tailoring a bacteriochlorin building block with cationic, amphipathic, or lipophilic substituents. J. Org. Chem. 2008;73:5806–5820. doi: 10.1021/jo800736c. [DOI] [PubMed] [Google Scholar]
- 11.Borbas KE, Ruzié C, Lindsey JS. Swallowtail bacteriochlorins. Lipophilic absorbers for the near-infrared. Org. Lett. 2008;10:1931–1934. doi: 10.1021/ol800436u. [DOI] [PubMed] [Google Scholar]
- 12.Fan D, Taniguchi M, Lindsey JS. Regioselective 15-bromination and functionalization of a stable synthetic bacteriochlorin. J. Org. Chem. 2007;72:5350–5357. doi: 10.1021/jo070785s. [DOI] [PMC free article] [PubMed] [Google Scholar]
- 13.Ruzié C, Krayer M, Lindsey JS. Fast and robust route to hydroporphyrin-chalcones with extended red or near-infrared absorption. Org. Lett. 2009;11:1761–1764. doi: 10.1021/ol900277m. [DOI] [PubMed] [Google Scholar]
- 14.Taniguchi M, Cramer DL, Bhise AD, Kee HL, Bocian DF, Holten D, Lindsey JS. Accessing the near-infrared spectral region with stable, synthetic, wavelength-tunable bacteriochlorins. New J. Chem. 2008;32:947–958. [Google Scholar]
- 15.Kobayashi M, Akiyama M, Kano H, Kise H. Spectroscopy and Structure Determination. In: Grimm B, Porra RJ, Rüdiger W, Scheer H, editors. Chlorophylls and Bacteriochlorophylls: Biochemistry, Biophysics, Functions and Applications. Vol. 25. Springer; Dordrecht, The Netherlands: 2006. pp. 79–94. Advances in Photosynthesis and Respiration. [Google Scholar]
- 16.Kee HL, Bhaumik J, Diers JR, Mroz P, Hamblin MR, Bocian DF, Lindsey JS, Holten D. Photophysical characterization of imidazolium-substituted Pd(II), In(III), and Zn(II) porphyrins as photosensitizers for photodynamic therapy. J. Photochem. Photobiol., A. 2008;200:346–355. doi: 10.1016/j.jphotochem.2008.08.006. [DOI] [PMC free article] [PubMed] [Google Scholar]
- 17.Holten D, Gouterman M, Parson WW, Windsor MW, Rockley MG. Electron transfer from photoexcited singlet and triplet bacteriopheophytin. Photochem. Photobiol. 1976;23:415–420. doi: 10.1111/j.1751-1097.1976.tb07275.x. [DOI] [PubMed] [Google Scholar]
- 18.Kee HL, Kirmaier C, Tang Q, Diers JR, Muthiah C, Taniguchi M, Laha JK, Ptaszek M, Lindsey JS, Bocian DF, Holten D. Effects of substituents on synthetic analogs of chlorophylls. Part 2: Redox properties, optical spectra and electronic structure. Photochem. Photobiol. 2007;83:1125–1143. doi: 10.1111/j.1751-1097.2007.00151.x. [DOI] [PubMed] [Google Scholar]
- 19.Ochsner M. Photophysical and photobiological processes in the photodynamic therapy of tumours. J. Photochem. Photobiol., B. 1997;39:1–18. doi: 10.1016/s1011-1344(96)07428-3. [DOI] [PubMed] [Google Scholar]
- 20.Mroz P, Bhaumik J, Dogutan DK, Aly Z, Kamal Z, Khalid L, Kee HL, Bocian DF, Holten D, Lindsey JS, Hamblin MR. Imidazole metalloporphyrins as photosensitizers for photodynamic therapy: role of molecular charge, central metal and hydroxyl radical production. Cancer Lett. 2009;282:63–76. doi: 10.1016/j.canlet.2009.02.054. [DOI] [PMC free article] [PubMed] [Google Scholar]
- 21.Henderson BW, Bellnier DA, Greco WR, Sharma A, Pandey RK, Vaughan LA, Weishaupt KR, Dougherty TJ. An in vivo quantitative structure–activity relationship for a congeneric series of pyropheophorbide derivatives as photosensitizers for photodynamic therapy. Cancer Res. 1997;57:4000–4007. [PubMed] [Google Scholar]
- 22.Margaron P, Gregoire MJ, Scasnar V, Ali H, van Lier JE. Structure–photodynamic activity relationships of a series of 4-substituted zinc phthalocyanines. Photochem. Photobiol. 1996;63:217–223. doi: 10.1111/j.1751-1097.1996.tb03017.x. [DOI] [PubMed] [Google Scholar]
- 23.MacDonald IJ, Morgan J, Bellnier DA, Paszkiewicz GM, Whitaker JE, Litchfield DJ, Dougherty TJ. Subcellular localization patterns and their relationship to photodynamic activity of pyropheophorbide-a derivatives. Photochem. Photobiol. 1999;70:789–797. [PubMed] [Google Scholar]
- 24.Buytaert E, Dewaele M, Agostinis P. Molecular effectors of multiple cell death pathways initiated by photodynamic therapy. Biochim. Biophys. Acta. 2007;1776:86–107. doi: 10.1016/j.bbcan.2007.07.001. [DOI] [PubMed] [Google Scholar]
- 25.Pogue BW, Ortel B, Chen N, Redmond RW, Hasan T. A photobiological and photophysical-based study of phototoxicity of two chlorins. Cancer Res. 2001;61:717–724. [PubMed] [Google Scholar]
- 26.Kessel D, Luguya R, Vicente MG. Localization and photodynamic efficacy of two cationic porphyrins varying in charge distributions. Photochem. Photobiol. 2003;78:431–435. doi: 10.1562/0031-8655(2003)078<0431:lapeot>2.0.co;2. [DOI] [PubMed] [Google Scholar]
- 27.Rancan F, Wiehe A, Nobel M, Senge MO, Omari SA, Bohm F, John M, Roder B. Influence of substitutions on asymmetric dihydroxychlorins with regard to intracellular uptake, subcellular localization and photosensitization of Jurkat cells. J. Photochem. Photobiol., B. 2005;78:17–28. doi: 10.1016/j.jphotobiol.2004.08.010. [DOI] [PubMed] [Google Scholar]
- 28.Trivedi NS, Wang HW, Nieminen AL, Oleinick NL, Izatt JA. Quantitative analysis of Pc 4 localization in mouse lymphoma (LY-R) cells via double-label confocal fluorescence microscopy. Photochem. Photobiol. 2000;71:634–639. doi: 10.1562/0031-8655(2000)071<0634:qaopli>2.0.co;2. [DOI] [PubMed] [Google Scholar]
- 29.Sasnouski S, Pic E, Dumas D, Zorin V, D'Hallewin MA, Guillemin F, Bezdetnaya L. Influence of incubation time and sensitizer localization on meta-tetra(hydroxyphenyl)chlorin (mTHPC)-induced photoinactivation of cells. Radiat. Res. 2007;168:209–217. doi: 10.1667/0033-7587(2007)168[209:IOITAS]2.0.CO;2. [DOI] [PubMed] [Google Scholar]
- 30.Szokalska A, Makowski M, Nowis D, Wilczynski GM, Kujawa M, Wojcik C, Mlynarczuk-Bialy I, Salwa P, Bil J, Janowska S, Agostinis P, Verfaillie T, Bugajski M, Gietka J, Issat T, Glodkowska E, Mrowka P, Stoklosa T, Hamblin MR, Mroz P, Jakobisiak M, Golab J. Proteasome inhibition potentiates antitumor effects of photodynamic therapy in mice through induction of endoplasmic reticulum stress and unfolded protein response. Cancer Res. 2009;69:4235–4243. doi: 10.1158/0008-5472.CAN-08-3439. [DOI] [PMC free article] [PubMed] [Google Scholar]
- 31.Krayer M, Ptaszek M, Kim HJ, Meneely KR, Fan D, Secor K, Lindsey JS. Expanded scope of synthetic bacteriochlorins via improved acid catalysis conditions and diverse dihydrodipyrrin-acetals. J. Org. Chem. 2010;75:1016–1039. doi: 10.1021/jo9025572. [DOI] [PubMed] [Google Scholar]
- 32.Weber G, Teale FW. Determination of the absolute quantum yield of fluorescent solutions. Trans. Faraday Soc. 1957;53:646–655. [Google Scholar]
- 33.Gradyushko AT, Sevchenko AN, Solovyov KN, Tsvirko MP. Energetics of photophysical processes in chlorophyll-like molecules. Photochem. Photobiol. 1970;11:387–400. doi: 10.1111/j.1751-1097.1970.tb06011.x. [DOI] [PubMed] [Google Scholar]
- 34.Kong J, White CA, Krylov AI, Sherrill D, Adamson RD, Furlani TR, Lee MS, Lee AM, Gwaltney SR, Adams TR, Ochsenfeld C, Gilbert AT, Kedziora GS, Rassolov VA, Maurice DR, Nair N, Shao Y, Besley NA, Maslen PE, Dombroski JP, Daschel H, Zhang W, Korambath PP, Baker J, Byrd EF, Van Voorhis T, Oumi M, Hirata S, Hsu C-P, Ishikawa N, Florian J, Warshel A, Johnson BG, Gill PM, Head-Gordon M, Pople JA. Q-Chem 2.0: a high performance ab initio electronic structure program package. J. Comput. Chem. 2000;21:1532–1548. [Google Scholar]
- 35.Perry VP. Cultivation of large cultures of HeLa cells in horse serum. Science. 1955;121:805. doi: 10.1126/science.121.3153.805. [DOI] [PubMed] [Google Scholar]
- 36.He P, Ahn JC, Shin JI, Hwang HJ, Kang JW, Lee SJ, Chung PS. Enhanced apoptotic effect of combined modality of 9-hydroxypheophorbide alpha-mediated photodynamic therapy and carboplatin on AMC-HN-3 human head and neck cancer cells. Oncol. Rep. 2009;21:329–334. [PubMed] [Google Scholar]
- 37.Lobner D. Comparison of the LDH and MTT assays for quantifying cell death: validity for neuronal apoptosis? J. Neurosci. Methods. 2000;96:147–152. doi: 10.1016/s0165-0270(99)00193-4. [DOI] [PubMed] [Google Scholar]
- 38.Merlin JL, Azzi S, Lignon D, Ramacci C, Zeghari N, Guillemin F. MTT assays allow quick and reliable measurement of the response of human tumour cells to photodynamic therapy. Eur. J. Cancer. 1992;28A:1452–1458. doi: 10.1016/0959-8049(92)90542-a. [DOI] [PubMed] [Google Scholar]
- 39.Hamblin MR, Miller JL, Ortel B. Scavenger-receptor targeted photodynamic therapy. Photochem. Photobiol. 2000;72:533–540. doi: 10.1562/0031-8655(2000)072<0533:srtpt>2.0.co;2. [DOI] [PubMed] [Google Scholar]