Abstract
The objective of this study was to measure anthropometric and haemoglobin level and nutrient intake of expecting women in the third trimester of pregnancy and to relate the birth weight of neonates as outcome of pregnancy. A cross sectional study was performed in Zahedan City. Two hospitals situated in the city were selected based on their approval and cooperation. Five hundred healthy pregnant women in the age group 16-40 years were selected for this study. Findings showed that the mean height, weight, fundal height, and haemoglobin of pregnant women were 156.4 cm, 62.6 kg, 34.2 cm, and 11.1g/dl respectively. Nutrient intake was computed based on 24 hour recall method. The results showed that, the mean intake of energy was 1802 Kcal/day. The intake of protein, calcium, iron, zinc and magnesium were 70.7 g, 544.0 mg, 16.1 mg, 10.6 mg and 266.0 mg respectively. Percentage adequacy of nutrient intakes with reference to RDA recommendation showed 95% and 80% of subjects had sufficient RDA intakes, while energy, calcium, iron and zinc intake considered as insufficient. The mean birth weight of neonates was 3.0 kg and 13% of neonates showed low birth weight. Maternal height, weight, fundal height and haemoglobin level were significantly correlated with birth weight of neonates. Energy, protein and calcium intakes in the third trimester were significantly correlated with birth weight of neonates. Using the binary logistic regression analysis fundal height, haemoglobin level and energy intake of pregnant women were considered as predictor factors of birth weight of neonates.
Keywords: Anthropometric measurements, energy intake, nutrient intake, birth weight, Iran
Introduction
Adequate nutrition is a human basic need and essentiality of life. Nutrient requirement is influenced by genetic and environmental factors, food pattern, age, and sex and growth rate [1]. Sufficient nutrition before and during pregnancy has enormous potential for promoting a long term health of the mother and her child. A woman who has been well nourished before conception begins her pregnancy with rich reserves of several nutrients so that the needs of the growing foetus can be met without damaging her health. Infants who are well nourished in the womb, have an enhanced chance of entering life in good health. Mother's diet should provide adequate nutrients so that maternal stores do not get depleted [2,3].
Poor foetal growth has been attributed to widespread maternal under-nutrition. Therefore understanding maternal nutrition and foetal growth relationship is important [4-6]. Today's infants are tomorrow's adults and they are the future building blocks of the society. Therefore every child should be a wanted child and every pregnancy a planned pregnancy. In most developed countries, pregnancies are planned, complications are few and outcomes are generally favourable for both mother and infant. Adverse outcomes are far more frequent in developing world [7]. In developing countries such as Iran, women particularly of deprived districts are nutritionally at risk [6]. Zahedan City situated in the province of Sistan & Baluchestan province, with annually low rain, and warm and dry weather. There is no available data on the nutritional status of pregnant women in Zahedan City, also the relationship between maternal nutrition and birth weight of infant's demands further attention. This study was designed to measure the maternal anthropometric parameters, haemoglobin level and nutrient intake, of expecting women in the third trimester of pregnancy and to relate with birth weight of neonates as outcome of pregnancy.
Subjects and Methods
Selection of area, hospitals and subjects
Zahedan, a city of Sistan and Baluchistan province located in eastern border of Iran, was selected for the study. From the three hospitals of the city, two of them namely, Ali-Ebn-Abitaleb and Tamine-Edjtemae, were selected based on their acceptance and cooperation. With the help of a statistician and the statistics of annual deliveries in each hospital, 7% of pregnant women were selected to represent the target population i.e., pregnant women. Total pregnant women included for the study were as follows: Ali-Ebn-Abitaleb hospital 260 and Tamine-Edjtemae hospital 240, representing different socio-economic status. Pregnant women in the end of the third trimester (39 ± 1.9 weeks) of pregnancy were selected. The subjects followed up for a week after delivery. The inclusive criteria were age group (16 to 40 years) and who continuously visited for health care during the three trimesters of pregnancy in selected hospitals. The pregnant women with diabetes mellitus and cardio vascular disease (CVD) were excluded from the study. The study was approved by the Human Ethical Committee of the University of Mysore, as the first author is a research scholar in the University of Mysore, India and this was approved by the authorities of the selected hospital in Iran. A written consent to participate in the study was obtained from each subject. The study was carried out in the year 2008 to 2009.
The required information about various aspects proposed to study was provided by questionnaires. Suitable questionnaires were formulated and pre-tested with small population (pilot study), and suitable modifications were introduced so as to obtain standard questioners. The subjects were interviewed to collect information about their family background and other information.
Anthropometric measurements
Anthropometric measurements, namely height and weight, were carried out by investigator using standard methodology as described by Jelliffee [8]. The measurements were made on the participants wearing a minimum amount of clothing. The weight of pregnant women was recorded at the third trimester by using digital weighing balance to the nearest 100 g (Calibrated after every 10 measurements). Height was measured in cm using a locally made anthrop-meter. The pregnant women were asked to maintain an upright and erect posture with her feet together and the back of her heels touching the pole of the anthrop-meter, and the horizontal headpiece was lowered onto the women's head and the measurements were taken to the nearest 0.5 cm. Fundal height was measured in cm by a physician at a distance between the symphysis pubis and the highest point of the uterine fundus, defined with a gentle pressure on a plain at right angle of the abdominal wall and was marked.
Assessment of haemoglobin level
Haemoglobin value was taken from clinical records when the subjects were hospitalized for child births. It was analyzed in hospital laboratory by cyanomethemoglobin method as described by WHO [9].
Diet survey
The dietary assessment of pregnant women was done at the end of the third trimester and food intakes were obtained using 24-hour dietary recall method. Probing questions were used to help the subjects remember all foods and drinks consumed the previous day. Questions were extended to methods of food preparation, portion sizes, as well as to approximate sizes of meals. Standard containers and weights were used to measure the quantity of intake of the cooked food [10]. The information about the quantity of raw material for cooking as well as the cooked food by the subject was recorded in terms of household measures/number/kg to find out the quantum of raw food intake. The cooked and raw amount of foods consumed by each subjects was then used to prepare a ready recknor. This was prepared by the investigator using Iranian food preparation and the nutritive value of Iranian national food composition [11]. Nutrient adequacy of each subject was calculated, using the ready recknor with reference to Iranian recommendation [12].
Anthropometric measurements of neonates
Anthropometric measurements of neonates, namely weight, height, head and chest circumferences, were taken within 24 hours after birth, using standard procedure [8]. A beam balance by which accuracy of 50 g was employed for weighing the infants .Infants were weighted, with minimum clothing while the child was restful. Infant-meter was used for measuring the recumbent length of newborn infant. A lightweight fibreglass infant-meter was used to measure length up to 100 cms. Infants were laid on the board of the infant-meter, which was kept on flat table. The crown of the head was in contact with the top end of the device. The knee was extended, so that the feet were at right angles to the leg. The mobile device was then brought in contact with the feet of neonate and was allowed to be in contact with the device at the bottom end of the board. The distance between the two right angle devices was measured. The reading was recorded in centimetres with accuracy of 0.5 cms. The infant's head was steadied and the greatest circumference measured, by placing the fibreglass tape firmly round the frontal bones, just superior to the supra-orbital ridges. The tape was passed round the head at the same level, on each side, and laying it over the maximum occipital prominence at the back. The infant's chest circumference measurement was made at the nipple line, when the child was calm and breathing normally. The fibreglass tape was used for measuring the chest circumference.
Statistical analysis
The data were analysed by computer using Statistical Package for Social Science (SPSS Inc Chicago IL, Version 11.5). Quantitative variables were analyzed by student's t-test, and One way-ANOVA. When the One way-ANOVA results were significant, the Bonferroni test was used to determine whether significant difference exist between different variables means. Binary logistic regression analysis was done to find out among height, weight, fundal height, haemoglobin, energy and nutrient intake as independent variables that were significantly correlated with birth weight, which are as predictor factors of birth weight of neonates. Results were considered significant if P < 0.05.
Results
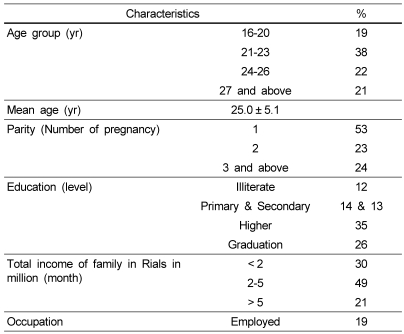
Tables 1 show details of selected pregnant women and her family background. The mean age of pregnant women was 25 ± 5.1 years and the age range was 16-40 years. Majority (38%) of pregnant women were in age group 21-23 years. Highest percentage (53%) of pregnant women were expecting first child. Eighty one percent of subjects were not employed. Thirty five percent of pregnant women had higher school level of education, followed by graduation (26%). Majority (49%) of subjects had income of Rials. 2-5 million per month; other details of subjects are presented in Table 1.
Table 1.
Information about pregnant women & their family background (n = 500)
Anthropometric and haemoglobin level measurements
Anthropometric measurements of subjects at the end of the third trimester namely height, weight along with fundal height and haemoglobin are given in Table 2. The finding showed mean height, weight, fundal height, and haemoglobin were, 156.4 cm, 62.6 kg, 34.2 cm and 11.1 g/dl respectively.
Table 2.
Anthropometric measurements and haemoglobin level of pregnant women (III trimester, n = 500)
Nutrient intake of pregnant women
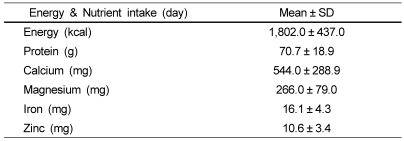
Energy and nutrient intake per day of subjects in the third trimester of pregnancy are presented in Table 3. Mean energy, protein, calcium, magnesium, iron and zinc were 1802.0 kcal, 70.7 g, 544.0 mg, 266.0 mg, 16.1 mg, and 10.6 mg respectively.
Table 3.
Mean energy and nutrient intakes (per day) of pregnant women (III trimester, n = 500)
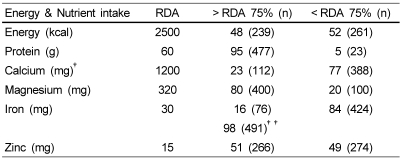
Percentage of adequacy of nutrient intake with reference to Iranian RDA recommendation [12] were computed and presented in Table 4. The finding showed 48 percent of pregnant women had energy intake more than recommended (75% of RDA) that was considered as sufficient, while 52 percent of them were considered as insufficient.
Table 4.
Distribution of pregnant women with intake 75 < RDA % > 75 (III trimester, n = 500)
†10 percent of pregnant women mentioned that they had calcium supplementation as prescribed by physician. This is not included in the nutrient intake.
††98 percent of pregnant women mentioned that they consumed ferrous sulphate tablet during pregnancy period (from II trimester). Consumption of these tablets is not monitored by the investigator.
Neonate information
Table 5 shows data on prevalence of low birth weight of neonates. Majority (87%) of them had normal birth weight and thirteen percent of them were belonging to the category of low birth weight (LBW, less than 2.5 kg). Fifty percent of male and 36 percent of female had normal birth weight (NBW, ≥ 2.5 kg), where as five and eight percent of male and female had LBW respectively.
Table 5.
Prevalence LBW vs. NBW (n = 500)
Anthropometric measurements of neonates namely weight, height, head and chest circumferences of neonates were 3.0 kg, 50.7 cm, 34.4 cm, and 32.9 cm respectively (Table 6). The findings showed male neonates were heavier and taller and their head and chest circumferences were higher than female neonates.
Table 6.
Anthropometric measurements of neonates (n = 500)
**P < 0.01
Discussion
Nutritional status of pregnant women is known to influence quality and health of neonates [13]. Birth weight is the most sensitive and reliable indicator of health of an infant and associated with the health and survival of them. Low birth weight (LBW) is an indicator of poor health of neonates. Considerable percentage of neonates (87%) was classified as NBW and 13% showed LBW. Similar percentage of results in Zahedan hospitals was reported by Roudbari et al. [14], which stated that 12% of neonates had LBW. However percentage of LBW reported in different parts of Iran by UNICEF and WHO (7%) and Rahimi Sharbaf (9%) [15,16], showed LBW were lower than present study. The main reason for variations in level of LBW may be different geographic regions and bioavailability of food is affected due to climate variations. Male neonates showed significantly higher height, weight, head and chest circumferences than females (Table 6). Similar results were reported by Som et al. [17] from India, Kato [18] from Japan and Moore et al. [19] from Australia and Zadkarimi [20] from Iran.
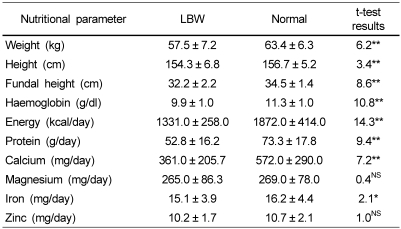
The relationship between maternal nutritional status and birth weight was examined to find out association between birth weight and nutritional status of pregnant women. NBW and LBW were considered as the parameters of birth weight and results presented in Table 7. As shown, pregnant women who gave birth to LBW haemoglobin level than women who gave birth to neonates with normal birth weight babies. It was also observed that these women who gave birth to normal neonates had significantly higher consumption of energy and protein, calcium and iron than who gave birth to neonates with LBW. The present findings were similar with findings that reported by Al-Shosan [21] from Saudi Arabia and Rao et al. [5] from India; Parvathi and Khyrunnisa Begum [22] from India, whom that reported association between energy and nutrient intake with birth weight of neonates.
Table 7.
LBW and NBW of neonates: Nutritional status of pregnant women (Third trimester, n = 500)
*P < 0.05
**P < 0.01
NS: Not Significant
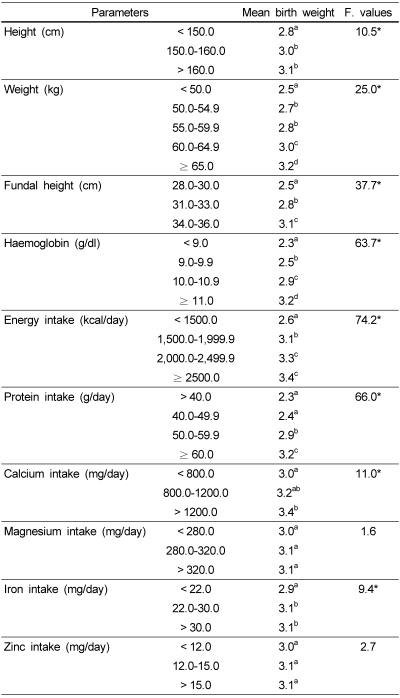
Different levels of nutritional status of pregnant women with reference to variations in birth weight of neonates were analysed. The data was subjected to One-way ANOVA and the results are presented in Table 8. It is clear from table that the taller pregnant women (more than 150 cm) gave birth to significantly heavier babies (3.0 kg) when compared to shorter women (2.8 kg). Pregnant women with weight less than 50 kg gave birth to neonates with 2.5 kg, while pregnant women with more than 65 kg gave birth to heavier neonates (3.2 kg). Siega-Riz and Hbel [23] from USA and Hickey et al. [24] from USA also reported taller and heavier women gave birth to heavier neonates. Increase in fundal height of pregnant women showed significant increase in birth weight. Shoberi and Nazari [25] reported similar findings in Mysore, India. Increase in haemoglobin level of pregnant women showed significant increase in birth weight of neonates.
Table 8.
Birth weight vs. nutritional status of pregnant women
*P < 0.05
Different superscript indicate significant difference at 5% level as shown by post hoc Bonferroni.
It is clear from the Table 8 that pregnant women with haemoglobin more than 11 g/dl, which is considered as normal level gave birth to neonates with normal weight, while pregnant women with lower haemoglobin level (< 11 g/dl), who were considered as anaemic gave birth to low birth weight babies. Shoberi, Khyrunnisa Begum and Nazari [26] from India in their study also indicated the importance of normal haemoglobin level on pregnancy outcome, and their results agree with current findings. Their finding showed normal concentration of haemoglobin have a significant influence on birth weight. Effect of different level of haemoglobin also reported by Rosenberg et al. [27] from China, revealed that both mild and moderate anaemia (95 ≤ Hb < 120 g/L and Hb < 95 g/L respectively) were significantly associated with lower birth weight.
Energy intake of pregnant women in different levels showed significant influence on birth weight of babies. It is evident from the Table 8 that pregnant women who consumed < 1,500 kcal/day gave birth to neonates with 2.6 kg, while pregnant women with ≥ 2,500 kcal/day energy gave birth to neonates with 3.4 kg. Different levels of protein intake of pregnant women showed significant influence on birth weight of babies. It is clear from the table that pregnant women with protein intake of ≤ 49.9 g gave birth to neonates with LBW (2.4 kg), while pregnant women with higher intake of protein (≥ 60 g) gave birth to neonates with NBW (3.4 kg). Al-Shosan [21] from Saudi Arabia and Rao et al. [5] from India reported comparable results with regard to protein and energy intake. Moore et al. [19] in South Australia reported, caloric deficit in the third trimester and low fundal height and haemoglobin of pregnant women were associated with high percentage of LBW. Among minerals, high intake of calcium and iron showed significant influenced on birth weight of neonates.
As it evident from Table 8 that there is a significant association evident between the birth weight of neonates and the maternal height, weight fundal height, haemoglobin value, energy, protein, calcium and iron intake.
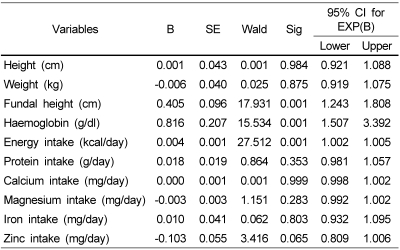
To find out the most important predicting factors for birth weight the binary logistic regression was carried out and the results presented in Table 9. The findings showed that the fundal height, haemoglobin and energy intake of pregnant women could be considered as primary "predictor factors" for birth weight of neonates. Similar results was reported by Rao et al. [5] from India, who stated that energy intake and mother's weight were associated with birth weight of neonates. In Saudi Arabia Al-Shosan [21] showed that caloric intake was the best choice for birth weight.
Table 9.
Results of binary logistic regression
Variable(s) entered for analyzing: Height, Weight, Fundal height, Hemoglobin, Energy intake, Protein intake, Calcium intake, Magnesium intake, Iron intake.
To conclude, maternal height, weight, fundal height and haemoglobin level were significantly correlated with birth weight of neonates. Energy, protein and calcium intakes in the third trimester were significantly correlated with birth weight of neonates. Nutritional status of pregnant women influenced birth weight of their neonates. Adequate nutrient intake is important for pregnancy outcome. Fundal height, haemoglobin and energy intake of pregnant women could be considered as predictor factors for birth weight of neonates. The present study results indicate that male neonates were heavier, taller and their head and chest circumferences were higher than female neonates. It may be recommended that the government focus on the effective implementation of program to improve the dietary intake of pregnant women to optimize their health and that of to improve the health condition of neonates. Focal points for nutrition education which may be offered by government. Further studies may have to be conducted to throw light on various aspects of maternal nutritional factors and their association with birth weight of neonates.
Acknowledgment
We appreciate the administrators of hospitals, Dr. Kazem Nezam and Dr. Ramin Zarea Gholizade, for their support and cooperation. Cooperation of the staff in the selected hospitals is highly acknowledged. We are sincerely indebted to all the participants who made this study possible.
References
- 1.Panwar B, Punia D. Food intake in rural pregnant women of Haryana state, Northern India: Relationship with education and income. Int J Food Sci Nutr. 1998;49:243–247. doi: 10.3109/09637489809086418. [DOI] [PubMed] [Google Scholar]
- 2.Singh M, Jain S, Choudhary M. Dietary adequacy of pregnant women of four district of Rajasthan. J Hum Ecol. 2009;25:161–165. [Google Scholar]
- 3.Landman JP, Hall JE. Dietary patterns and nutrition in pregnancy in Jamaica. J Trop Pediatr. 1989;35:185–189. doi: 10.1093/tropej/35.4.185. [DOI] [PubMed] [Google Scholar]
- 4.Rao S, Yajnik CS, Kanade A, Fall CH, Margetts BM, Jackson AA, Shier R, Joshi S, Rege S, Lubree H, Desai B. Intake of micronutrient-rich foods in rural Indian mothers is associated with the size of their babies at birth: Pune Maternal Nutrition Study. J Nutr. 2001;131:1217–1224. doi: 10.1093/jn/131.4.1217. [DOI] [PubMed] [Google Scholar]
- 5.Rao BT, Aggarwal AK, Kumar R. Dietary intake in third trimester of pregnancy and prevalence of LBW: A Community-based study in a rural area of haryana. Indian J Community Med. 2007;32:272–276. [Google Scholar]
- 6.Esmaillzadeh A, Samareh S, Azadbakht L. Dietary patterns among pregnant women in the West-North of Iran. Pak J Biol Sci. 2008;11:793–796. doi: 10.3923/pjbs.2008.793.796. [DOI] [PubMed] [Google Scholar]
- 7.Kramer MS. Maternal nutrition and adverse pregnancy outcome: an overview. J Nutr. 2003;133:1592–1596. doi: 10.1093/jn/133.5.1592S. [DOI] [PubMed] [Google Scholar]
- 8.Jelliffee DB. The assessment of the nutritional status of community. Geneva: World Health Organization; 1966. [Google Scholar]
- 9.WHO/UNICEF/UNO. IDA: Prevention, assessment and control. Report of a WHO/UNICEF/UNO Consultation. Geneva: 1998. [Google Scholar]
- 10.National Nutrition and Food Technology Research Institute. National Household Food Consumption and Nutrition Status: 2000-02. Tehran; Iran: 2004. [Google Scholar]
- 11.National Nutrition and Food Technology Research Institute. Food Composition Table. Tehran; Iran: 1996. [Google Scholar]
- 12.Shekh F. Manual of Diet Therapy. Iranian Nutrition Society. 2nd ed. Tehran; Iran: Salemi Pub; 2009. [Google Scholar]
- 13.Kramer MS. Maternal nutrition, pregnancy outcome and public health policy. CMAJ. 1998;159:663–665. [PMC free article] [PubMed] [Google Scholar]
- 14.Roudbari M, Yaghmaei M, Sohili M. Prevalence and risk factors of low birth weight infants in Zahedan, Islamic Repoblic of Iran. East Mediterr Health J. 2007;13:838–845. [PubMed] [Google Scholar]
- 15.UNICEF/WHO. United nations children's fund and world health organization, Low Birth Weight: Country, regional and global estimates. Newyork: UNICEF; 2004. [Google Scholar]
- 16.Rahimi Sharbaf F, Moghimi R, Shadafza B, Shafaie S. The Frequency of LBW and Factors Related to it at Hospital's of Tehran University of Medical Science. J Med Count IRI. 2002;20:83–88. [Google Scholar]
- 17.Som S, Pal M, Adak DK, Gharami AK, Bharati S, Bharati P. Effect of socio-economic and biological variables on birth weight in Madhya Pradesh, India. Mal J Nutr. 2004;10:159–171. [PubMed] [Google Scholar]
- 18.Kato N. Reference birth weight range for multiple birth neonates in Japan. BMC Pregnancy Childbirth. 2004;4:2. doi: 10.1186/1471-2393-4-2. [DOI] [PMC free article] [PubMed] [Google Scholar]
- 19.Moore VM, Davies MJ, Willson KJ, Worsley A, Robinson JS. Dietary composition of pregnant women is related to size of the baby at birth. J Nutr. 2004;134:1820–1826. doi: 10.1093/jn/134.7.1820. [DOI] [PubMed] [Google Scholar]
- 20.Zadkarami MR, Rahimi A. Factors associated with birth weight: An application of the multiple skew-normal regression. Res J Obstet Gynecol. 2008;1:9–17. [Google Scholar]
- 21.Al-Shosan A. Diet history and birth weight relationship among Saudi pregnant women. Pak J Med Sci Q. 2007;23:176–181. [Google Scholar]
- 22.Johnson AA, Knight EM, Edwards CH, Oyemade UJ, Cole OJ, Westney OE, Westney LS, Laryea H, Jones S. Dietary intakes, anthropometric measurements and pregnancy outcomes. J nutr. 1994;124:936–942. doi: 10.1093/jn/124.suppl_6.936S. [DOI] [PubMed] [Google Scholar]
- 23.Siega-Riz AM, Hobel CJ. Predictors of poor maternal weight gin from baseline anthropometric, psychosocial and demographic information in a Hispanic population. J Am Diet Assoc. 1997;97:1264–1268. doi: 10.1016/s0002-8223(97)00303-9. [DOI] [PubMed] [Google Scholar]
- 24.Hickey CA, McNeal SF, Menefee L, Ivey S. Prenatal weight gain within upper and lower recommended ranges: effect on birth weight of black and white infants. Obstet Gynecol. 1997;90:489–494. doi: 10.1016/s0029-7844(97)00301-3. [DOI] [PubMed] [Google Scholar]
- 25.Shobiri F, Nazari M. Symphsis-Fundal height and abdominal circumference measurements as indicators for low birth weight. Mal J Nutr. 2006;12:79–86. [Google Scholar]
- 26.Shoberi F, Begum Khyrunnisa, Nazari MA. A prospective study of maternal haemoglobin status of Indian women during pregnancy and pregnancy outcome. Nutr Res. 2006;26:209–213. [Google Scholar]
- 27.Rosenberg AG, Wood RJ, Wang X, Xing H, Chen C, Chen D, Guang W, Huang A, Wang L, Xu X. Preconception haemoglobin and ferritin concentrations are associated with pregnancy outcome in a prospective cohort of Chinese women. J Nutr. 2004;134:2586–2591. doi: 10.1093/jn/134.10.2586. [DOI] [PubMed] [Google Scholar]


