

Summary
Prostate cancer is a very complex disease, and the decision-making process requires the clinician to balance clinical benefits, life expectancy, comorbidities, and potential treatment related side effects. Accurate prediction of clinical outcomes may help in the difficult process of making decisions related to prostate cancer. In this review, we discuss attributes of predictive tools and systematically review those available for prostate cancer. Types of tools include probability formulas, look-up and propensity scoring tables, risk-class stratification prediction tools, classification and regression tree analysis, nomograms, and artificial neural networks. Criteria to evaluate tools include discrimination, calibration, generalizability, level of complexity, decision analysis, and ability to account for competing risks and conditional probabilities. We describe the available predictive tools and their features, focusing on nomograms. While some tools are well-calibrated, few have been externally validated or directly compared to other tools. In addition, the clinical consequences of applying predictive tools need thorough assessment. Nevertheless, predictive tools can facilitate medical decision-making by showing patients tailored predictions of their outcomes with various alternatives. Additionally, accurate tools may improve clinical trial design.
Keywords: prostate cancer, nomogram, prediction, recurrence, diagnosis, decision analysis
INTRODUCTION
In the Unites States, prostate cancer (PCa) is the most common solid malignancy and the second leading cause of cancer death in men [1]. PCa is a very complex disease, and the decision-making process at the basis of the management of radical treatments is challenging because it requires a fine balance among expected clinical benefit, life expectancy, comorbidities, and potential treatment-related adverse events. The prediction of clinical outcomes is therefore critical. Accurate estimates of stage and of the likelihood of cancer diagnosis, clinical significance, treatment success, complications, and long-term morbidity are important for patient counseling and informed decision-making. By understanding the most probable endpoint of a patient’s clinical course, physicians may modify treatment and post-treatment strategies in order balance benefits and adverse events of treatment. Prediction also allows patients to choose responsibly among the different treatment strategies proposed by the clinicians. Properly informing the patient of these likelihoods could improve his satisfaction after treatment. Lack of patient involvement in treatment decision has been identified as a major risk factor for regret of treatment choice [2, 3]. Therefore, accurate estimates of risk help physicians make specific management recommendations.
Traditionally, physician judgment has formed the basis for risk estimation, patient counseling, and decision making. However, clinicians’ estimates are often biased due to both subjective and objective confounders [4–7]. To obviate this problem and to obtain more accurate predictions, researchers have developed predictive tools that are based on statistical techniques [8]. Recently, predictive tools have been introduced to predict the outcome of interest for the individual patient. Predictive tools have been shown to perform better than clinical judgment when predicting probabilities of outcome [7, 9, 10]. That said, physician input is obviously essential in medical decision-making, both for the measurement of variables that are used in the prediction process and for the interpretation and application of prediction tool-derived outcome predictions in clinical practice.
There are a number of types of prediction tools such as Kattan-type nomograms [11, 12], risk groupings [13, 14–16], artificial neural networks (ANNs) [17], probability tables [18, 19], classification and regression tree (CART) analyses [20, 21], probability formulas, look-up and propensity scoring tables, and risk-class stratification prediction tools. In this review, we describe criteria for evaluation of predictive tools and present an inventory of available predictive tools available for PCa, which were identified in a search of MEDLINE literature from January 1966 to April 2009. For each of the tools, we describe the patient population, the outcomes predicted, and individual tool characteristics such as predictor variables, discrimination estimates, and whether the tool has been internally and/or externally validated.
EVALUATING PREDICTIVE TOOLS
Prediction tools can be compared based on several criteria: discrimination, calibration (correlation between predicted and observed risk throughout the entire range of predictions), generalizability, level of complexity, adjustment for the effect of competing risks, use of conditional probabilities, and application of decision-analysis. The most important of these considerations are discrimination and calibration.
Discrimination
A good predictive tool is able to discriminate between patients with or without the outcome of interest. Discrimination is quantified using the area under the curve (AUC) for binary outcomes (e.g., presence or absence of cancer on biopsy), the c-index for censored data (e.g. recurrence after radical prostatectomy), and the Brier score [22]. For both AUC and c-index, 0.5 represents no discriminating ability (coin flip), whereas a value of 1.0 represents perfect discrimination.
A valid determination of the prediction tool’s discrimination would require the application of the prediction tool in populations other than the population used in development of the prediction tool. Thus, the discrimination should be ideally tested in an independent cohort; however, in the absence of an external cohort, prediction tools are usually subjected to internal validation. Internal validation can be done by bootstrapping (the development dataset is used to simulate prediction tool testing under novel conditions) [23–28], split-sample validation, and/or cross-validation (such as 5-fold or 10-fold cross-validation or leave-one-out validation) [27].
Calibration
While discrimination quantifies the ability of a prediction tool to distinguish between patients, calibration quantifies the accuracy of a prediction for an individual patient. A tool is well calibrated if close to x% of patients given an x% risk have the event. Calibration plots graphically illustrate the relationship between predicted and observed rates of the outcome of interest. Ideally, a well calibrated prediction tool exhibits a 1:1 relationship between predicted and observed rates, resulting in 45 degree slope (e.g., Figure 2B). Such plots can be calculated for the data set used to create the model (in which case poor calibration is rare) or for external datasets.[24, 26–29].
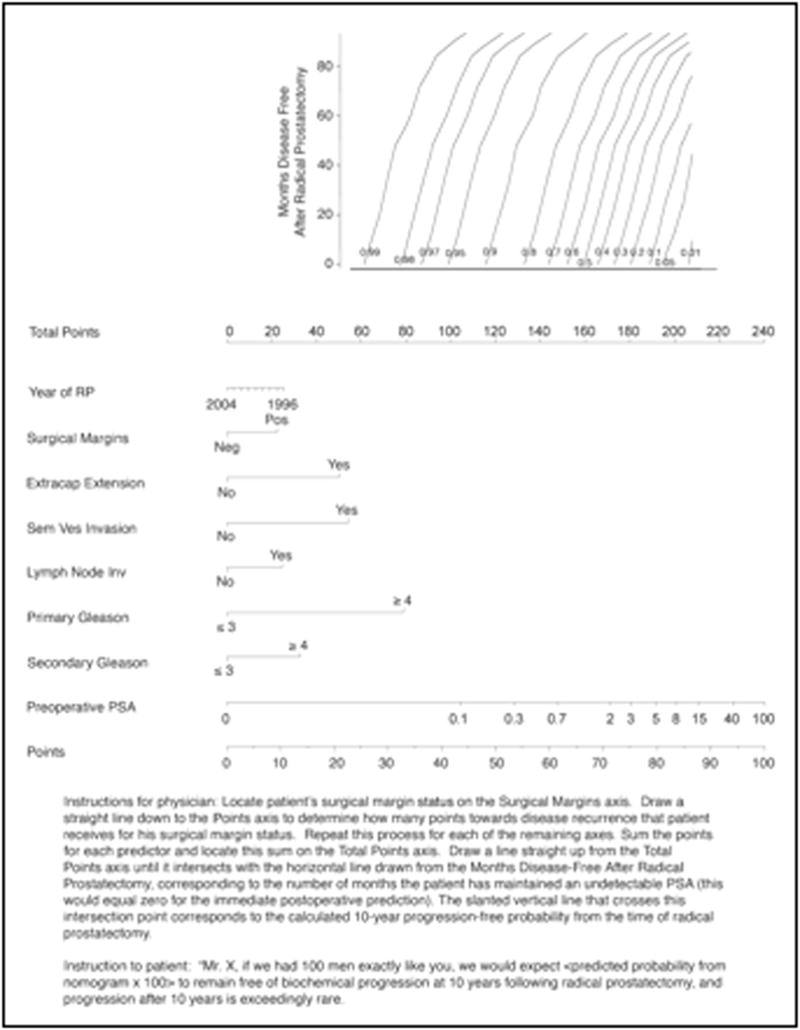
Fig 2.

A) Pre-operative nomogram estimating the 1- to 10-year biochemical recurrence-free probability after radical prostatectomy alone. B) Calibration plot of the nomogram in external validation. The 45° line represents an ideal prediction tool, in which estimates of recurrence are perfectly calibrated with outcome. Vertical bars are 95% confidence intervals for quintiles in the validation set. Reprinted with permission from Stephenson et al [37].
Generalizability
Differences in disease and population characteristics may undermine the discrimination and calibration of predictive tools when applied to a different population. Specific criteria used in defining the sample used to develop a prediction tool may not allow the use of tools for patients with different characteristics or who have been exposed to different treatment modalities. For example, a prediction tool that is specific to screening population may perform differently when applied to a referral population [29]. Similarly, prediction tools that were developed using high-volume single center databases may not be applicable to community practice. Therefore, it is important that clinicians judge whether a specific prediction tool is indeed generalizable and applicable to the population they intend to apply it to [24, 26–28]. Models that do adjust for important factors such as grade and stage are more likely to be generalizable. A model could be useful if it adjusted for the major characteristics.
A prediction tool’s ability to predict a specific outcome may be affected by population characteristics that change over time. In general, more contemporary PCa patients are diagnosed with more favorable stage and grade. Therefore, prediction tools require periodic reappraisals to assess the effect of change of stage and grade on the prediction tool. One may find that predictions devised on historic cohorts are less accurate for contemporary patients. Some prediction tools, however, have shown stable performance characteristics such as discrimination and calibration [30]. External validation in contemporary cohorts is necessary to ensure continued validity.
Level of complexity
The level of complexity of a predictive tool represents an important practical consideration. One has to distinguish between complex algorithms and models with complex inputs required. Complex algorithms have fewer problems because in the future the calculations will be done by computers. However, models with complex inputs are clearly impractical in busy clinical practice. This may, however, become a moot point with the advent of “smart” medical records. On the other hand, the use of variables that are not routinely available, such as novel molecular markers, is impractical.
Adjustment for competing risks
Because of the protracted course of prostate cancer, prediction tools may need to take competing causes of mortality into consideration. Consideration of competing risks is a feature of several prediction tools for patients with bladder cancer.[31–34] Competing risk modeling is able to predict cancer control rates after accounting for the effects of competing risks. Such modeling is important if risk of non–cancer related death is high, or if predictors of death overlap with predictors of the event of interest. If risk of death is relatively low, and predictors of death are separate from predictors of the event of interest, then adjustment for competing risks will have little effect on prediction. For PCa, it seems that there is need to better understand PCa-related risks in the context of other-cause mortality. Predictions that account for competing risks are important to clinicians, as well as to patients, especially when there is danger of over-treatment or sub-optimal treatment. Indeed, since the morbidity and mortality of PCa treatment are not trivial, clinicians must be able to better risk-stratify PCa patients to ensure that treatment is directed toward those who are most likely to benefit from it [35].
Conditional probabilities
A patient’s probability of a future event changes over time; for example, a patient’s risk of disease recurrence within 5 years after radical prostatectomy is higher the day after surgery than if the patient has an undetectable PSA at 48 months. In PCa, because patients’ prognosis is expected to improve with increasing disease-free interval, absence of adjustment for this variable results in an excessively somber estimate of cancer control over time. The updated versions of the pre- and post-operative Kattan nomograms for prediction of biochemical recurrence provide the opportunity to adjust for the effect of disease-free interval from surgery [36, 37]. As expected, the predicted risk of disease recurrence decreases with increasing disease-free interval.
Head-to-head comparison
When judging a new tool, one should compare it with established prediction tools, in order to determine whether the new prediction tool offers advantages over the available alternatives [27, 28, 38–44]. The most direct and unbiased criteria for comparison are the objective attributes of discrimination and calibration. Subsequently, complexity, generalizability, and other attributes may also be compared. This sort of head-to-head comparison is a better approach than judging the concordance index or AUC in isolation or against a possibly arbitrary threshold.
In a head-to-head comparison, each prediction tool being compared is applied to a common external dataset. The prediction tools are applied to each individual observation to derive the probability of the outcome of interest. The predictions are then compared against observed rates of the outcome of interest, and discrimination is calculated using the receiver operating characteristics curve. A common mistake consists of refitting a prediction tool on the same dataset on which it was constructed and describing this as external validation.
Decision-analysis
While discrimination and calibration are important, methods that incorporate clinical consequences are crucial to the evaluation of prediction tools. This type of analysis allows insight into the consequences of using a test, prediction tool, or marker in the clinic. Several methods are available. Decision curve analysis is a method that combines simplicity with efficient computations [45–48]. In brief, the method is based on the principle that the relative harms of false positives (e.g. unnecessary biopsy) and false negatives (e.g. missed cancer) can be expressed in terms of a probability threshold. For example, if a man would opt for biopsy if he was told that his risk of PCa was 20% or more, but not if his risk was less than 20%, it can be shown that he considers that harms associated with a delayed diagnosis of cancer to be four times greater than the harms associated with an unnecessary biopsy (i.e. the ratio of harms is the odds at the probability threshold). This threshold probability can therefore be used both to determine whether an individual patient’s test result should be defined as positive or negative and to weight the clinical consequences of true and false. An example of a decision-curve is shown in Figure 1. The decision analytic evaluation should be performed during later stages of research and before clinical implementation of the tool.
Fig 1.
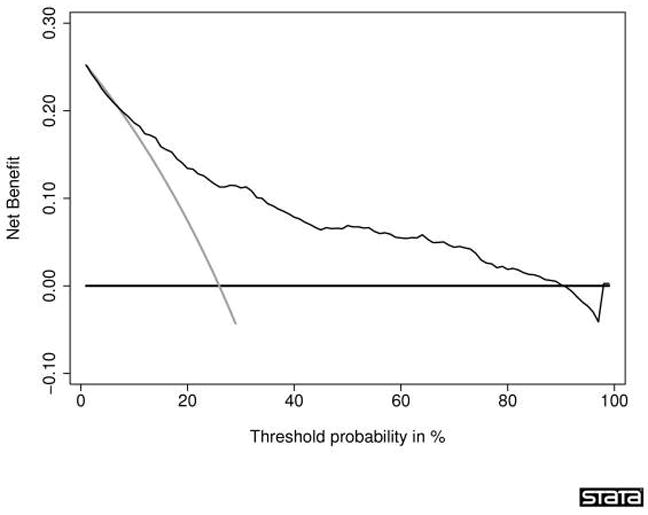
Decision curve for a statistical prediction tool predicting the outcome of prostate biopsy. The thin grey line is the net benefit of biopsying all men; the thin black line is the net benefit of biopsying men on the basis of the statistical prediction tool; the thick black line is the net benefit of biopsying no man. This curve was derived from 740 men undergoing biopsy based on an elevated total PSA. The men had never been previously screened for prostate cancer. Their free PSA was measured and a digital rectal exam was performed. Approximately one-quarter (192) of the men were diagnosed with cancer. Interpretation of the decision curve depends on comparing the net benefit of the test, prediction tool, or marker with that of a strategy of “treat all” (the thin grey line) and “treat none” (parallel to the x axis at net benefit of zero). The strategy with the highest net benefit at a particular threshold probability (pt) is optimal, irrespective of the size of the difference. Determining which men should be biopsied using the statistical prediction tool was superior to biopsying all men with elevated PSA once the threshold probability reached about 10%, and was superior to the strategy of biopsying no man up to a threshold probability of about 90%. To interpret this result, one needs to consider the sort of probability for prostate cancer that men would need before they would decide to have a biopsy. A very risk-averse man might opt for biopsy even if he had only a 10% risk of cancer. However, it seems unlikely that many men would demand, say, a 50% risk of cancer before they had a biopsy; this threshold would imply that an unnecessary biopsy is just as bad as a missed cancer. Reprinted with permission from Vickers et al. [46]
“KATTAN-TYPE” NOMOGRAMS
Various distinct statistical methodologies have broadly been described as “nomograms.” Although widely used as a synonym for “prediction model”, the strict definition of a nomogram is a graphical calculating device that can be based on any type of function [12, 23]. The nomogram usually incorporates at least two variables, which can be either continuous or categorical. The effect of the variables on the outcome of interest is represented by axes, and risk points are attributed according to the prognostic significance of the variable of interest. For example, in the nomogram in Figure 2 [37], each PSA value is assigned a unique point value that represents its prognostic significance. The ‘Total Points’ axis is used to estimate the combined effect of all predictors on the probability of biochemical recurrence. One advantage of this format is that it allows the input of continuously coded variables as well as categorically coded variables, without limit on the number of variables. This format distinguishes nomograms from look-up tables or decision trees, where continuously coded variables cannot be processed and where data availability limits the degree of stratification because of the need to avoid empty cells or dead-end branches.[49]
Nomograms are designed to extract the maximum amount of useful information from the data. For example, the primary and secondary Gleason grades are used as independent variables, rather than the Gleason sum alone. This additional information is useful because several combinations of primary/secondary Gleason grades can result in the same Gleason sum (e.g., 3+4=7 vs 4+3=7) [50], despite a different impact on prognosis.
The available PCa nomograms have been adapted for use on personal digital assistants and personal computers to facilitate their integration into daily clinical practice and research. Many of the nomograms can be found either on the Memorial-Sloan-Kettering Cancer Center (www.nomograms.org) or the University of Montreal (www.nomogram.org) websites.
CURRENTLY AVAILABLE PREDICTION TOOLS
The above discussion is meant to provide guidelines for analyzing and using predictive tools. Next, we provide an overview of predictive tools available for PCa. We describe predictor variables, the outcome of interest, the number of patients utilized to develop the tools, tool-specific features, predictive discrimination estimates, and whether internal and/or external validation has been performed. We focus on nomograms because we believe that they represent one of the most accurate tools to date.
Prediction of PCa on initial and repeat biopsy (Tables 1 and 2)
Table 1.
Prostate biopsy nomograms for prediction of prostate cancer in the initial biopsy
| Reference | Year | Prediction form | No of Patients | Variables | Mean # of cores | Cancer detection | Discrimination | Validation |
|---|---|---|---|---|---|---|---|---|
| Babaian et al. [113] | 1998 | Risk group | 151 | Age, creatinine phosphokinase isoenzyme activity, prostatic acid phosphatase, PSA | 6 | 24% | 74% | Not performed |
| Eastham et al. [51] | 1999 | Probability nomogram development | 700 | Age, race, DRE, PSA (0–4 ng/mL) | 6 | 9% | 75% | Internal |
| Virtanen et al. [114] | 1999 | Neural network | 212 | Percent free PSA, DRE, heredity | Not available | 25% | 81% | Not performed |
| Finne et al. [115] | 2000 | Neural network | 656 | Percent free PSA, PSA, DRE, TRUS | Not available | 23% | Not available | Not performed |
| Horninger et al. [116] | 2001 | Neural network | 3474 | Age, PSA, percent free PSA, DRE, TRUS, PSA density, PSA density of transition zone, transition zone volume | Not available | Not available | Not available | Not performed |
| Kalra et al. [117] | 2003 | Neural network | 348 | Age, ethnicity, heredity, IPSS, DRE, PSA, complexed PSA | 6 | Not available | 83% | Not performed |
| Garzotto et al. [118] | 2003 | Probability nomogram development | 1239 | Age, race, family history, referral indications, prior vasectomy, DRE, PSA (≤10 ng/mL), PSA density, TRUS findings | 6.7 (6–13) | 24% | 73% | Not performed |
| Finne et al. [119] | 2004 | Neural network | 1775 | DRE, percent free PSA, TRUS, PSA | Not available | 22% | 76% | Not performed |
| Karakiewicz et al. [120] | 2005 | Probability nomogram development | 6469 | Age, DRE, PSA, percent free PSA | 6 | 35%–42% | 77% | Internal and external |
| Porter et al. [121] | 2005 | Neural network | 3814 | Age, PSA, gland volume, PSA density, DRE, TRUS | 6 | 27–42% | 72–75% | Internal and external |
| Suzuki et al. [122] | 2006 | Probability nomogram development | 834 | Age, PSA, percent free PSA, prostate volume, DRE | ≥6 | 29% | 82% | Internal |
| Thompson et al.[55] | 2006 | Probability nomogram development | 5519 | Age, race, family history of prostate cancer, PSA level, PSA velocity, DRE result, and previous prostate biopsy | 6 | 21.9% | 65.5% | Internal and external[54] |
| Chun et al. [52] | 2007 | Probability nomogram validation [120] and development | 2900 | Age, DRE, PSA, percent free PSA, sampling density* | 11 (10–20) | 41% | 77% | Internal and external |
| Nam et al. [53] | 2007 | Probability nomogram development | 3108 | Age, ethnicity, family history, urinary symptoms, PSA, percent free PSA, and DRE | 8 (6–15) | 42% | Any cancer: 62% High-grade cancer: 69% |
Internal |
DRE = digital rectal examination; PSA = prostate-specific antigen; TRUS = transrectal ultrasound of the prostate; HGPIN = high-grade intraepithelial neoplasia; ASAP = atypical small acinar proliferation of prostate; IPSS = International Prostate Symptom Score
Sampling density = ratio of TRUS-derived total gland volume to the number of cores at biopsy
Table 2.
Prostate biopsy nomograms for prediction of prostate cancer in settings other than initial biopsy
| Reference | Year | Prediction form | No of Patients | Variables | Median # of previous biopsy sessions | Mean # of cores | Cancer detection | Discrimination | Validation |
|---|---|---|---|---|---|---|---|---|---|
|
Repeat biopsy | |||||||||
| O’Dowd et al. [123] | 2000 | Probability nomogram development | 813 | Age, initial biopsy diagnosis, PSA, percent free PSA | Not available | Not available | 29% | 70% | Not performed |
| Lopez-Corona et al. [56] | 2003 | Probability nomogram development | 343 | Age, DRE, number previous negative biopsies, HGPIN history, ASAP history, PSA, PSA slope, family history, months from initial negative biopsy | 2.9 (2–12) | 9.2 (6–22) | 20% | 70% | Internal |
| Remzi et al. [124] | 2003 | Neural network | 820 | PSA, percent free PSA, TRUS, PSA density, PSA density of the transition zone, transition zone volume | Not available | 8 | 10% | 83% | Not performed |
| Yanke et al. [57] | 2005 | Probability nomogram validation [56] | 230 (356 biopsies) | Age, DRE, number previous negative biopsies, HGPIN history, ASAP history, PSA, PSA slope, family history, months from initial negative biopsy, months from previous negative biopsy | 2.6 (2–7) | 17.9 (12–54) | 34% | 71% | Internal |
| Chun et al. [58] | 2007 | Probability nomogram development | 2393 | Age, DRE, PSA, percent free PSA, number previous negative biopsies, sampling density* | 1.5 (1–7) | 11 (10–24) | 30% | 76% | Internal and external |
|
Saturation biopsy | |||||||||
| Walz et al. [125] | 2006 | Probability nomogram development | 161 | Age, PSA, percent free PSA, prostate and BPH volume, PSA doubling time, PSA density of the transition zone, number of previous biopsy sessions, number of cores at saturation biopsy | 2.5 (2–5) | 24.5 (20–32) | 41% | 75% | Internal |
|
Mixed – Initial and repeat biopsy | |||||||||
| Snow et al. [17] | 1994 | Neural network | 1787 | Age, change on PSA, DRE, PSA, TRUS | Not available | 6 | 34% | 87% | Not performed |
| Carlson et al. [126] | 1998 | Probability table | 3773 | Age, PSA, Percent free PSA | Not available | 6 | 33% | Not available | Internal |
| Djavan et al. [127] | 2002 | Neural network | 272 | PSA density of the transition zone, percent free PSA, PSA density, TRUS (PSA: 2.5–4.0 ng/mL) | Not available | 8 | 24% | 88% | Not performed |
| 974 | PSA density of the transition zone, percent free PSA, PSA velocity, transition zone volume, PSA, PSA density (PSA: 4.0–10.0 ng/mL) | Not available | 8 | 35% | 91% | Not performed | |||
| Stephan et al. [128] | 2002 | Neural network | 1188 | Age, DRE, PSA, percent free PSA, TRUS | Not available | Not available | 61% | 86% | Not performed |
| Porter et al. [129] | 2002 | Neural network | 319 | Age, PSA, gland volume, TRUS, DRE, previous negative biopsy, African-American race | Not available | 9.7 (6–10) | 39% | 76% | Not performed |
| Matsui et al. [130] | 2004 | Neural network | 228 | PSA density, DRE, age, TRUS | Not available | 10–12 | 26% | 73% | Not performed |
| Benecchi [131] | 2006 | Neural network | 1030 | Age, PSA, percent free PSA | Not available | 6–12 | 19% | 80% | Not performed |
| Yanke et al. [132] | 2006 | Probability nomogram development | 8851 | Age, race, PSA, DRE, number of cores | Not available | 6–13 | 27–38% | 75% | Internal |
DRE = digital rectal examination; PSA = prostate-specific antigen; TRUS = transrectal ultrasound prostate; HGPIN = high-grade intraepithelial neoplasia; ASAP = atypical small acinar proliferation of prostate.
Sampling density = ratio of TRUS-derived total gland volume by the number of cores at biopsy
Table 1 shows tools for prediction of PCa on initial biopsy. Eastham et al. developed the first such tools, yielding a c-index of 0.75 [51]. Despite good discrimination, this tool suffers from limited generalizability. The tool was limited to men with suspicious digital rectal examination and serum PSA <4.0 ng/ml. In addition, the tool predicts only the results of sextant biopsies, further limiting its applicability. Chun et al. developed and validated tools in a population subjected to extended biopsy sampling [52]. External validation in three cohorts totaling 2900 men demonstrated 73 to 76% discrimination. Nam et al. developed a prediction tool that predicts an individual’s risk for PCa in a cohort of 3,108 men who underwent a prostate biopsy for the first time.[53] The dataset included a subset of 408 volunteers with normal PSA levels. The tool comprises factors that can be easily determined at the time of screening such as age, ethnicity, family history of PCa, the presence of urinary symptoms, PSA, percent free PSA, and digital rectal examination. The prediction tool’s discrimination was 74% and 77% for high-grade cancer (Gleason score ≥7). This was significantly greater than the AUC that considered using the conventional screening method of PSA and DRE only (62% for any cancer and 69% for high-grade cancer).
The PCPT investigators developed a risk calculator from a large randomized trial with an AUC of 0.70 for the ROC curve in the original cohort and 0.65 in the independent validation cohort.[54, 55] This study is a potentially helpful additions to the growing number of prostate cancer nomograms
Table 2 shows tools for prediction of PCa on repeat biopsy, saturation and mixed indication (initial and repeat biopsy). A tool described by Lopez-Corona et al. was developed and internally validated (70% discrimination) in 343 men [56] and externally validated (71% discrimination) in 230 men [57]. Chun et al. developed the most contemporary repeat biopsy tool (n=1162) based on 10 or more biopsy cores [58]. In three external validation cohorts (n=582, n=961, and n=195) the nomogram yielded 73–76% discrimination.
Prediction of pathologic stage (Table 3)
Table 3.
Prediction of pathologic stage in men treated with radical prostatectomy for clinically localized prostate cancer
| Reference | Year | Prediction form | Outcome | No of Patients | Variables | Discrimination | Validation |
|---|---|---|---|---|---|---|---|
| Narayan et al. [133] | 1995 | Probability graph | Pathologic Stage | 813 | Biopsy based stage, biopsy Gleason sum, PSA | Not available | Not performed |
| Partin et al. [18, 19, 134] | 1993, 1997, and 2007 | Probability table | Pathologic Stage | 703 and 4133 | Biopsy Gleason sum, clinical stage, PSA | Internal: 72% External: 84% |
External [135] and updated [19, 61, 136] |
| Epstein et al. [137] | 1994 | Risk group | Clinically indolent cancer defined as pathologically organ confined, tumor volume ≤ 0.2 cc, Gleason sum < 7) | 157 | Biopsy Gleason sum, millimeter core with cancer, PSA density, no adverse pathologic findings on needle biopsy | Not available | External [138] |
| Goto et al. [139] | 1996 | Risk group | Clinically indolent cancer defined as pathologically organ confined, tumor volume ≤0.5 cc, Gleason sum < 7) | 569 | PSA density, maximal millimeter cancer in any core | Not available | Not performed |
| Kattan et al. [70] | 2003 | Probability nomogram development | Clinically indolent cancer defined as pathologically organ confined, tumor volume ≤0.5 cc, no Gleason grade 4 or 5 | 409 | PSA, primary and secondary biopsy Gleason sum | 64% | Internal and external [29] |
| PSA, primary and secondary biopsy Gleason sum, percent positive cores, TRUS volume | 74% | Internal and external [29] | |||||
| PSA, clinical stage, primary and secondary biopsy Gleason sum, TRUS volume, millimeter core with cancer, millimeter core without cancer | 79% | Internal and external [29] | |||||
| Chun et al. [140] | 2006 | Probability nomogram development | Gleason upgrading between biopsy and radical prostatectomy | 2982 | PSA, clinical stage, primary and secondary biopsy Gleason sum | 80% | Internal |
| Chun et al. [141] | 2006 | Probability nomogram development | Significant Gleason upgrading between biopsy and radical prostatectomy | 4789 | PSA, clinical stage, biopsy Gleason sum | 76% | Internal |
| Steuber et al. [142] | 2006 | Probability nomogram development | Tumor location: transition versus peripheral zone | 945 | PSA, biopsy Gleason sum, positive biopsy cores at mid-prostate only, number of positive biopsy cores at base, cumulative percent biopsy tumor volume | 77% | Internal |
| Peller et al. [143] | 1995 | Probability table | Tumor volume | 102 | Biopsy Gleason sum, number positive sextant cores, PSA | Not available | Not performed |
| Ackerman et al. [144] | 1993 | Probability formula | Surgical margin positivity | 107 | Number positive sextant cores, PSA density | 70% | Not performed |
| Rabbani et al. [145] | 1998 | Probability graph | Surgical margin positivity | 242 | Androgen deprivation, number ipsilateral positive cores, PSA | Not available | Not performed |
| Bostwick et al. [146] | 1996 | Probability graph | Capsular penetration | 314 | Biopsy Gleason sum, percent cancer in biopsy cores, PSA | 78% | Not performed |
| Gamito et al. [147] | 2000 | Neural network | Capsular penetration | 4133 | Age, race, PSA, PSA velocity, Gleason sum, clinical stage | 30–76% | External |
| Gilliland et al. [148] | 1999 | Probability graph | Extracapsular extension | 3826 | Age, biopsy Gleason sum, PSA | 63% | Not performed |
| Ohori et al. [62] | 2004 | Probability nomogram development | Side-specific extracapsular extension | 763 | PSA, clinical stage, side-specific biopsy Gleason sum, side-specific percent positive cores, side-specific percent of cancer in cores | 81% | External [63] |
| Steuber et al. [63] | 2006 | Probability nomogram development | Side-specific extracapsular extension | 1118 | PSA, clinical stage, biopsy Gleason sum, percent positive cores, percent of cancer in positive cores | 84% | Internal |
| Veltri et al. [149] Haese et al. [150] |
2001, 2003 | Ordinal logistic regression and neural network | Organ confined disease | 1287 | Age, PSA, No of cores positive, highest Gleason score, average % tumor involvement per core, presence of Gleason pattern 4/5, midcore with >5% tumor, base and/or midcore with >5% tumor | 93–98.6% | External |
| Badalament et al. [151] | 1996 | Probability formula | Organ confined disease | 192 | Biopsy Gleason sum, involvement of greater than 5% of base with or without apex biopsy, nuclear grade, PSA, total percent tumor involvement | 86% | Not performed |
| Bostwick et al. [146] | 1996 | Probability graph | Seminal vesicle invasion | 314 | Biopsy Gleason sum, percent cancer in cores, PSA | 76% | Not performed |
| Pisansky et al. [152] | 1996 | Probability graph | Seminal vesicle invasion | 2953 | Biopsy Gleason primary grade, clinical stage, PSA | 80% | Internal |
| Koh et al. [64] | 2003 | Probability nomogram development | Seminal vesicle invasion | 763 | PSA, clinical stage, primary and secondary Gleason sum, and percent of cancer at the base | 88% | Internal |
| Baccala et al. [153] | 2007 | Probability nomogram development | Seminal vesicle invasion | 6740 | Age, PSA, Biopsy Gleason sum, clinical stage | 80% | Internal |
| Gallina et al. [65] | 2007 | Probability nomogram development | Seminal vesicle invasion | 896 | PSA, clinical stage, biopsy Gleason sum, percent positive biopsy cores | 79% | Internal and external |
| Ackerman et al. [144] | 1993 | Probability formula | Lymph node invasion assessed with limited pelvic lymphadenectomy | 107 | Number positive sextant cores, PSA | 94% | Not performed |
| Roach et al. [154] | 1994 | Probability graph | Lymph node invasion assessed with limited pelvic lymphadenectomy | 212 | Biopsy Gleason sum, PSA | Not available | Not performed |
| Bluestein et al. [155] | 1994 | Probability graph | Lymph node invasion assessed with limited pelvic lymphadenectomy | 816 | Biopsy Gleason sum, clinical stage, PSA | 82% | Internal |
| Batuello et al. [156] | 2001 | Neural network | Lymph node invasion assessed with limited pelvic lymphadenectomy | 6454 | Biopsy Gleason sum, clinical stage, PSA | 77–81% | Internal and external |
| Cagiannos et al. [66] | 2003 | Probability nomogram development | Lymph node invasion assessed with limited pelvic lymphadenectomy | 5510 | PSA, clinical stage, biopsy Gleason sum | 76% | Internal |
| PSA, clinical stage, biopsy Gleason sum, institution | 78% | Internal | |||||
| Briganti et al. [67, 157, 158] | 2006, 2007 | Probability nomogram development | Lymph node invasion assessed with extended pelvic lymphadenectomy (≥10 nodes) | 602 [67] | PSA, clinical stage, biopsy Gleason sum | 76% | Internal |
| 781 [157] | PSA, clinical stage, biopsy Gleason sum, number of lymph nodes | 79% | Internal | ||||
| 278 [158] | PSA, clinical stage, biopsy Gleason sum, percentage positive biopsy cores | 83% | Internal | ||||
PSA = prostate-specific antigen; TRUS = transrectal ultrasound;
Several multivariable statistical prediction tools have been proposed to estimate pathologic stage at radical prostatectomy (RP) with the intent of facilitating treatment planning (Table 3). Of these, the “Partin tables” represent the most widely used tool. These look-up tables predict pathologic stage at RP [18]. After their introduction in 1993, the Partin tables were validated in 1997 and updated in 2001 and 2007 [19, 59–61]. Although the Partin tables represented a milestone in pretreatment PCa staging, they have limitations. For example, the probability of extracapsular extension (ECE) cannot be predicted in a side-specific fashion. To circumvent this limitation, Graefen et al. devised a regression tree capable of predicting ECE in a side-specific manner [21]. This prediction tool allows the identification of candidates for non–nerve sparing RP versus unilateral versus bilateral nerve-sparing RP. External validation of this prediction tool yielded 70% discrimination [60]
Ohori et al. developed a tool (n=763) to predict side-specific ECE (range of c-index: 79–81%) [62]. Validation of another side-specific prediction tool in 1118 European patients yielded 84% discrimination [63]. Compared to the Partin tables, the tool approach is more accurate and provides side-specific predictions. Moreover, the tools predict ECE independently of seminal vesicle invasion (SVI) and lymph node invasion (LNI) [18, 19, 61].
Koh et al. [64] and Gallina et al [65] used data from 763 patients to devise tools to predict the probability of SVI (range of c-index: 78–88%). Cagiannos et al. developed an LNI prediction tool (n=5,510) yielding 76% discrimination, compared to 74% for the Partin tables tested in the same cohort [66]. Briganti et al. developed an LNI prediction tool from 602 patients who underwent extended pelvic lymphadenectomy (76% discrimination) [67]. In addition, the same investigators developed another tool (n=565) that allows identification of patients who are at a negligible risk of LNI outside the obturator fossa (80% discrimination) and therefore may not require extended pelvic lymphadenectomy [68]. The combination of these tools allows accurate identification of the need for and extent of pelvic lymphadenectomy.
While prediction of adverse pathologic features is important for management of PCa patients, a proportion of patients harbor clinically insignificant or indolent PCa, which cannot be predicted with these tools [69]. To address this void, Kattan et al. developed three prediction tools (range of c-index: 64–79%) that predict the probability of indolent PCa [70] based on the definition of Epstein et al. (i.e., organ-confined cancer, 0.5 cm3 or less in volume, and no poorly differentiated elements) [71]. Steyerberg et al. externally validated these tools in a screening cohort (range of c-index: 61–76%) [29]. These models can reasonably predict the likelihood that a patient has a small, well to moderately differentiated PCa that is confined to the prostate. While pathologic outcome may not define the biological potential of an individual tumor, it provides valuable information to a patient who is considering conservative management of PCa.
These tools allow prediction of clinically insignificant PCa with reasonable discrimination, which may help in deciding between definitive therapy and active surveillance. Conservative management may be appropriate in patients with a high probability of indolent cancer, eg exceeding 60%. In those with a low probability, eg less than 30%, potentially curative management may possibly be advised. Note that these cutoffs for the probability of indolent cancer are speculative and further research is required to give more insight into the pros and cons of prostatectomy in men with a substantial probability of indolent cancer. Other factors may dominate the decision making process in individuals.
Prediction of biochemical recurrence after RP (Table 4)
Table 4.
Pre- and post-operative prediction of biochemical recurrence at 2–10 years in men treated with radical prostatectomy
| Reference | Year | Prediction form | Biochemical recurrence, years | No of Patients | Variables | Discrimination | Validation |
|---|---|---|---|---|---|---|---|
| Pre-operative | |||||||
| Snow et al. [17] | 1994 | Neural network | Not available | 240 | Age, PSA, clinical stage, biopsy Gleason grade, potency | 90% | Not performed |
| Kattan et al. [12] | 1998 | Probability nomogram development | 5 | 983 | Biopsy primary and secondary Gleason grade, clinical stage, PSA | Internal: 74% External: 65–83% |
Internal and external [30, 72, 73, 159] |
| D’Amico et al. [15] | 1999 | Probability table | 2 | 892 | Biopsy Gleason sum, clinical stage, PSA | Not available | Internal |
| Graefen et al. [160] | 1999 | Probability graph | 3.5 | 315 | Biopsy Gleason sum, number of positive cores, PSA | Not available | Not performed |
| D’Amico et al. [16] | 2000 | Probability graph | 2 | 977 | Biopsy Gleason sum, endorectal coil magnetic resonance imaging T-stage, PSA, percent positive biopsy cores | Not available | Internal |
| Tewari et al. [161] | 2001 | Neural network | 3.5 | 1400 | Age, race, PSA, clinical staging, biopsy Gleason sum | 83% | Not performed |
| D’Amico et al. [13, 14] | 1998, 2002 | Probability graph | 4 | 823 | Biopsy Gleason sum, clinical stage, PSA, percent positive biopsy cores | 80% | Internal and external [72, 162] |
| Cooperberg et al. [163] | 2005 | Probability graph | 3 and 5 | 1439 | Age, PSA, biopsy Gleason sum, clinical stage, percent positive biopsy | Internal: 66% External: 68–81% |
Internal and external [164, 165] |
| Stephenson et al. [37] | 2006 | Probability nomogram development | 10 | 1978 and 1545 | PSA, clinical stage, biopsy Gleason sum, year of surgery, number of positive and negative cores | 76–79% | Internal and external |
| Post-operative | |||||||
| Bauer et al. [166] | 1998 | Probability formula | 5 | 378 | Race, PSA, Gleason sum, organ confined status | Not available | External [167] |
| D’Amico et al. [13] | 1998 | Probability graph | 2 | 862 | Pathologic stage, PSA, Gleason sum, surgical margin status | Not available | Not performed |
| Graefen et al. [160] | 1999 | Probability graph | 3.5 | 318 | Pathologic stage, volume Gleason grade 4/5 | Not available | Not performed |
| Potter et al. [168] | 1999 | Neural network | 5 | 214 | Gleason sum, extraprostatic extension, surgical margin status, age, DNA ploidy, and quantitative nuclear grade | 94% | Internal |
| Kattan et al. [11] | 1999 | Probability nomogram development | 5 | 996 | PSA, Gleason sum, extracapsular extension, seminal vesicle invasion, lymph node invasion, surgical margin status | Internal: 89% External: 77–83% |
Internal and external [74, 78, 169] |
| Stamey et al. [170] | 2000 | Probability formula | Unknown | 326 | PSA, percent Gleason grade 4/5, volume largest cancer, vascular invasion, prostate weight, percent intraductal cancer, lymph node invasion | Not available | Not performed |
| McAleer et al. [171] | 2005 | Probability graph | 7 | 2417 | Gleason grade, stage, margin status, dichotomized PSA (cut point 10 ng/mL). | Not available | Internal |
| Stephenson et al. [36] | 2005 | Probability nomogram development | 10 | 1881, 1782, and 1357 | PSA, Gleason sum, extracapsular extension, seminal vesicle invasion, lymph node invasion, surgical margin status | 78–86% | Internal and external |
| Suardi et al. [36] | 2008 | Probability nomogram development | 5, 10, 15, and 20 | 601 (develop ment), 2963 and 3178 (external) | Gleason sum, pathologic stage, surgical margin status, type of surgery, adjuvant radiotherapy | Internal: 77–81% External: 77–86% |
Internal and external |
Before RP
Kattan et al. developed the first pre-treatment prediction tool (n=983), which predicts the 5-year biochemical recurrence for patients treated with RP [12]. External validation yielded accuracies of ~75% (range: 65%–83%) [72–74]. However, the 5-year endpoint is insufficient to predict the likelihood of cure after RP, as patients are still at risk of disease recurrence beyond 5 years [75–77]. Therefore, Stephenson et al. recently updated the pre-operative prediction tool by predicting the 10-year probability of biochemical recurrence after RP (Figure 2A; 77% discrimination) [37]. The prediction tool exhibited good calibration across the spectrum of predictions in internal validation but exhibited some optimism in external validation (Figure 2B). An added feature of the tool is the ability to estimate the probability of recurrence at any point in time from 1 to 10 years after RP, accounting for disease-free interval.
After RP
Kattan et al. also developed a post-operative tool for prediction of 5-year biochemical recurrence using data from 996 men treated with RP for clinically localized PCa by a single surgeon (73% discrimination) [11]. External validation yielded accuracies of 80% (range: 77%–82%) in an international cohort [78] and 83% in an African-American cohort [74]. Stephenson et al. updated the post-operative tool by including contemporary patients and extending predictions up to 10 years after RP while accounting for disease-free interval (Figure 3) [36]. External validation yielded a discrimination of 78% to 81% [36]. Suardi et al. developed the furthest-reaching prediction tool, which provides the probability of biochemical recurrence up to twenty years after RP. Their prediction tool also accounts for disease-free interval. The prediction tool’s discrimination (77–83%) was confirmed in two external validation cohorts [79].
Fig 3.
Post-operative nomogram predicting 10-year biochemical recurrence-free probability after radical prostatectomy. Reprinted with permission from Stephenson et al [36].
Prediction of biochemical recurrence after external beam radiotherapy or brachytherapy (Table 5)
Table 5.
Pre-treatment prediction of biochemical recurrence at 2–10 years in men treated with radiotherapy
| Reference | Year | Prediction form | Biochemical recurrence, years | No of Patients | Variables | Discrimination | Validation |
|---|---|---|---|---|---|---|---|
| External beam radiotherapy | |||||||
| Duchesne et al. [172] | 1996 | Risk group | 5 | 85 | PSA, biopsy Gleason sum | Not available | Not performed |
| Pisansky et al. [173] | 1997 | Risk group | 5 | 500 | Biopsy Gleason sum, clinical stage, PSA | Not available | Internal |
| Zagars et al. [174] | 1997 | Probability graph | 6 | 938 | PSA, biopsy Gleason sum, clinical stage | Not available | Not performed |
| D’Amico et al. [15] | 1999 | Probability table | 2 | 762 | Biopsy Gleason sum, clinical stage, PSA | Not available | Not performed |
| Shipley et al. [175] | 1999 | Probability table | 5 | 1607 | Biopsy Gleason sum, clinical stage, PSA | Not available | Not performed |
| Kattan et al. [81] | 2000 | Probability nomogram development | 5 | 1042 and 1030 | PSA, biopsy Gleason sum, clinical stage, neoadjuvant androgen deprivation therapy, radiation dose delivered | 73% | Internal |
| D’Amico et al. [82, 83] | 1998, 2002 | Probability graph | 5 | 766 | Biopsy Gleason sum, clinical stage, PSA, treatment modality | Not available | Internal |
| Brachytherapy | |||||||
| D’Amico et al. [83] | 1998 | Probability graph | 5 | 218 | Biopsy Gleason sum, clinical stage, PSA, neo-adjuvant therapy | Not available | Not performed |
| Ragde et al. [176] | 1998 | Risk group | 10 | 98 | Age, biopsy Gleason sum, clinical stage, PSA, 45 Gy external beam radiotherapy | 76% | Internal |
| Kattan et al. [84] | 2001 | Probability nomogram development | 5 | 920 and 1827 and 765 | Biopsy Gleason sum, clinical stage, PSA, co-administration of external beam radiotherapy | 61–64% | Internal and external |
An important aspect of pre-treatment counseling is pre-treatment estimates of the outcomes if treated with three-dimensional conformal external beam radiotherapy or brachytherapy. Table 5 shows prediction tools that predict biochemical recurrence after radiation therapy, all of them using the original American Society for Therapeutic Radiology and Oncology (ASTRO) definition of biochemical recurrence as 3 consecutive increases in PSA [80]. Kattan et al. developed a pre-treatment prediction tool to predict the 5-year biochemical recurrence-free probability after three-dimensional conformal external beam radiotherapy (n=1042; Figure 4) [81]. External validation within a cohort of 912 men yielded a discrimination of 76% [82, 83].
Fig 4.
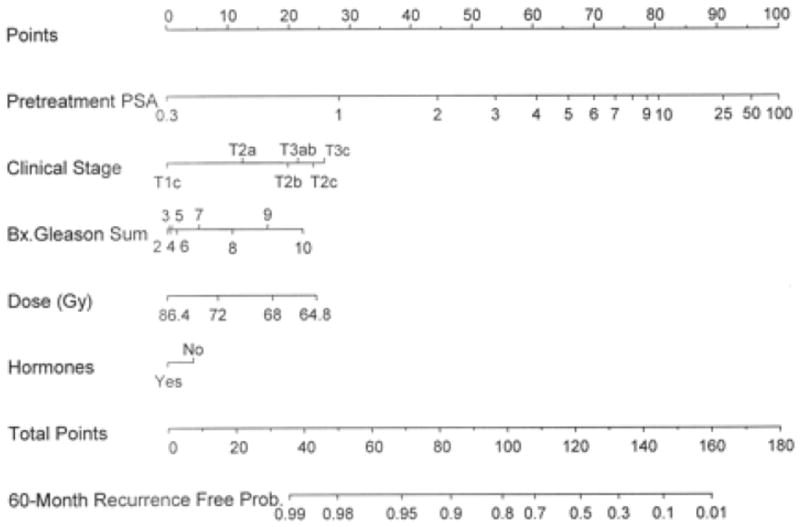
Pre-treatment nomogram for predicting 5-year biochemical recurrence–free probability after three-dimensional conformal radiation therapy (3D-CRT). Reprinted with permission from Kattan et al [81]. XRT= external beam radiation therapy.
The same authors developed a prediction tool that predicts 5-year biochemical recurrence-free survival after 125I brachytherapy without adjuvant hormonal therapy (n=920, Figure 5) [84]. Two separate external validations resulted in discriminations of 61% (n=1827) and 64% (n=765). Minor differences in the population characteristics account for the different discrimination in the different validation populations.
Fig 5.
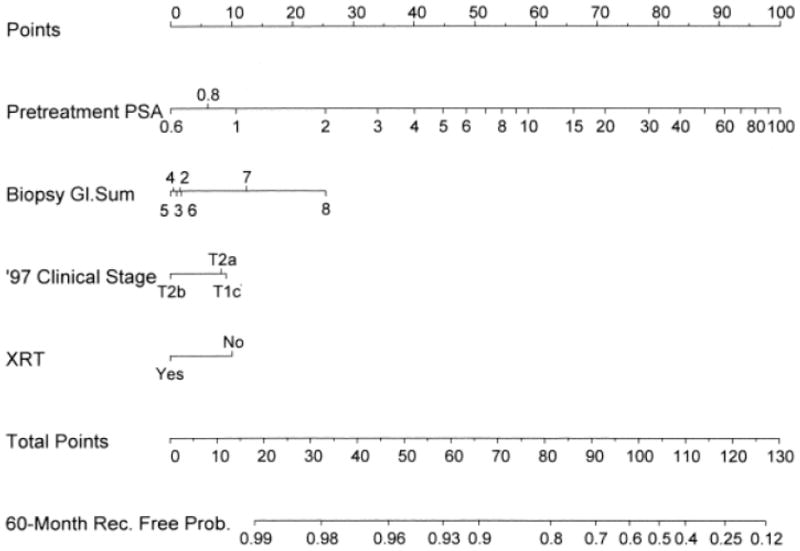
Pre-treatment nomogram for predicting 5-year biochemical recurrence–free probability after permanent prostate brachytherapy without neo-adjuvant androgen ablative therapy. Reprinted with permission from Kattan et al [84].
Prediction of metastatic progression (Table 6)
Table 6.
Prediction of metastasis and survival
| Reference | Year | Prediction form | Patient population | Outcome (years) | No of Patients | Variables | Discrimination | Validation |
|---|---|---|---|---|---|---|---|---|
| Partin et al. [177] | 1994 | Probability graph | Radical prostatectomy | Local versus distant recurrence | 1058 | PSA velocity, Gleason sum, pathologic stage | Not available | Not performed |
| Pound et al. [75] | 1999 | Probability table | Biochemical recurrence after radical prostatectomy | Metastasis (7 years after biochemical recurrence) | 315 | PSA doubling time, Gleason sum, time to biochemical recurrence | 56% | Not performed |
| D’Amico et al. [178] | 2003 | Probability graph | Radical prostatectomy | Prostate cancer-specific mortality (8) | 4946 | Biopsy Gleason sum, clinical stage, PSA | Not available | Internal |
| Dotan et al. [86] | 2005 | Probability nomogram development | Biochemical recurrence after radical prostatectomy | Positive bone scan | 239 | Pre-treatment PSA, surgical margin status, seminal vesicle invasion, Gleason sum, trigger PSA, extracapsular extension, PSA slope, PSA velocity | 93% | Internal |
| Freedland et al. [76] | 2005 | Probability table | Biochemical recurrence after radical prostatectomy | Cancer-specific survival (10 years after biochemical recurrence) | 379 | PSA doubling time, Gleason sum, time from surgery to biochemical recurrence | 59% | Not performed |
| D’Amico et al. [179, 180] | 2002, 2003 | Probability graph | External beam radiotherapy | Prostate cancer-specific mortality (10) | 381 | Biopsy Gleason sum, clinical stage, PSA, percent positive biopsy | Not available | Internal |
| 94 | Time to PSA failure, post-treatment PSA doubling time, timing of salvage hormonal therapy. | |||||||
| D’Amico et al. [178] | 2003 | Probability graph | External beam radiotherapy | Prostate cancer-specific mortality (8) | 2370 | Biopsy Gleason sum, clinical stage, PSA | Not available | Internal |
| Kattan et al. [85] | 2003 | Probability nomogram development | External beam radiotherapy | Metastasis (5) | 1677 and 1626 | PSA, clinical stage, biopsy Gleason sum | 81% | Internal and external |
| Slovin et al. [87] | 2005 | Probability nomogram development | External beam radiotherapy | Metastasis (1–2) | 148 | Baseline PSA, PSA doubling time, Pathologic T stage, Gleason sum | 69% | Not performed |
| Zhou et al. [181] | 2005 | Probability graph | External beam radiotherapy | Prostate cancer-specific mortality (5) | 661 | PSA doubling time, biopsy Gleason sum | Not available | Internal |
| Stephenson et al. [182] | 2007 | Probability nomogram development | Salvage radiotherapy for biochemical recurrence after radical prostatectomy | Biochemical recurrence after radiotherapy (7 years after biochemical recurrence) | 1540 | Prostatectomy PSA, Gleason sum, seminal vesicle invasion, extracapsular extension, surgical margin status, lymph node metastasis, persistently elevated PSA after radical prostatectomy, pre-radiotherapy PSA, PSA doubling time, neoadjuvant androgen-deprivation therapy, radiation dose | 69% | Internal |
| Zhou et al. [181] | 2005 | Probability graph | Biochemical recurrence after radical prostatectomy | Prostate cancer-specific mortality (5) | 498 | PSA doubling time | Not available | Internal |
| Slovin et al. [87] | 2005 | Probability nomogram development | Biochemical recurrence after radical prostatectomy or radiotherapy | Metastasis (1–2) | 148 | Baseline PSA, PSA doubling time, Pathologic T stage, Gleason sum | 69% | Not performed |
| Svatek et al. [183] | 2006 | Probability nomogram development | Androgen-independent prostate cancer | Prostate cancer-specific mortality (1–5) | 129 | PSA at initiation of androgen-deprivation therapy, PSA doubling time, nadir {SA on androgen-deprivation therapy, time from androgen-deprivation therapy to androgen-independent prostate cancer | 81% | Internal |
| Smaletz et al. [90] | 2002 | Probability nomogram development | Men with progressive metastatic prostate cancer after castration | Overall survival (1–2) | 409 and 433 | Age, Karnofsky performance index, hemoglobin, PSA, lactic dehydrogenase, alkaline phosphatase, albumin | 71% | Internal and external |
| Porter et al. [89] | 2007 | Probability nomogram development | Men on androgen-deprivation therapy after radical prostatectomy | Prostate cancer-specific mortality (2–5) | 66 | Pathologic T stage, Gleason sum, surgical margin status, age at androgen-deprivation therapy, recurrence type | 66% | Internal |
| Halabi et al. [91] | 2003 | Probability nomogram development | Metastatic hormone-refractory prostate cancer | Overall survival (1–2) | 1101 | Lactate dehydrogenase, PSA, alkaline phosphatase, Gleason sum, Eastern Cooperative Oncology Group performance status, hemoglobin, presence of visceral disease | 68% | Internal and external |
| Armstromg et al. [88] | 2007 | Probability nomogram development | Hormone-refractory prostate cancer | Overall survival (1, 2, and 5) | 1006 | Liver metastases, number of metastatic sites, clinically significant pain, Karnofsky performance status, type of progression (measurable progression and bone scan progression), pretreatment PSA doubling time, PSA, tumor grade, alkaline phosphatase, and hemoglobin | 69% | Internal |
To address metastatic progression after definitive therapy, Kattan et al. developed a prediction tool quantifying the probability of metastatic progression within five years following external beam radiotherapy (n=1,677) [85]. The prediction can be made immediately after definitive therapy. Its external validation demonstrated a discrimination of 81% (n=1,626).
Dotan et al. developed a tool to predict the probability of metastatic progression, defined as a positive bone scan, in 239 men with a rising PSA after RP [86]. The tool relies on detailed serum PSA characteristics including kinetics and therefore requires multiple post-recurrence PSA values. The prediction tool discrimination is 93%.
Slovin et al. devised a similar tool predicting the time to radiographically detectable metastases in patients with biochemical recurrence (n=148) after either RP or external beam radiotherapy. Similar to the prediction tool from Dotan et al., the tool from Slovin et al. requires the consideration of PSA kinetics in the form of PSA doubling time and is limited to patients whose doubling time is less than 12 months [87]. The predictive discrimination of this prediction tool was 69%, but it was neither internally nor externally validated.
Armstrong et al. developed a tool using baseline clinical variables to predict death among men with metastatic hormone-refractory prostate cancer (n=1,006) using data from the TAX327 randomized clinical trial (three week or weekly docetaxel or mitoxantrone, each with prednisone).[88] Ten independent prognostic factors other than treatment group were included: presence of liver metastases, number of metastatic sites, clinically significant pain, Karnofsky performance status, type of progression (measurable disease progression and bone scan progression), pretreatment PSA doubling time, PSA, tumor grade, alkaline phosphatase, and hemoglobin. The predictive discrimination of this prediction tool was 69%. External prospective validation may support the wider use of this prognostic baseline model for men with HRPC treated with chemotherapy.
Prediction of survival (Table 6)
Four tools have been devised for prediction of survival in PCa patients. One predicts cause-specific survival in PCa patients exposed to hormonal therapy, regardless of the time of hormonal therapy initiation. The remaining three tools predict the probability of all-cause survival in patients with androgen-insensitive PCa (AIPC).
Porter et al. developed a tool for prediction of cause-specific survival in patients exposed to hormonal therapy after RP failure (n=114) [89]. The internally validated discrimination of the tool was only 66%. Among the three prediction tools for AIPC patients, those of Smaletz et al [90] and of Halabi et al [91] were developed and externally validated in heavily pretreated patients, who had been exposed to one to several experimental agents. In external validation, the accuracy of the prediction tool of Smaletz et al. was 67% and that of Halabi et al. was 67% and 68%.
Svatek et al. devised a contemporary prediction tool using a population with a median survival of 52 months who had not received experimental therapies. This prediction tool relies predominantly on PSA doubling time and PSA level at hormone therapy initiation. Internal validation of this prediction tool yielded a discrimination of 81%. The contemporaneity and homogeneity of the patient population make this prediction tool very attractive when survival needs to be assessed in patients with AIPC.
Prediction of life expectancy (Table 7)
Table 7.
Prediction of life expectancy in men with clinically localized prostate cancer
| Reference | Year | Prediction form | Outcome | No of Patients | Variables | Discrimination | Validation |
|---|---|---|---|---|---|---|---|
| Albertson et al. [95] | 1996 | Probability formula | Overall survival (10 years) | 451 | Age, Gleason sum and index of coexistent disease category | 71% | Not performed |
| Tewari et al. [93] | 2004 | Probability graph | Overall survival (10 years) | 6149 | Age, race, comorbidity, PSA, Gleason sum, treatment type | 63% | Not performed |
| Cowen et al. [94] | 2006 | Probability nomogram development | Life expectancy (5–15 years) | 506 | Age, Charlson comorbidity index, presence of angina, systolic blood pressure, body mass index, smoking, marital status, PSA< Gleason sum, clinical stage, treatment type (radical prostatectomy vs radiotherapy vs other) | 73% | Internal |
| Walz et al. [97] | 2007 | Probability nomogram development | Life expectancy (10 years) | 9131 (5,955 treated with radical prostatectomy and 3,176 with external beam radiotherapy) | Age, Charlson comorbidity index, treatment type (radical prostatectomy vs external beam radiotherapy) | 84.3% | Internal |
Life expectancy is a crucial consideration in treatment decisions, especially in patients who are candidates for definitive therapy. Ten years is generally accepted as the minimal life expectancy pre-requisite for curative local treatment in men with PCa. Unfortunately, life tables are not reliable for prediction of life expectancy in definitive therapy candidates, demonstrating only 60% discrimination [92]. Moreover, clinicians are also poor raters of life expectancy, with 19 clinicians yielding only 69% discrimination. To circumvent this problem, Tewari et al. (n=3159) [93], Cowen et al. (n=506) [94], and Albertsen et al. (n=451) [95, 96] developed prediction tools predicting life expectancy in men with PCa. The discrimination of these prediction tools ranged from 69% to 73%. Unfortunately none of the three prediction tools is capable of discerning between PCa-specific and all-cause mortality. To address these considerations, Walz et al. devised a tool for prediction of life expectancy in excess of 10 years in candidates for RP and external beam radiotherapy (n=9131) [97]. The prediction tool focused on patients without evidence of cancer relapse after definitive therapy. The predictors consist only of age and co-morbidities. Internal validation of this tool yielded 84% discrimination vs. 81% for the prediction tool of Tewari et al. Based on discrimination, simplicity, and generalizability, the prediction tool of Walz et al. appears to provide the best estimates of life expectancy in excess of 10 years.
Prediction tools of the future: inclusion of novel biomarkers and imaging tools (Table 8)
Table 8.
Prediction of specific pathologic features or biochemical recurrence in men treated with radical prostatectomy for clinically localized prostate cancer based on novel variables
| Reference | Year | Prediction form | Novel variable | Outcome | No of Patients | Variables | Discrimination | Validation |
|---|---|---|---|---|---|---|---|---|
| Pre-operative | ||||||||
| Wang et al. [184] | 2006 | Probability nomogram development | MRI and magnetic resonance spectroscopic imaging | Lymph node invasion | 411 | MRI variables and Partin probability table [18] | 89% | Internal |
| Wang et al. [106] | 2007 | Probability nomogram development | MRI and magnetic resonance spectroscopic imaging | Seminal vesicle invasion | 573 | MRI variables and pre-operative Kattan probability nomogram [12] | 87% | Internal |
| Shukla-Dave et al. [107] | 2007 | Probability nomogram development | MRI and magnetic resonance spectroscopic imaging | Insignificant cancer (organ-confined cancer of ≤ 0.5 cm3 with no poorly differentiated elements) | 220 | Pretreatment PSA, clinical stage, biopsy cores positive, pretreatment MRI volume of prostate, and overall MRI/MRSI score | 85% | Internal |
| Kattan et al. [100] | 2003 | Probability nomogram development | Plasma levels of transforming growth factor β1 and interleukin 6 soluble receptor | Biochemical recurrence | 714 | Preoperative plasma transforming growth factor β1 and interleukin 6 soluble receptor and pre-operative Kattan probability nomogram [12] | 83% | Internal |
| Shariat et al. [185] | 2007 | Probability nomogram development | Plasma levels of plasminogen activator inhibitor 1 | Biochemical recurrence | 429 | Preoperative plasma plasminogen activator inhibitor 1 and pre-operative Kattan probability nomogram [12] | 79% | Internal |
| Post-operative | ||||||||
| Stephenson et al. [101] | 2005 | Probability nomogram development | Gene expression based on oligonucleotide microarrays | Biochemical recurrence | 79 | Gene expression signatures and post-operative Kattan probability nomogram [11] | 89% | Internal |
MRI = magnetic resonance imaging
The discrimination of current predictive tools is imperfect. To date, discrimination has not been significantly improved by the addition of other potentially informative clinical and pathologic features [98, 99]. Discrimination may, however, potentially be improved by incorporation of novel biomarkers and/or imaging data that are associated with the biologic behavior of PCa.
Over the past two decades, the molecular dissection of cancer has increased our understanding of the pathways that are altered in neoplastic cells. Protein expression profiling of PCa offers an alternative means to distinguish aggressive tumor biology and may improve the accuracy of outcome prediction. In addition, such markers may serve as prognosticators and/or therapeutic targets that facilitate the emergence of new therapeutic approaches.
However, despite numerous reports of promising new biomarkers in the urological literature, to date only a few studies have demonstrated an important improvement in predictive discrimination when biomarkers were added to established predictors in prediction tools (example: Figure 6) [43, 97, 100–105].
Fig 6.

Pre-treatment nomogram for predicting 5-year biochemical recurrence-free probability after radical prostatectomy including pre-operative plasma levels of transforming growth factor β1 and interleukin-6 soluble receptor. Reprinted with permission from Kattan et al [100].
Kattan et al. [100] developed and internally validated a prognostic prediction tool that incorporates pre-operative plasma levels of transforming growth factor-β1 and interleukin-6 soluble receptor in the standard pre-operative Kattan nomogram (which uses pre-operative PSA, biopsy Gleason grade, and clinical stage to predict the probability of biochemical recurrence-free survival at 5 years after RP) [12]. Addition of these biomarkers improved the predictive accuracy by a statistically and prognostically substantial margin relative to clinical variables alone (increase in accuracy from 75% to 83%). This prognostic tool was externally validated in an independent cohort comprising 423 consecutive men who underwent radical prostatectomy [104]. The validation prediction tool provided a discrimination of 87.9% versus 71.1% for the tool including clinical variables only (16.8% difference; P < .001). Moreover, the prediction tool was better calibrated than the tool including clinical variables only. These prediction tools further refine our ability to identify patients at a high risk of biochemical recurrence after radical prostatectomy.
Non-invasive diagnostic imaging, especially magnetic resonance imaging (MRI) and MR spectroscopic imaging (MRSI), has improved in recent years and is gaining widespread acceptance for aiding PCa diagnosis, tumor localization, staging, assessment of tumor aggressiveness, and treatment planning. Investigators have used nomograms and neural network prediction tooling to predict organ-confined PCa [106], clinically significant disease [107], and biochemical recurrence after RP [108].
FUTURE GOALS
The paucity of randomized trials in PCa makes diagnostic and treatment decisions complex. Prediction tools can provide predictions that are evidence-based and at the same time individualized. Such predictions have been repeatedly shown to be more accurate than those of clinicians, regardless of their level of expertise [7, 10]. Prediction tools such as nomograms have been embraced by the urologic community. The nomogram format has also been adopted in several other disciplines of oncology, including breast, colon, bladder, gastric, and lung cancers.
PCa patients need to be involved in decisions regarding management of their disease. They should know what their options are and what the consequences can be. At the core of any patient involvement would be accurate prediction of consequences and, essentially, a spreadsheet of these predictions tailored to the individual. This spreadsheet would help make consent for any medical decision truly informed. Providing this information could reduce the likelihood of regret of treatment choice, particularly when complications arise.
Continuous multivariable prediction tools such as nomograms are a highly appealing means of calculating accurate predictions with or without the use of a computer. Nomograms currently represent one of the most accurate and discriminating tools for predicting outcomes in patients with PCa [25, 39–41, 109–111]. When faced with the difficult decision of choosing among the treatment options for each clinical stage of PCa, patients benefit from the accurate estimates of outcomes provided by predictive tools. Equipped with these predictions, patients are more likely to be confident in their treatment decisions and less likely to experience regret in the future. However, we emphasize that the predictions must be interpreted as such; they do not make treatment recommendations or act as a surrogate for physician-patient interactions, nor do they provide definitive information on symptomatic disease progression or complications associated with treatments.
The fundamental issue of predictive tools such as nomograms pertains to their utility. Indeed, very limited data exist with respect to the impact of nomograms on medical decision-making. Although studies have shown that decision aids improve patient knowledge and affect medical decision-making behavior [112], the role of tools has yet to be studied sufficiently. There are no prospective randomized studies that clearly demonstrate that the use of prediction tools improve patient care or reduce patient anxiety, decisional conflict, or regret. A clinical trial would be very valuable for establishing the effects of prediction tools; however, whereas informing patients with predictions regarding the impact of a medical procedure seems ethical, withholding accurate outcome predictions from patients in a control group in a randomized trial does not. Such a trial would likely be associated with significant power problems, on the grounds that a nomogram would be worth using even for a small improvement in outcome. Presently, patients are using very limited quantitative information when making their decisions, and direct outcome predictions are the simplest factors for them to consider. Nevertheless, prospective evaluation of prediction tools and decision analytic methods would be beneficial.
Besides being required for improved medical decision-making, accurate risk estimates are also required for evaluation of novel markers and for design of clinical trials, for example to enable the selection of homogeneous groups of patients as study participants. Prediction tools have the potential of improving the ability of Phase II trials to discriminate between ineffective and potentially effective therapies. Prediction tools may help enroll populations that are homogeneous with respect to risk. In addition, they would allow comparison with other studies and historical controls based on risk. For Phase III trials, prediction tools can help to ensure that eligible patients have sufficiently high levels of risk, thereby increasing event rates and reducing sample size requirements. Risk prediction tools define high-risk patients more accurately than do risk-grouping strategies [39, 109]. Use of risk predictions for individual patients, therefore, decreases the proportion of low-risk patients enrolled, avoiding unethical inclusion, as well as increasing statistical power. Finally, future designs of Phase III trials should include prediction tools to increase the clinical utility of their findings. We therefore recommend the wider adoption of risk prediction tools and decision analysis in the design, analysis, and implementation of clinical trials.
Areas of future research include the integration of genomic/molecular markers and development of prediction tools that predict additional clinically significant endpoints such as clinical recurrence, cause-specific death, long-term survival, and outcomes related to morbidity and quality of life. Models that use updated post-treatment information based on biomarkers such as PSA will and do play a very important role in decisions about new treatment when recurrence is suspected.
Better modeling may allow for adjustment of the trend of decreased accuracy (discrimination ~ 60–70%) for “longer” predicted endpoints such as metastasis and survival compared to those for diagnosis, stage of PCA or disease recurrence (discrimination usually better than 70%). Moreover, with the advent of novel therapies such as laparoscopic/robotic prostatectomy, high-intensity focused ultrasound, and focal ablative therapy, tools specific to these procedures are needed.
CONCLUSIONS
Patients with PCa are heterogeneous with respect to disease aggressiveness, age, comorbidities, and personal preferences. Therefore, to obtain optimal cancer control with minimal side effects, treatment should be tailored to each individual patient and the characteristics of his tumor. In order to make an informed decision, many patients want to know their likely outcomes, and clinicians need to provide accurate estimates of these outcomes. Despite limitations, predictive tools can provide individualized, evidence-based estimates for a number of PCa endpoints, thereby helping in the complex decision-making process. Moreover, predictive tools provide an objective justification for clinical decisions, which is increasingly demanded by patients, administrators, peers, and third-party payers.
EXECUTIVE SUMMARY.
Predictive prediction tools have been repeatedly shown to be more accurate at predicting risk than are clinicians, regardless of their level of expertise.
For evaluating and comparing predictive tools, discrimination and calibration are the most important criteria.
Other considerations include the tools’ generalizability and complexity and it accounts for competing risks and/or conditional probabilities.
Head-to-head comparisons are necessary to identify the most accurate tool. Towards this, the different tools’ discrimination and calibration is assessed in a common dataset that is not the same set used in development of any of the tools.
The clinical consequences of use of prediction tools can be evaluated by decision-analysis.
Nomograms
Nomograms are graphical calculating devices that can incorporate continuous as well as categorical variables
A strength of nomograms is the ability to prediction tool non-linear relationships between variables and outcome, with no limit on the number of variables that can be incorporated.
Currently Available Prediction Tools
Predictive tools are available to predict many endpoints in prostate cancer, including presence of cancer on biopsy, various aspects of pathologic stage, biochemical recurrence after treatment, progression to metastases, and survival.
Although some of these tools exhibit good discrimination and calibration, many have not been externally validated, and few have been directly compared to other tools that predict the same endpoint.
Incorporation of novel biomarkers or imaging results can increase the accuracy over that provided by clinical and pathologic characteristics alone.
Future Goals
The clinical utility of predictive tools should be evaluated in prospective clinical trials.
Prediction tools offer a way to get patients more involved in decision-making, allowing them to give truly informed consent and, perhaps, reducing the likelihood of later regret.
Prediction tools also have potential for improving phase II clinical trials, by allowing the selection of uniform study cohorts and by providing a criterion for comparison between different trials.
Prediction tools are still needed for a number of endpoints, including clinical recurrence, cause-specific death, long-term survival, outcomes related to morbidity and quality of life, and outcomes after novel therapies.
Acknowledgments
Supported by:
1. The Sidney Kimmel Center for Prostate and Urologic Cancers.
2. T32 grant from the National Institute of Health (T32CA082088).
We thank Janet Novak, PhD, for substantive editing of the manuscript. This work was paid for by MSKCC.
Footnotes
Conflict of Interest Statement
MWK and PTS are co-inventors of several patents and patent applications (20070111269 Method to predict positive repeat prostate biopsy; 20050282199 Method to predict prostate cancer; 20030235816 Method to determine outcome for patients with prostatic disease).
SFS is co-inventor of two patent applications (20030235816 Method to determine outcome for patients with prostatic disease; 20030054419 Method to determine prognosis after therapy for prostate cancer).
References
- 1.Jemal A, Siegel R, Ward E, Hao Y, Xu J, Thun MJ. Cancer statistics, 2009. CA Cancer J Clin. 2009;59:225–49. doi: 10.3322/caac.20006. [DOI] [PubMed] [Google Scholar]
- 2.Miles BJ, Giesler B, Kattan MW. Recall and attitudes in patients with prostate cancer. Urology. 1999;53:169–74. doi: 10.1016/s0090-4295(98)00456-7. [DOI] [PubMed] [Google Scholar]
- 3.Clark JA, Wray NP, Ashton CM. Living with treatment decisions: regrets and quality of life among men treated for metastatic prostate cancer. J Clin Oncol. 2001;19:72–80. doi: 10.1200/JCO.2001.19.1.72. [DOI] [PubMed] [Google Scholar]
- 4.Elstein AS. Heuristics and biases: selected errors in clinical reasoning. Acad Med. 1999;74:791–4. doi: 10.1097/00001888-199907000-00012. [DOI] [PubMed] [Google Scholar]
- 5.Vlaev I, Chater N. Game relativity: how context influences strategic decision making. J Exp Psychol Learn Mem Cogn. 2006;32:131–49. doi: 10.1037/0278-7393.32.1.131. [DOI] [PubMed] [Google Scholar]
- 6.Hogarth RM, Karelaia N. Heuristic and linear models of judgment: matching rules and environments. Psychol Rev. 2007;114:733–58. doi: 10.1037/0033-295X.114.3.733. [DOI] [PubMed] [Google Scholar]
- 7.Ross PL, Gerigk C, Gonen M, et al. Comparisons of nomograms and urologists’ predictions in prostate cancer. Semin Urol Oncol. 2002;20:82–8. doi: 10.1053/suro.2002.32490. [DOI] [PubMed] [Google Scholar]
- 8.Ross PL, Scardino PT, Kattan MW. A catalog of prostate cancer nomograms. J Urol. 2001;165:1562–8. [PubMed] [Google Scholar]
- 9.Specht MC, Kattan MW, Gonen M, Fey J, Van Zee KJ. Predicting nonsentinel node status after positive sentinel lymph biopsy for breast cancer: clinicians versus nomogram. Ann Surg Oncol. 2005;12:654–9. doi: 10.1245/ASO.2005.06.037. [DOI] [PubMed] [Google Scholar]
- 10**.Walz J, Gallina A, Perrotte P, et al. Clinicians are poor raters of life-expectancy before radical prostatectomy or definitive radiotherapy for localized prostate cancer. BJU Int. 2007;100:1254–8. doi: 10.1111/j.1464-410X.2007.07130.x. Clinicians are relatively poor at predicting life-expectancy in patients with prostate cancer. Individual predictions can vary substantially and seem to be independent of professional experience. [DOI] [PubMed] [Google Scholar]
- 11.Kattan MW, Wheeler TM, Scardino PT. Postoperative nomogram for disease recurrence after radical prostatectomy for prostate cancer. J Clin Oncol. 1999;17:1499–507. doi: 10.1200/JCO.1999.17.5.1499. [DOI] [PubMed] [Google Scholar]
- 12**.Kattan MW, Eastham JA, Stapleton AM, Wheeler TM, Scardino PT. A preoperative nomogram for disease recurrence following radical prostatectomy for prostate cancer. J Natl Cancer Inst. 1998;90:766–71. doi: 10.1093/jnci/90.10.766. This is the first Kattan-type nomogram; it is based on serum PSA, clinical stage, and biopsy Gleason grade and calculates the 5-year freedom from PSA-defined progression after radical prostatectomy. The nomogram has been independently validated in diverse patient populations. Currently, it is the most widely used disease-specific prediction tool in oncology. [DOI] [PubMed] [Google Scholar]
- 13.D’Amico AV, Whittington R, Malkowicz SB, et al. The combination of preoperative prostate specific antigen and postoperative pathological findings to predict prostate specific antigen outcome in clinically localized prostate cancer. J Urol. 1998;160:2096–101. doi: 10.1097/00005392-199812010-00041. [DOI] [PubMed] [Google Scholar]
- 14.D’Amico AV, Keshaviah A, Manola J, et al. Clinical utility of the percentage of positive prostate biopsies in predicting prostate cancer-specific and overall survival after radiotherapy for patients with localized prostate cancer. Int J Radiat Oncol Biol Phys. 2002;53:581–7. doi: 10.1016/s0360-3016(02)02797-9. [DOI] [PubMed] [Google Scholar]
- 15.D’Amico AV, Whittington R, Malkowicz SB, et al. Pretreatment nomogram for prostate-specific antigen recurrence after radical prostatectomy or external-beam radiation therapy for clinically localized prostate cancer. J Clin Oncol. 1999;17:168–72. doi: 10.1200/JCO.1999.17.1.168. [DOI] [PubMed] [Google Scholar]
- 16.D’Amico AV, Whittington R, Malkowicz SB, et al. Combination of the preoperative PSA level, biopsy gleason score, percentage of positive biopsies, and MRI T-stage to predict early PSA failure in men with clinically localized prostate cancer. Urology. 2000;55:572–7. doi: 10.1016/s0090-4295(99)00479-3. [DOI] [PubMed] [Google Scholar]
- 17.Snow PB, Smith DS, Catalona WJ. Artificial neural networks in the diagnosis and prognosis of prostate cancer: a pilot study. J Urol. 1994;152:1923–6. doi: 10.1016/s0022-5347(17)32416-3. [DOI] [PubMed] [Google Scholar]
- 18.Partin AW, Kattan MW, Subong EN, et al. Combination of prostate-specific antigen, clinical stage, and Gleason score to predict pathological stage of localized prostate cancer. A multi-institutional update [see comments] [published erratum appears in JAMA 1997 Jul 9;278(2):118] Jama. 1997;277:1445–51. [PubMed] [Google Scholar]
- 19.Makarov DV, Trock BJ, Humphreys EB, et al. Updated nomogram to predict pathologic stage of prostate cancer given prostate-specific antigen level, clinical stage, and biopsy Gleason score (Partin tables) based on cases from 2000 to 2005. Urology. 2007;69:1095–101. doi: 10.1016/j.urology.2007.03.042. [DOI] [PMC free article] [PubMed] [Google Scholar]
- 20.Conrad S, Graefen M, Pichlmeier U, et al. Prospective validation of an algorithm with systematic sextant biopsy to predict pelvic lymph node metastasis in patients with clinically localized prostatic carcinoma. J Urol. 2002;167:521–5. doi: 10.1016/S0022-5347(01)69077-3. [DOI] [PubMed] [Google Scholar]
- 21.Graefen M, Haese A, Pichlmeier U, et al. A validated strategy for side specific prediction of organ confined prostate cancer: a tool to select for nerve sparing radical prostatectomy. J Urol. 2001;165:857–63. [PubMed] [Google Scholar]
- 22.Begg CB, Cramer LD, Venkatraman ES, Rosai J. Comparing tumour staging and grading systems: a case study and a review of the issues, using thymoma as a model. Stat Med. 2000;19:1997–2014. doi: 10.1002/1097-0258(20000815)19:15<1997::aid-sim511>3.0.co;2-c. [DOI] [PubMed] [Google Scholar]
- 23.Kattan MW. Nomograms. Introduction. Semin Urol Oncol. 2002;20:79–81. [PubMed] [Google Scholar]
- 24.Efron B, Tibshirani RJ. Monographs on Statistics and Applied Probability. Boca Raton, Florida: Champman and Hall/CRC; 1993. An introduction to the bootstrap; pp. 275–281. [Google Scholar]
- 25**.Kattan MW. Comparison of Cox regression with other methods for determining prediction models and nomograms. J Urol. 2003;170:S6–9. doi: 10.1097/01.ju.0000094764.56269.2d. discussion S10. Using three real world datasets, Kattan found that Cox proportional hazards regression model provided superior predictive accuracy than four tree-based methods. [DOI] [PubMed] [Google Scholar]
- 26.Steyerberg EW, Bleeker SE, Moll HA, Grobbee DE, Moons KG. Internal and external validation of predictive models: a simulation study of bias and precision in small samples. J Clin Epidemiol. 2003;56:441–7. doi: 10.1016/s0895-4356(03)00047-7. [DOI] [PubMed] [Google Scholar]
- 27.Steyerberg EW, Harrell FE, Jr, Borsboom GJ, Eijkemans MJ, Vergouwe Y, Habbema JD. Internal validation of predictive models: efficiency of some procedures for logistic regression analysis. J Clin Epidemiol. 2001;54:774–81. doi: 10.1016/s0895-4356(01)00341-9. [DOI] [PubMed] [Google Scholar]
- 28.Steyerberg EW, Harrell FE, Jr, Goodman PH. Neural networks, logistic regression, and calibration. Med Decis Making. 1998;18:349–50. doi: 10.1177/0272989X9801800314. [DOI] [PubMed] [Google Scholar]
- 29.Steyerberg EW, Roobol MJ, Kattan MW, van der Kwast TH, de Koning HJ, Schroder FH. Prediction of indolent prostate cancer: validation and updating of a prognostic nomogram. J Urol. 2007;177:107–12. doi: 10.1016/j.juro.2006.08.068. discussion 112. [DOI] [PubMed] [Google Scholar]
- 30.Greene KL, Meng MV, Elkin EP, et al. Validation of the Kattan preoperative nomogram for prostate cancer recurrence using a community based cohort: results from cancer of the prostate strategic urological research endeavor (capsure) J Urol. 2004;171:2255–9. doi: 10.1097/01.ju.0000127733.01845.57. [DOI] [PubMed] [Google Scholar]
- 31.Lotan Y, Gupta A, Shariat SF, et al. Lymphovascular invasion is independently associated with overall survival, cause-specific survival, and local and distant recurrence in patients with negative lymph nodes at radical cystectomy. J Clin Oncol. 2005;23:6533–9. doi: 10.1200/JCO.2005.05.516. [DOI] [PubMed] [Google Scholar]
- 32.Shariat SF, Karakiewicz PI, Palapattu GS, et al. Outcomes of radical cystectomy for transitional cell carcinoma of the bladder: a contemporary series from the bladder cancer research consortium. J Urol. 2006;176:2414–22. doi: 10.1016/j.juro.2006.08.004. [DOI] [PubMed] [Google Scholar]
- 33.Shariat SF, Palapattu GS, Karakiewicz PI, et al. Concomitant Carcinoma In Situ Is a Feature of Aggressive Disease in Patients With Organ-Confined TCC at Radical Cystectomy. Eur Urol. 2007;51:152–60. doi: 10.1016/j.eururo.2006.08.037. [DOI] [PubMed] [Google Scholar]
- 34.Shariat SF, Palapattu GS, Karakiewicz PI, et al. Discrepancy between Clinical and Pathologic Stage: Impact on Prognosis after Radical Cystectomy. Eur Urol. 2007;51:137–51. doi: 10.1016/j.eururo.2006.05.021. [DOI] [PubMed] [Google Scholar]
- 35.Nielsen ME, Shariat SF, Karakiewicz PI, et al. Advanced age is associated with poorer bladder cancer-specific survival in patients treated with radical cystectomy. Eur Urol. 2007;51:699–706. doi: 10.1016/j.eururo.2006.11.004. discussion 706–8. [DOI] [PubMed] [Google Scholar]
- 36.Stephenson AJ, Scardino PT, Eastham JA, et al. Postoperative nomogram predicting the 10-year probability of prostate cancer recurrence after radical prostatectomy. J Clin Oncol. 2005;23:7005–12. doi: 10.1200/JCO.2005.01.867. [DOI] [PMC free article] [PubMed] [Google Scholar]
- 37.Stephenson AJ, Scardino PT, Eastham JA, et al. Preoperative nomogram predicting the 10-year probability of prostate cancer recurrence after radical prostatectomy. J Natl Cancer Inst. 2006;98:715–7. doi: 10.1093/jnci/djj190. [DOI] [PMC free article] [PubMed] [Google Scholar]
- 38.Aleman M, Karakiewicz PI, Kupelian P, et al. Age and PSA predict likelihood of organ-confined disease in men presenting with PSA less than 10 ng/mL: implications for screening. Urology. 2003;62:70–4. doi: 10.1016/s0090-4295(03)00125-0. [DOI] [PubMed] [Google Scholar]
- 39.Shariat SF, Capitanio U, Jeldres C, Karakiewicz PI. Can nomograms be superior to other prediction tools? BJU Int. 2009;103:492–5. doi: 10.1111/j.1464-410X.2008.08073.x. discussion 495–7. [DOI] [PubMed] [Google Scholar]
- 40.Shariat SF, Karakiewicz PI, Palapattu GS, et al. Nomograms provide improved accuracy for predicting survival after radical cystectomy. Clin Cancer Res. 2006;12:6663–76. doi: 10.1158/1078-0432.CCR-06-0372. [DOI] [PubMed] [Google Scholar]
- 41.Kattan MW. Nomograms are superior to staging and risk grouping systems for identifying high-risk patients: preoperative application in prostate cancer. Curr Opin Urol. 2003;13:111–6. doi: 10.1097/00042307-200303000-00005. [DOI] [PubMed] [Google Scholar]
- 42.Diblasio CJ, Kattan MW. Use of nomograms to predict the risk of disease recurrence after definitive local therapy for prostate cancer. Urology. 2003;62(Suppl 1):9–18. doi: 10.1016/j.urology.2003.09.029. [DOI] [PubMed] [Google Scholar]
- 43**.Shariat SF, Karam JA, Walz J, et al. Improved prediction of disease relapse after radical prostatectomy through a panel of preoperative blood-based biomarkers. Clin Cancer Res. 2008;14:3785–91. doi: 10.1158/1078-0432.CCR-07-4969. This study represents an example of how biomarkers can be integrated into predictive tools. Preoperative levels of a panel of seven biomarkers predicted with 86% accuracy which prostate cancer patients will experience disease progression. A combination of independent yet complementary markers provided a more accurate prediction outcome compared to single markers. Tools integrating biomarkers not only improve the accuracy of individualized care but also may help identify patients for clinical trials of targeted therapy. [DOI] [PubMed] [Google Scholar]
- 44.Shariat SF, Trinh QD, Morey AF, et al. Development of a highly accurate nomogram for prediction of the need for exploration in patients with renal trauma. J Trauma. 2008;64:1451–8. doi: 10.1097/TA.0b013e3181271b77. [DOI] [PubMed] [Google Scholar]
- 45.Vickers AJ, Elkin EB. Decision curve analysis: a novel method for evaluating prediction models. Med Decis Making. 2006;26:565–74. doi: 10.1177/0272989X06295361. [DOI] [PMC free article] [PubMed] [Google Scholar]
- 46.Vickers AJ, Cronin AM, Elkin EB, Gonen M. Extensions to decision curve analysis, a novel method for evaluating diagnostic tests, prediction models and molecular markers. BMC Med Inform Decis Mak. 2008;8:53. doi: 10.1186/1472-6947-8-53. [DOI] [PMC free article] [PubMed] [Google Scholar]
- 47.Vickers AJ. Decision analysis for the evaluation of diagnostic tests, prediction models and molecular markers. Am Stat. 2008;62:314–320. doi: 10.1198/000313008X370302. [DOI] [PMC free article] [PubMed] [Google Scholar]
- 48.Elkin EB, Vickers AJ, Kattan MW. Primer: using decision analysis to improve clinical decision making in urology. Nat Clin Pract Urol. 2006;3:439–48. doi: 10.1038/ncpuro0556. [DOI] [PubMed] [Google Scholar]
- 49.Harrell FE, Jr, Lee KL, Mark DB. Multivariable prognostic models: issues in developing models, evaluating assumptions and adequacy, and measuring and reducing errors. Stat Med. 1996;15:361–87. doi: 10.1002/(SICI)1097-0258(19960229)15:4<361::AID-SIM168>3.0.CO;2-4. [DOI] [PubMed] [Google Scholar]
- 50.Khoddami SM, Shariat SF, Lotan Y, et al. Predictive value of primary Gleason pattern 4 in patients with Gleason score 7 tumours treated with radical prostatectomy. BJU Int. 2004;94:42–6. doi: 10.1111/j.1464-410X.2004.04898.x. [DOI] [PubMed] [Google Scholar]
- 51.Eastham JA, May R, Robertson JL, Sartor O, Kattan MW. Development of a nomogram that predicts the probability of a positive prostate biopsy in men with an abnormal digital rectal examination and a prostate-specific antigen between 0 and 4 ng/mL. Urology. 1999;54:709–13. doi: 10.1016/s0090-4295(99)00213-7. [DOI] [PubMed] [Google Scholar]
- 52.Chun FK, Briganti A, Graefen M, et al. Development and external validation of an extended 10-core biopsy nomogram. Eur Urol. 2007;52:436–45. doi: 10.1016/j.eururo.2006.08.039. [DOI] [PubMed] [Google Scholar]
- 53*.Nam RK, Toi A, Klotz LH, et al. Assessing individual risk for prostate cancer. J Clin Oncol. 2007;25:3582–8. doi: 10.1200/JCO.2007.10.6450. First study that combines all established risk factors and tumor markers for prostate cancer into a comprehensive clinical instrument that determines an individual’s risk for prostate cancer. [DOI] [PubMed] [Google Scholar]
- 54.Parekh DJ, Ankerst DP, Higgins BA, et al. External validation of the Prostate Cancer Prevention Trial risk calculator in a screened population. Urology. 2006;68:1152–5. doi: 10.1016/j.urology.2006.10.022. [DOI] [PubMed] [Google Scholar]
- 55.Thompson IM, Ankerst DP, Chi C, et al. Assessing prostate cancer risk: results from the Prostate Cancer Prevention Trial. J Natl Cancer Inst. 2006;98:529–34. doi: 10.1093/jnci/djj131. [DOI] [PubMed] [Google Scholar]
- 56.Lopez-Corona E, Ohori M, Scardino PT, Reuter VE, Gonen M, Kattan MW. A nomogram for predicting a positive repeat prostate biopsy in patients with a previous negative biopsy session. J Urol. 2003;170:1184–8. doi: 10.1097/01.ju.0000087451.64657.fa. discussion 1188. [DOI] [PubMed] [Google Scholar]
- 57.Yanke BV, Gonen M, Scardino PT, Kattan MW. Validation of a nomogram for predicting positive repeat biopsy for prostate cancer. J Urol. 2005;173:421–4. doi: 10.1097/01.ju.0000150522.82760.00. [DOI] [PubMed] [Google Scholar]
- 58.Chun FK, Briganti A, Graefen M, et al. Development and external validation of an extended repeat biopsy nomogram. J Urol. 2007;177:510–5. doi: 10.1016/j.juro.2006.09.025. [DOI] [PubMed] [Google Scholar]
- 59.Penson DF, Grossfeld GD, Li YP, Henning JM, Lubeck DP, Carroll PR. How well does the Partin nomogram predict pathological stage after radical prostatectomy in a community based population? Results of the cancer of the prostate strategic urological research endeavor. J Urol. 2002;167:1653–7. discussion 1657–8. [PubMed] [Google Scholar]
- 60.Augustin H, Eggert T, Wenske S, et al. Comparison of accuracy between the Partin tables of 1997 and 2001 to predict final pathological stage in clinically localized prostate cancer. J Urol. 2004;171:177–81. doi: 10.1097/01.ju.0000099827.77355.a7. [DOI] [PubMed] [Google Scholar]
- 61.Partin AW, Mangold LA, Lamm DM, Walsh PC, Epstein JI, Pearson JD. Contemporary update of prostate cancer staging nomograms (Partin Tables) for the new millennium. Urology. 2001;58:843–8. doi: 10.1016/s0090-4295(01)01441-8. [DOI] [PubMed] [Google Scholar]
- 62.Ohori M, Kattan MW, Koh H, et al. Predicting the presence and side of extracapsular extension: a nomogram for staging prostate cancer. J Urol. 2004;171:1844–9. doi: 10.1097/01.ju.0000121693.05077.3d. discussion 1849. [DOI] [PubMed] [Google Scholar]
- 63.Steuber T, Graefen M, Haese A, et al. Validation of a nomogram for prediction of side specific extracapsular extension at radical prostatectomy. J Urol. 2006;175:939–44. doi: 10.1016/S0022-5347(05)00342-3. discussion 944. [DOI] [PubMed] [Google Scholar]
- 64.Koh H, Kattan MW, Scardino PT, et al. A nomogram to predict seminal vesicle invasion by the extent and location of cancer in systematic biopsy results. J Urol. 2003;170:1203–8. doi: 10.1097/01.ju.0000085074.62960.7b. [DOI] [PubMed] [Google Scholar]
- 65.Gallina A, Chun FK, Briganti A, et al. Development and split-sample validation of a nomogram predicting the probability of seminal vesicle invasion at radical prostatectomy. Eur Urol. 2007;52:98–105. doi: 10.1016/j.eururo.2007.01.060. [DOI] [PubMed] [Google Scholar]
- 66.Cagiannos I, Karakiewicz P, Eastham JA, et al. A preoperative nomogram identifying decreased risk of positive pelvic lymph nodes in patients with prostate cancer. J Urol. 2003;170:1798–803. doi: 10.1097/01.ju.0000091805.98960.13. [DOI] [PubMed] [Google Scholar]
- 67.Briganti A, Chun FK, Salonia A, et al. Validation of a nomogram predicting the probability of lymph node invasion among patients undergoing radical prostatectomy and an extended pelvic lymphadenectomy. Eur Urol. 2006;49:1019–26. doi: 10.1016/j.eururo.2006.01.043. discussion 1026–7. [DOI] [PubMed] [Google Scholar]
- 68.Briganti A, Chun FK, Salonia A, et al. A nomogram for staging of exclusive nonobturator lymph node metastases in men with localized prostate cancer. Eur Urol. 2007;51:112–9. doi: 10.1016/j.eururo.2006.05.045. discussion 119–20. [DOI] [PubMed] [Google Scholar]
- 69.Johansson JE, Andren O, Andersson SO, et al. Natural history of early, localized prostate cancer. Jama. 2004;291:2713–9. doi: 10.1001/jama.291.22.2713. [DOI] [PubMed] [Google Scholar]
- 70.Kattan MW, Eastham JA, Wheeler TM, et al. Counseling men with prostate cancer: a nomogram for predicting the presence of small, moderately differentiated, confined tumors. J Urol. 2003;170:1792–7. doi: 10.1097/01.ju.0000091806.70171.41. [DOI] [PubMed] [Google Scholar]
- 71.Epstein JI, Carmichael MJ, Partin AW, Walsh PC. Small high grade adenocarcinoma of the prostate in radical prostatectomy specimens performed for nonpalpable disease: pathogenetic and clinical implications. Journal of Urology. 1994;151:1587–1592. doi: 10.1016/s0022-5347(17)35309-0. [DOI] [PubMed] [Google Scholar]
- 72.Graefen M, Karakiewicz PI, Cagiannos I, et al. A validation of two preoperative nomograms predicting recurrence following radical prostatectomy in a cohort of European men. Urol Oncol. 2002;7:141–6. doi: 10.1016/s1078-1439(02)00177-1. [DOI] [PubMed] [Google Scholar]
- 73.Graefen M, Karakiewicz PI, Cagiannos I, et al. International validation of a preoperative nomogram for prostate cancer recurrence after radical prostatectomy. J Clin Oncol. 2002;20:3206–12. doi: 10.1200/JCO.2002.12.019. [DOI] [PubMed] [Google Scholar]
- 74.Bianco FJ, Jr, Kattan MW, Scardino PT, Powell IJ, Pontes JE, Wood DP., Jr Radical prostatectomy nomograms in black American men: accuracy and applicability. J Urol. 2003;170:73–6. doi: 10.1097/01.ju.0000068037.57553.54. discussion 76–7. [DOI] [PubMed] [Google Scholar]
- 75.Pound CR, Partin AW, Eisenberger MA, Chan DW, Pearson JD, Walsh PC. Natural history of progression after PSA elevation following radical prostatectomy [see comments] Jama. 1999;281:1591–7. doi: 10.1001/jama.281.17.1591. [DOI] [PubMed] [Google Scholar]
- 76.Freedland SJ, Humphreys EB, Mangold LA, et al. Risk of prostate cancer-specific mortality following biochemical recurrence after radical prostatectomy. Jama. 2005;294:433–9. doi: 10.1001/jama.294.4.433. [DOI] [PubMed] [Google Scholar]
- 77.Hull GW, Rabbani F, Abbas F, Wheeler TM, Kattan MW, Scardino PT. Cancer control with radical prostatectomy alone in 1,000 consecutive patients. J Urol. 2002;167:528–34. doi: 10.1016/S0022-5347(01)69079-7. [DOI] [PubMed] [Google Scholar]
- 78.Graefen M, Karakiewicz PI, Cagiannos I, et al. Validation study of the accuracy of a postoperative nomogram for recurrence after radical prostatectomy for localized prostate cancer. J Clin Oncol. 2002;20:951–6. doi: 10.1200/JCO.2002.20.4.951. [DOI] [PubMed] [Google Scholar]
- 79.Suardi N, Porter CR, Reuther AM, et al. A nomogram predicting long-term biochemical recurrence after radical prostatectomy. Cancer. 2008;112:1254–63. doi: 10.1002/cncr.23293. [DOI] [PubMed] [Google Scholar]
- 80.Consensus statement: guidelines for PSA following radiation therapy. American Society for Therapeutic Radiology and Oncology Consensus Panel. Int J Radiat Oncol Biol Phys. 1997;37:1035–41. [PubMed] [Google Scholar]
- 81.Kattan MW, Zelefsky MJ, Kupelian PA, Scardino PT, Fuks Z, Leibel SA. Pretreatment nomogram for predicting the outcome of three-dimensional conformal radiotherapy in prostate cancer. J Clin Oncol. 2000;18:3352–9. doi: 10.1200/JCO.2000.18.19.3352. [DOI] [PubMed] [Google Scholar]
- 82.D’Amico AV, Whittington R, Malkowicz SB, et al. Biochemical outcome after radical prostatectomy or external beam radiation therapy for patients with clinically localized prostate carcinoma in the prostate specific antigen era. Cancer. 2002;95:281–6. doi: 10.1002/cncr.10657. [DOI] [PubMed] [Google Scholar]
- 83.D’Amico AV, Whittington R, Malkowicz SB, et al. Biochemical outcome after radical prostatectomy, external beam radiation therapy, or interstitial radiation therapy for clinically localized prostate cancer. Jama. 1998;280:969–74. doi: 10.1001/jama.280.11.969. [DOI] [PubMed] [Google Scholar]
- 84.Kattan MW, Potters L, Blasko JC, et al. Pretreatment nomogram for predicting freedom from recurrence after permanent prostate brachytherapy in prostate cancer. Urology. 2001;58:393–9. doi: 10.1016/s0090-4295(01)01233-x. [DOI] [PubMed] [Google Scholar]
- 85.Kattan MW, Zelefsky MJ, Kupelian PA, et al. Pretreatment nomogram that predicts 5-year probability of metastasis following three-dimensional conformal radiation therapy for localized prostate cancer. J Clin Oncol. 2003;21:4568–71. doi: 10.1200/JCO.2003.05.046. [DOI] [PubMed] [Google Scholar]
- 86.Dotan ZA, Bianco FJ, Jr, Rabbani F, et al. Pattern of prostate-specific antigen (PSA) failure dictates the probability of a positive bone scan in patients with an increasing PSA after radical prostatectomy. J Clin Oncol. 2005;23:1962–8. doi: 10.1200/JCO.2005.06.058. [DOI] [PMC free article] [PubMed] [Google Scholar]
- 87.Slovin SF, Wilton AS, Heller G, Scher HI. Time to detectable metastatic disease in patients with rising prostate-specific antigen values following surgery or radiation therapy. Clin Cancer Res. 2005;11:8669–73. doi: 10.1158/1078-0432.CCR-05-1668. [DOI] [PubMed] [Google Scholar]
- 88.Armstrong AJ, Garrett-Mayer ES, Yang YC, de Wit R, Tannock IF, Eisenberger M. A contemporary prognostic nomogram for men with hormone-refractory metastatic prostate cancer: a TAX327 study analysis. Clin Cancer Res. 2007;13:6396–403. doi: 10.1158/1078-0432.CCR-07-1036. [DOI] [PubMed] [Google Scholar]
- 89.Porter CR, Gallina A, Kodama K, et al. Prostate cancer-specific survival in men treated with hormonal therapy after failure of radical prostatectomy. Eur Urol. 2007;52:446–54. doi: 10.1016/j.eururo.2006.11.027. [DOI] [PubMed] [Google Scholar]
- 90.Smaletz O, Scher HI, Small EJ, et al. Nomogram for overall survival of patients with progressive metastatic prostate cancer after castration. J Clin Oncol. 2002;20:3972–82. doi: 10.1200/JCO.2002.11.021. [DOI] [PubMed] [Google Scholar]
- 91.Halabi S, Small EJ, Kantoff PW, et al. Prognostic model for predicting survival in men with hormone-refractory metastatic prostate cancer. J Clin Oncol. 2003;21:1232–7. doi: 10.1200/JCO.2003.06.100. [DOI] [PubMed] [Google Scholar]
- 92.Walz J, Gallina A, Hutterer G, et al. Accuracy of life tables in predicting overall survival in candidates for radiotherapy for prostate cancer. Int J Radiat Oncol Biol Phys. 2007;69:88–94. doi: 10.1016/j.ijrobp.2007.02.022. [DOI] [PubMed] [Google Scholar]
- 93.Tewari A, Johnson CC, Divine G, et al. Long-term survival probability in men with clinically localized prostate cancer: a case-control, propensity modeling study stratified by race, age, treatment and comorbidities. J Urol. 2004;171:1513–9. doi: 10.1097/01.ju.0000117975.40782.95. [DOI] [PubMed] [Google Scholar]
- 94.Cowen ME, Halasyamani LK, Kattan MW. Predicting life expectancy in men with clinically localized prostate cancer. J Urol. 2006;175:99–103. doi: 10.1016/S0022-5347(05)00018-2. [DOI] [PubMed] [Google Scholar]
- 95.Albertsen PC, Fryback DG, Storer BE, Kolon TF, Fine J. The impact of co-morbidity on life expectancy among men with localized prostate cancer. J Urol. 1996;156:127–32. [PubMed] [Google Scholar]
- 96.Albertsen PC, Hanley JA, Gleason DF, Barry MJ. Competing risk analysis of men aged 55 to 74 years at diagnosis managed conservatively for clinically localized prostate cancer. Jama. 1998;280:975–80. doi: 10.1001/jama.280.11.975. [DOI] [PubMed] [Google Scholar]
- 97.Walz J, Gallina A, Saad F, et al. A nomogram predicting 10-year life expectancy in candidates for radical prostatectomy or radiotherapy for prostate cancer. J Clin Oncol. 2007;25:3576–81. doi: 10.1200/JCO.2006.10.3820. [DOI] [PubMed] [Google Scholar]
- 98.Chun FK, Briganti A, Jeldres C, et al. Tumour volume and high grade tumour volume are the best predictors of pathologic stage and biochemical recurrence after radical prostatectomy. Eur J Cancer. 2007;43:536–43. doi: 10.1016/j.ejca.2006.10.018. [DOI] [PubMed] [Google Scholar]
- 99.Gallina A, Karakiewicz PI, Hutterer GC, et al. Obesity does not predispose to more aggressive prostate cancer either at biopsy or radical prostatectomy in European men. Int J Cancer. 2007;121:791–5. doi: 10.1002/ijc.22730. [DOI] [PubMed] [Google Scholar]
- 100.Kattan MW, Shariat SF, Andrews B, et al. The addition of interleukin-6 soluble receptor and transforming growth factor beta1 improves a preoperative nomogram for predicting biochemical progression in patients with clinically localized prostate cancer. J Clin Oncol. 2003;21:3573–9. doi: 10.1200/JCO.2003.12.037. [DOI] [PubMed] [Google Scholar]
- 101.Stephenson AJ, Smith A, Kattan MW, et al. Integration of gene expression profiling and clinical variables to predict prostate carcinoma recurrence after radical prostatectomy. Cancer. 2005;104:290–8. doi: 10.1002/cncr.21157. [DOI] [PMC free article] [PubMed] [Google Scholar]
- 102.Shariat SF, Park S, Trinh QD, Roehrborn CG, Slawin KM, Karakiewicz PI. Plasminogen activation inhibitor-1 improves the predictive accuracy of prostate cancer nomograms. J Urol. 2007;178:1229–36. doi: 10.1016/j.juro.2007.05.161. discussion 1236–7. [DOI] [PubMed] [Google Scholar]
- 103.Svatek RS, Jeldres C, Karakiewicz PI, et al. Pre-treatment biomarker levels improve the accuracy of post-prostatectomy nomogram for prediction of biochemical recurrence. Prostate. 2009;69:886–94. doi: 10.1002/pros.20938. [DOI] [PubMed] [Google Scholar]
- 104.Shariat SF, Walz J, Roehrborn CG, et al. External validation of a biomarker-based preoperative nomogram predicts biochemical recurrence after radical prostatectomy. J Clin Oncol. 2008;26:1526–31. doi: 10.1200/JCO.2007.12.4669. [DOI] [PubMed] [Google Scholar]
- 105.Svatek RS, Karam JA, Roehrborn CG, Karakiewicz PI, Slawin KM, Shariat SF. Preoperative plasma endoglin levels predict biochemical progression after radical prostatectomy. Clin Cancer Res. 2008;14:3362–6. doi: 10.1158/1078-0432.CCR-07-4707. [DOI] [PubMed] [Google Scholar]
- 106.Wang L, Hricak H, Kattan MW, et al. Prediction of seminal vesicle invasion in prostate cancer: incremental value of adding endorectal MR imaging to the Kattan nomogram. Radiology. 2007;242:182–8. doi: 10.1148/radiol.2421051254. [DOI] [PubMed] [Google Scholar]
- 107.Shukla-Dave A, Hricak H, Kattan MW, et al. The utility of magnetic resonance imaging and spectroscopy for predicting insignificant prostate cancer: an initial analysis. BJU Int. 2007;99:786–93. doi: 10.1111/j.1464-410X.2007.06689.x. [DOI] [PubMed] [Google Scholar]
- 108.Poulakis V, Witzsch U, de Vries R, et al. Preoperative neural network using combined magnetic resonance imaging variables, prostate-specific antigen, and gleason score for predicting prostate cancer biochemical recurrence after radical prostatectomy. Urology. 2004;64:1165–70. doi: 10.1016/j.urology.2004.06.030. [DOI] [PubMed] [Google Scholar]
- 109.Shariat SF, Karakiewicz PI, Suardi N, Kattan MW. Comparison of nomograms with other methods for predicting outcomes in prostate cancer: a critical analysis of the literature. Clin Cancer Res. 2008;14:4400–7. doi: 10.1158/1078-0432.CCR-07-4713. [DOI] [PubMed] [Google Scholar]
- 110.Chun FK, Karakiewicz PI, Briganti A, et al. A critical appraisal of logistic regression-based nomograms, artificial neural networks, classification and regression-tree models, look-up tables and risk-group stratification models for prostate cancer. BJU Int. 2007;99:794–800. doi: 10.1111/j.1464-410X.2006.06694.x. [DOI] [PubMed] [Google Scholar]
- 111.Shariat SF, Karakiewicz PI, Roehrborn CG, Kattan MW. An updated catalog of prostate cancer predictive tools. Cancer. 2008;113:3075–99. doi: 10.1002/cncr.23908. [DOI] [PubMed] [Google Scholar]
- 112.O’Connor AM. Do shared decision making programs work? A systematic overview. Med Decis Making. 1999;11:523. [Google Scholar]
- 113.Babaian RJ, Fritsche HA, Zhang Z, Zhang KH, Madyastha KR, Barnhill SD. Evaluation of prostAsure index in the detection of prostate cancer: a preliminary report. Urology. 1998;51:132–6. doi: 10.1016/s0090-4295(97)00574-8. [DOI] [PubMed] [Google Scholar]
- 114.Virtanen A, Gomari M, Kranse R, Stenman UH. Estimation of prostate cancer probability by logistic regression: free and total prostate-specific antigen, digital rectal examination, and heredity are significant variables. Clin Chem. 1999;45:987–94. [PubMed] [Google Scholar]
- 115.Finne P, Finne R, Auvinen A, et al. Predicting the outcome of prostate biopsy in screen-positive men by a multilayer perceptron network. Urology. 2000;56:418–22. doi: 10.1016/s0090-4295(00)00672-5. [DOI] [PubMed] [Google Scholar]
- 116.Horninger W, Bartsch G, Snow PB, Brandt JM, Partin AW. The problem of cutoff levels in a screened population: appropriateness of informing screenees about their risk of having prostate carcinoma. Cancer. 2001;91:1667–72. doi: 10.1002/1097-0142(20010415)91:8+<1667::aid-cncr1181>3.0.co;2-l. [DOI] [PubMed] [Google Scholar]
- 117.Kalra P, Togami J, Bansal BSG, et al. A neurocomputational model for prostate carcinoma detection. Cancer. 2003;98:1849–54. doi: 10.1002/cncr.11748. [DOI] [PubMed] [Google Scholar]
- 118.Garzotto M, Hudson RG, Peters L, et al. Predictive modeling for the presence of prostate carcinoma using clinical, laboratory, and ultrasound parameters in patients with prostate specific antigen levels < or = 10 ng/mL. Cancer. 2003;98:1417–22. doi: 10.1002/cncr.11668. [DOI] [PubMed] [Google Scholar]
- 119.Finne P, Finne R, Bangma C, et al. Algorithms based on prostate-specific antigen (PSA), free PSA, digital rectal examination and prostate volume reduce false-positive PSA results in prostate cancer screening. Int J Cancer. 2004;111:310–5. doi: 10.1002/ijc.20250. [DOI] [PubMed] [Google Scholar]
- 120.Karakiewicz PI, Benayoun S, Kattan MW, et al. Development and validation of a nomogram predicting the outcome of prostate biopsy based on patient age, digital rectal examination and serum prostate specific antigen. J Urol. 2005;173:1930–4. doi: 10.1097/01.ju.0000158039.94467.5d. [DOI] [PMC free article] [PubMed] [Google Scholar]
- 121.Porter CR, Gamito EJ, Crawford ED, et al. Model to predict prostate biopsy outcome in large screening population with independent validation in referral setting. Urology. 2005;65:937–41. doi: 10.1016/j.urology.2004.11.049. [DOI] [PubMed] [Google Scholar]
- 122.Suzuki H, Komiya A, Kamiya N, et al. Development of a nomogram to predict probability of positive initial prostate biopsy among Japanese patients. Urology. 2006;67:131–6. doi: 10.1016/j.urology.2005.07.040. [DOI] [PubMed] [Google Scholar]
- 123.O’Dowd GJ, Miller MC, Orozco R, Veltri RW. Analysis of repeated biopsy results within 1 year after a noncancer diagnosis. Urology. 2000;55:553–9. doi: 10.1016/s0090-4295(00)00447-7. [DOI] [PubMed] [Google Scholar]
- 124.Remzi M, Anagnostou T, Ravery V, et al. An artificial neural network to predict the outcome of repeat prostate biopsies. Urology. 2003;62:456–60. doi: 10.1016/s0090-4295(03)00409-6. [DOI] [PubMed] [Google Scholar]
- 125.Walz J, Graefen M, Chun FK, et al. High incidence of prostate cancer detected by saturation biopsy after previous negative biopsy series. Eur Urol. 2006;50:498–505. doi: 10.1016/j.eururo.2006.03.026. [DOI] [PubMed] [Google Scholar]
- 126.Carlson GD, Calvanese CB, Partin AW. An algorithm combining age, total prostate-specific antigen (PSA), and percent free PSA to predict prostate cancer: results on 4298 cases. Urology. 1998;52:455–61. doi: 10.1016/s0090-4295(98)00205-2. [DOI] [PubMed] [Google Scholar]
- 127.Djavan B, Remzi M, Zlotta A, Seitz C, Snow P, Marberger M. Novel artificial neural network for early detection of prostate cancer. J Clin Oncol. 2002;20:921–9. doi: 10.1200/JCO.2002.20.4.921. [DOI] [PubMed] [Google Scholar]
- 128.Stephan C, Cammann H, Semjonow A, et al. Multicenter evaluation of an artificial neural network to increase the prostate cancer detection rate and reduce unnecessary biopsies. Clin Chem. 2002;48:1279–87. [PubMed] [Google Scholar]
- 129.Porter CR, O’Donnell C, Crawford ED, et al. Predicting the outcome of prostate biopsy in a racially diverse population: a prospective study. Urology. 2002;60:831–5. doi: 10.1016/s0090-4295(02)01882-4. [DOI] [PubMed] [Google Scholar]
- 130.Matsui Y, Utsunomiya N, Ichioka K, et al. The use of artificial neural network analysis to improve the predictive accuracy of prostate biopsy in the Japanese population. Jpn J Clin Oncol. 2004;34:602–7. doi: 10.1093/jjco/hyh112. [DOI] [PubMed] [Google Scholar]
- 131.Benecchi L. Neuro-fuzzy system for prostate cancer diagnosis. Urology. 2006;68:357–61. doi: 10.1016/j.urology.2006.03.003. [DOI] [PubMed] [Google Scholar]
- 132.Yanke BV, Carver BS, Bianco FJ, Jr, et al. African-American race is a predictor of prostate cancer detection: incorporation into a pre-biopsy nomogram. BJU Int. 2006;98:783–7. doi: 10.1111/j.1464-410X.2006.06388.x. [DOI] [PubMed] [Google Scholar]
- 133.Narayan P, Gajendran V, Taylor SP, et al. The role of transrectal ultrasound-guided biopsy-based staging, preoperative serum prostate-specific antigen, and biopsy Gleason score in prediction of final pathologic diagnosis in prostate cancer. Urology. 1995;46:205–12. doi: 10.1016/s0090-4295(99)80195-2. [DOI] [PubMed] [Google Scholar]
- 134.Partin AW, Yoo J, Carter HB, et al. The use of prostate specific antigen, clinical stage and Gleason score to predict pathological stage in men with localized prostate cancer [see comments] J Urol. 1993;150:110–4. doi: 10.1016/s0022-5347(17)35410-1. [DOI] [PubMed] [Google Scholar]
- 135.Kattan MW, Stapleton AM, Wheeler TM, Scardino PT. Evaluation of a nomogram used to predict the pathologic stage of clinically localized prostate carcinoma. Cancer. 1997;79:528–37. [PubMed] [Google Scholar]
- 136.Blute ML, Bergstralh EJ, Partin AW, et al. Validation of Partin tables for predicting pathological stage of clinically localized prostate cancer. J Urol. 2000;164:1591–5. [PubMed] [Google Scholar]
- 137.Epstein JI, Walsh PC, Carmichael M, Brendler CB. Pathologic and clinical findings to predict tumor extent of nonpalpable (stage T1c) prostate cancer. Jama. 1994;271:368–74. [PubMed] [Google Scholar]
- 138.Carter HB, Epstein JI. Prediction of significant cancer in men with stage T1c adenocarcinoma of the prostate. World J Urol. 1997;15:359–63. doi: 10.1007/BF01300183. [DOI] [PubMed] [Google Scholar]
- 139.Goto Y, Ohori M, Arakawa A, Kattan MW, Wheeler TM, Scardino PT. Distinguishing clinically important from unimportant prostate cancers before treatment: value of systematic biopsies. J Urol. 1996;156:1059–63. [PubMed] [Google Scholar]
- 140.Chun FK, Steuber T, Erbersdobler A, et al. Development and internal validation of a nomogram predicting the probability of prostate cancer Gleason sum upgrading between biopsy and radical prostatectomy pathology. Eur Urol. 2006;49:820–6. doi: 10.1016/j.eururo.2005.11.007. [DOI] [PubMed] [Google Scholar]
- 141.Chun FK, Briganti A, Shariat SF, et al. Significant upgrading affects a third of men diagnosed with prostate cancer: predictive nomogram and internal validation. BJU Int. 2006;98:329–34. doi: 10.1111/j.1464-410X.2006.06262.x. [DOI] [PubMed] [Google Scholar]
- 142.Steuber T, Chun FK, Erbersdobler A, et al. Development and internal validation of preoperative transition zone prostate cancer nomogram. Urology. 2006;68:1295–300. doi: 10.1016/j.urology.2006.08.1066. [DOI] [PubMed] [Google Scholar]
- 143.Peller PA, Young DC, Marmaduke DP, Marsh WL, Badalament RA. Sextant prostate biopsies. A histopathologic correlation with radical prostatectomy specimens. Cancer. 1995;75:530–8. doi: 10.1002/1097-0142(19950115)75:2<530::aid-cncr2820750216>3.0.co;2-y. [DOI] [PubMed] [Google Scholar]
- 144.Ackerman DA, Barry JM, Wicklund RA, Olson N, Lowe BA. Analysis of risk factors associated with prostate cancer extension to the surgical margin and pelvic node metastasis at radical prostatectomy. J Urol. 1993;150:1845–50. doi: 10.1016/s0022-5347(17)35912-8. [DOI] [PubMed] [Google Scholar]
- 145.Rabbani F, Bastar A, Fair WR. Site specific predictors of positive margins at radical prostatectomy: an argument for risk based modification of technique. J Urol. 1998;160:1727–33. [PubMed] [Google Scholar]
- 146.Bostwick DG, Qian J, Bergstralh E, et al. Prediction of capsular perforation and seminal vesicle invasion in prostate cancer. J Urol. 1996;155:1361–7. [PubMed] [Google Scholar]
- 147.Gamito EJ, Stone NN, Batuello JT, Crawford ED. Use of artificial neural networks in the clinical staging of prostate cancer: implications for prostate brachytherapy. Tech Urol. 2000;6:60–3. [PubMed] [Google Scholar]
- 148.Gilliland FD, Hoffman RM, Hamilton A, et al. Predicting extracapsular extension of prostate cancer in men treated with radical prostatectomy: results from the population based prostate cancer outcomes study. J Urol. 1999;162:1341–5. [PubMed] [Google Scholar]
- 149.Veltri RW, Miller MC, Partin AW, Poole EC, O’Dowd GJ. Prediction of prostate carcinoma stage by quantitative biopsy pathology. Cancer. 2001;91:2322–8. [PubMed] [Google Scholar]
- 150.Haese A, Chaudhari M, Miller MC, et al. Quantitative biopsy pathology for the prediction of pathologically organ-confined prostate carcinoma: a multiinstitutional validation study. Cancer. 2003;97:969–78. doi: 10.1002/cncr.11153. [DOI] [PubMed] [Google Scholar]
- 151.Badalament RA, Miller MC, Peller PA, et al. An algorithm for predicting nonorgan confined prostate cancer using the results obtained from sextant core biopsies with prostate specific antigen level. J Urol. 1996;156:1375–80. [PubMed] [Google Scholar]
- 152.Pisansky TM, Blute ML, Suman VJ, Bostwick DG, Earle JD, Zincke H. Correlation of pretherapy prostate cancer characteristics with seminal vesicle invasion in radical prostatectomy specimens. Int J Radiat Oncol Biol Phys. 1996;36:585–91. doi: 10.1016/s0360-3016(96)00359-8. [DOI] [PubMed] [Google Scholar]
- 153.Baccala A, Jr, Reuther AM, Bianco FJ, Jr, Scardino PT, Kattan MW, Klein EA. Complete resection of seminal vesicles at radical prostatectomy results in substantial long-term disease-free survival: multi-institutional study of 6740 patients. Urology. 2007;69:536–40. doi: 10.1016/j.urology.2006.12.013. [DOI] [PubMed] [Google Scholar]
- 154.Roach M, 3rd, Marquez C, Yuo HS, et al. Predicting the risk of lymph node involvement using the pre-treatment prostate specific antigen and Gleason score in men with clinically localized prostate cancer. Int J Radiat Oncol Biol Phys. 1994;28:33–7. doi: 10.1016/0360-3016(94)90138-4. [DOI] [PubMed] [Google Scholar]
- 155.Bluestein DL, Bostwick DG, Bergstralh EJ, Oesterling JE. Eliminating the need for bilateral pelvic lymphadenectomy in select patients with prostate cancer. J Urol. 1994;151:1315–20. doi: 10.1016/s0022-5347(17)35239-4. [DOI] [PubMed] [Google Scholar]
- 156.Batuello JT, Gamito EJ, Crawford ED, et al. Artificial neural network model for the assessment of lymph node spread in patients with clinically localized prostate cancer. Urology. 2001;57:481–5. doi: 10.1016/s0090-4295(00)01039-6. [DOI] [PubMed] [Google Scholar]
- 157.Briganti A, Chun FK, Salonia A, et al. Validation of a nomogram predicting the probability of lymph node invasion based on the extent of pelvic lymphadenectomy in patients with clinically localized prostate cancer. BJU Int. 2006;98:788–93. doi: 10.1111/j.1464-410X.2006.06318.x. [DOI] [PubMed] [Google Scholar]
- 158.Briganti A, Karakiewicz PI, Chun FK, et al. Percentage of positive biopsy cores can improve the ability to predict lymph node invasion in patients undergoing radical prostatectomy and extended pelvic lymph node dissection. Eur Urol. 2007;51:1573–81. doi: 10.1016/j.eururo.2007.01.108. [DOI] [PubMed] [Google Scholar]
- 159.Graefen M, Augustin H, Karakiewicz PI, et al. Can nomograms derived in the U.S. applied to German patients? A study about the validation of preoperative nomograms predicting the risk of recurrence after radical prostatectomy. Urologe A. 2003;42:685–92. doi: 10.1007/s00120-002-0251-x. [DOI] [PubMed] [Google Scholar]
- 160.Graefen M, Noldus J, Pichlmeier U, et al. Early prostate-specific antigen relapse after radical retropubic prostatectomy: prediction on the basis of preoperative and postoperative tumor characteristics. Eur Urol. 1999;36:21–30. doi: 10.1159/000019922. [DOI] [PubMed] [Google Scholar]
- 161.Tewari A, Issa M, El-Galley R, et al. Genetic adaptive neural network to predict biochemical failure after radical prostatectomy: a multi-institutional study. Mol Urol. 2001;5:163–9. doi: 10.1089/10915360152745849. [DOI] [PubMed] [Google Scholar]
- 162.Mitchell JA, Cooperberg MR, Elkin EP, et al. Ability of 2 pretreatment risk assessment methods to predict prostate cancer recurrence after radical prostatectomy: data from CaPSURE. J Urol. 2005;173:1126–31. doi: 10.1097/01.ju.0000155535.25971.de. [DOI] [PubMed] [Google Scholar]
- 163.Cooperberg MR, Pasta DJ, Elkin EP, et al. The University of California, San Francisco Cancer of the Prostate Risk Assessment score: a straightforward and reliable preoperative predictor of disease recurrence after radical prostatectomy. J Urol. 2005;173:1938–42. doi: 10.1097/01.ju.0000158155.33890.e7. [DOI] [PMC free article] [PubMed] [Google Scholar]
- 164.Cooperberg MR, Freedland SJ, Pasta DJ, et al. Multiinstitutional validation of the UCSF cancer of the prostate risk assessment for prediction of recurrence after radical prostatectomy. Cancer. 2006;107:2384–91. doi: 10.1002/cncr.22262. [DOI] [PubMed] [Google Scholar]
- 165.May M, Knoll N, Siegsmund M, et al. Validity of the CAPRA score to predict biochemical recurrence-free survival after radical prostatectomy. Results from a european multicenter survey of 1,296 patients. J Urol. 2007;178:1957–62. doi: 10.1016/j.juro.2007.07.043. discussion 1962. [DOI] [PubMed] [Google Scholar]
- 166.Bauer JJ, Connelly RR, Seterhenn IA, et al. Biostatistical modeling using traditional preoperative and pathological prognostic variables in the selection of men at high risk for disease recurrence after radical prostatectomy for prostate cancer. J Urol. 1998;159:929–33. [PubMed] [Google Scholar]
- 167.Moul JW, Connelly RR, Lubeck DP, et al. Predicting risk of prostate specific antigen recurrence after radical prostatectomy with the Center for Prostate Disease Research and Cancer of the Prostate Strategic Urologic Research Endeavor databases. J Urol. 2001;166:1322–7. [PubMed] [Google Scholar]
- 168.Potter SR, Miller MC, Mangold LA, et al. Genetically engineered neural networks for predicting prostate cancer progression after radical prostatectomy. Urology. 1999;54:791–5. doi: 10.1016/s0090-4295(99)00328-3. [DOI] [PubMed] [Google Scholar]
- 169.Ramsden AR, Chodak G. An analysis of risk factors for biochemical progression in patients with seminal vesicle invasion: validation of Kattan’s nomogram in a pathological subgroup. BJU Int. 2004;93:961–4. doi: 10.1111/j.1464-410X.2003.04760.x. [DOI] [PubMed] [Google Scholar]
- 170.Stamey TA, Yemoto CM, McNeal JE, Sigal BM, Johnstone IM. Prostate cancer is highly predictable: a prognostic equation based on all morphological variables in radical prostatectomy specimens. J Urol. 2000;163:1155–60. doi: 10.1016/s0022-5347(05)67713-0. [DOI] [PubMed] [Google Scholar]
- 171.McAleer SJ, Schultz D, Whittington R, et al. PSA outcome following radical prostatectomy for patients with localized prostate cancer stratified by prostatectomy findings and the preoperative PSA level. Urol Oncol. 2005;23:311–7. doi: 10.1016/j.urolonc.2004.12.013. [DOI] [PubMed] [Google Scholar]
- 172.Duchesne GM, Bloomfield D, Wall P. Identification of intermediate-risk prostate cancer patients treated with radiotherapy suitable for neoadjuvant hormone studies. Radiother Oncol. 1996;38:7–12. doi: 10.1016/0167-8140(95)01645-7. [DOI] [PubMed] [Google Scholar]
- 173.Pisansky TM, Kahn MJ, Bostwick DG. An enhanced prognostic system for clinically localized carcinoma of the prostate. Cancer. 1997;79:2154–61. doi: 10.1002/(sici)1097-0142(19970601)79:11<2154::aid-cncr13>3.0.co;2-v. [DOI] [PubMed] [Google Scholar]
- 174.Zagars GK, Pollack A, von Eschenbach AC. Prognostic factors for clinically localized prostate carcinoma: analysis of 938 patients irradiated in the prostate specific antigen era. Cancer. 1997;79:1370–80. [PubMed] [Google Scholar]
- 175.Shipley WU, Thames HD, Sandler HM, et al. Radiation therapy for clinically localized prostate cancer: a multi-institutional pooled analysis. Jama. 1999;281:1598–604. doi: 10.1001/jama.281.17.1598. [DOI] [PubMed] [Google Scholar]
- 176.Ragde H, Elgamal AA, Snow PB, et al. Ten-year disease free survival after transperineal sonography-guided iodine-125 brachytherapy with or without 45-gray external beam irradiation in the treatment of patients with clinically localized, low to high Gleason grade prostate carcinoma. Cancer. 1998;83:989–1001. doi: 10.1002/(sici)1097-0142(19980901)83:5<989::aid-cncr26>3.0.co;2-q. [DOI] [PubMed] [Google Scholar]
- 177.Partin AW, Pearson JD, Landis PK, et al. Evaluation of serum prostate-specific antigen velocity after radical prostatectomy to distinguish local recurrence from distant metastases. Urology. 1994;43:649–59. doi: 10.1016/0090-4295(94)90180-5. [DOI] [PubMed] [Google Scholar]
- 178.D’Amico AV, Moul J, Carroll PR, Sun L, Lubeck D, Chen MH. Cancer-specific mortality after surgery or radiation for patients with clinically localized prostate cancer managed during the prostate-specific antigen era. J Clin Oncol. 2003;21:2163–72. doi: 10.1200/JCO.2003.01.075. [DOI] [PubMed] [Google Scholar]
- 179.D’Amico AV, Cote K, Loffredo M, Renshaw AA, Schultz D. Determinants of prostate cancer-specific survival after radiation therapy for patients with clinically localized prostate cancer. J Clin Oncol. 2002;20:4567–73. doi: 10.1200/JCO.2002.03.061. [DOI] [PubMed] [Google Scholar]
- 180.D’Amico AV, Cote K, Loffredo M, Renshaw AA, Schultz D. Determinants of prostate cancer specific survival following radiation therapy during the prostate specific antigen era. J Urol. 2003;170:S42–6. doi: 10.1097/01.ju.0000094800.63501.15. discussion S46–7. [DOI] [PubMed] [Google Scholar]
- 181.Zhou P, Chen MH, McLeod D, Carroll PR, Moul JW, D’Amico AV. Predictors of prostate cancer-specific mortality after radical prostatectomy or radiation therapy. J Clin Oncol. 2005;23:6992–8. doi: 10.1200/JCO.2005.01.2906. [DOI] [PubMed] [Google Scholar]
- 182.Stephenson AJ, Scardino PT, Kattan MW, et al. Predicting the outcome of salvage radiation therapy for recurrent prostate cancer after radical prostatectomy. J Clin Oncol. 2007;25:2035–41. doi: 10.1200/JCO.2006.08.9607. [DOI] [PMC free article] [PubMed] [Google Scholar]
- 183.Svatek R, Karakiewicz PI, Shulman M, Karam J, Perrotte P, Benaim E. Pre-treatment nomogram for disease-specific survival of patients with chemotherapy-naive androgen independent prostate cancer. Eur Urol. 2006;49:666–74. doi: 10.1016/j.eururo.2005.11.032. [DOI] [PubMed] [Google Scholar]
- 184.Wang L, Hricak H, Kattan MW, et al. Combined endorectal and phased-array MRI in the prediction of pelvic lymph node metastasis in prostate cancer. AJR Am J Roentgenol. 2006;186:743–8. doi: 10.2214/AJR.04.1682. [DOI] [PubMed] [Google Scholar]
- 185.Shariat SF, Park S, Trinh QD, Roehrborn CG, Slawin KM, Karakiewicz PI. Plasminogen Activation Inhibitor-1 Improves the Predictive Accuracy of Prostate Cancer Nomograms. J Urol. 2007 doi: 10.1016/j.juro.2007.05.161. [DOI] [PubMed] [Google Scholar]