Abstract
Xanthine oxidase is a molybdenum-containing enzyme catalyzing the hydroxylation of a sp2-hybridized carbon in a broad range of aromatic heterocycles and aldehydes. Crystal structures of the bovine enzyme in complex with the physiological substrate hypoxanthine at 1.8 Å resolution and the chemotherapeutic agent 6-mercaptopurine at 2.6 Å resolution have been determined, showing in each case two alternate orientations of substrate in the two active sites of the crystallographic asymmetric unit. One orientation is such that it is expected to yield hydroxylation at C-2 of substrate, yielding xanthine. The other suggests hydroxylation at C-8 to give 6,8-dihydroxypurine, a putative product not previously thought to be generated by the enzyme. Kinetic experiments demonstrate that >98% of hypoxanthine is hydroxylated at C-2 rather than C-8, indicating that the second crystallographically observed orientation is significantly less catalytically effective than the former. Theoretical calculations suggest that enzyme selectivity for the C-2 over C-8 of hypoxanthine is largely due to differences in the intrinsic reactivity of the two sites. For the orientation of hypoxanthine with C-2 proximal to the molybdenum center, the disposition of substrate in the active site is such that Arg880 and Glu802, previous shown to be catalytically important for the conversion of xanthine to uric acid, play similar roles in hydroxylation at C-2 as at C-8. Contrary to the literature, we find that 6,8-dihydroxypurine is effectively converted to uric acid by xanthine oxidase.
Keywords: Enzyme Catalysis, Enzyme Kinetics, Hydroxylase, Metalloenzymes, X-ray Crystallography, Purine Hydroxylation, Specificity, Xanthine Oxidase
Introduction
Purine oxidation in nature is catalyzed by three distinct classes of enzymes: the molybdenum-containing hydroxylases such as xanthine oxidoreductase (1, 2), the FeII- and α-ketoglutarate-dependent xanthine hydroxylases (3, 4), and a newly described two-component system, HpxDE, consisting of a [2Fe-2S]/flavin-containing reductase and a Rieske/non-heme iron-containing oxygenase (5, 6). The first class is by far the most broadly distributed, with members found throughout the eubacteria, archaea, and eukaryota. The second class is found principally in fungae, including yeasts (Saccharomyces cerevisiae, for example), and the third is identified to date only in Klebsiella oxytoca and Klebsiella pneumoniae.
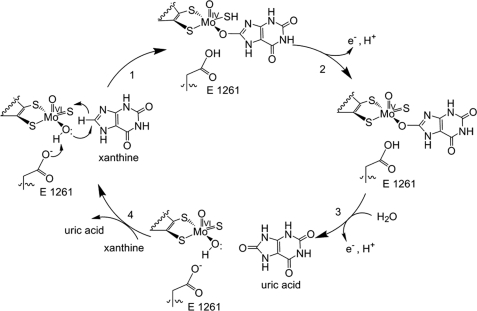
Xanthine oxidoreductases from eukaryotes are homodimers of ∼290 kDa, with each monomer containing four redox-active sites: an active site molybdenum center, a pair of spinach ferredoxin-like [2Fe-2S] clusters, and FAD (7). The overall catalytic sequence consists of a reductive half-reaction in which substrate is oxidatively hydroxylated at the molybdenum center (reducing it from Mo(VI) to Mo(IV)) and, after intramolecular electron transfer, an oxidative half-reaction in which reducing equivalents are removed from the enzyme via its FAD. In the reductive half-reaction, purine substrates are hydroxylated at a specific carbon position in a reaction initiated by nucleophilic attack of an equatorial Mo-OH group of the metal center whose deprotonation is thought to be facilitated by a conserved glutamate residue (Glu1261 in the bovine enzyme), as shown in Fig. 1 (8, 9). Concomitantly, hydride is transferred from the carbon being hydroxylated to a Mo=S group of the molybdenum coordination sphere, yielding a key intermediate that can be formulated as LMo(IV)O(SH)(OP), where OP represents now-hydroxylated product coordinated to molybdenum via the catalytically introduced hydroxyl group, and L represents the enedithiolate ligand of a pyranopterin cofactor common to all mononuclear molybdenum and tungsten enzymes (2, 10). In the course of electron transfer out of the molybdenum center, bound product is displaced by solvent hydroxide to regenerate the Mo-OH ligand for a subsequent catalytic cycle. In the oxidative half-reaction, electrons are passed from the FAD center to a terminal electron acceptor, NAD+ in the case of the dehydrogenase form of the enzyme or O2 in the case of the oxidase form (7, 11).
FIGURE 1.
The reaction mechanism for xanthine oxidase. Catalysis is initiated by base-assisted nucleophilic attack of the equatorial Mo-OH on the C-8 carbon of xanthine with concomitant hydride transfer from C-8 to Mo=S, which simultaneously results in reduction of Mo(VI) to Mo(IV). Reoxidation of the molybdenum center occurs by electron transfer to the other redox-active centers of the enzyme, accompanied by deprotonation of the Mo-SH bond and displacement of bound product by hydroxide from solvent to regenerate the Mo-OH group.
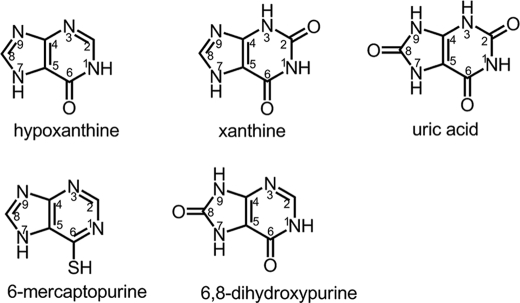
It has long been understood that hypoxanthine is first hydroxylated by this enzyme at C-2 to form xanthine, and xanthine is then further converted to uric acid by hydroxylation at C-8 (purine structures shown in Fig. 2). Hydroxylation at C-8 prior to C-2 was thought not to occur because the resulting product, 6,8-dihydroxypurine, was believed not to be an effective substrate for the enzyme and could not be subsequently hydroxylated to uric acid. In the present work, we demonstrate that the crystal structures of bovine xanthine oxidase in complex with hypoxanthine at 1.8 Å resolution and 6-mercaptopurine at 2.6 Å resolution each reveal two possible orientations of substrate at the active site. With each substrate, one orientation has C-2 positioned appropriately for hydroxylation by the molybdenum center, and the second has C-8 so positioned instead. Both of the orientations seen here have the exocyclic functional group at the C-6 position adjacent to a conserved arginine residue (Arg880 in the bovine enzyme), consistent with our previous conclusions regarding the catalytic role of Arg880 in stabilizing negative charge accumulation on the heterocycle at this position in the course of the reaction (12–14). In light of these results, we have undertaken further kinetic studies and confirm that xanthine is indeed the sole product of enzyme action on hypoxanthine; to within our detection limits 6,8-dihydroxypurine is not formed, despite the fact that hypoxanthine is able to bind in an orientation that permits such hydroxylation. On the other hand, and contrary to the literature, we find that 6,8-dihydroxypurine is an effective substrate for xanthine oxidase and is readily converted to uric acid. The specific catalytic roles of two active site residues, Glu802 and Arg880, are discussed in the context of the observed orientation of substrate.
FIGURE 2.
Chemical structures and numbering scheme of purines used in the present work.
EXPERIMENTAL PROCEDURES
Materials
6,8-Dihydroxypurine was graciously provided by Drs. Robert Hausinger and Scott Mulrooney (Department of Biochemistry and Molecular Biology, Michigan State University) with the assistance of Dr. Claudio Scazzocchio (Institut de Génétique et Microbiologie, UMR CNRS C8621, Université de Paris-XI, Orsay, France and the Department of Microbiology, Imperial College, London). All other chemicals and reagents were obtained at the highest quality/purity available from Sigma-Aldrich or Fisher and were used without further purification.
Isolation of Xanthine Oxidase
Xanthine oxidase was purified from fresh, unpasteurized bovine milk (Scott Brothers Dairy, Chino, CA). To eliminate possible problems caused by possible genetic heterogeneity, the enzyme used for crystallography was isolated from milk obtained from an individual cow. The purification protocol was modified from previous methods, as described elsewhere (15), and yielded enzyme with a ratio of absorbance at 280 and 450 nm of 6.0–6.8 and a 30–60% functional caused by variability in the amount of the inactive desulfo form of the enzyme present (in which a catalytically essential Mo=S group has been replaced by a second Mo=O group in the molybdenum coordination sphere). The percentage of functionality was determined as described previously by Edmondson et al. (16). The purified enzyme was made 1.0 mm in sodium salicylate and stored in liquid nitrogen; it was passed down a Sephadex G-25 column (to remove salicylate) prior to use.
Crystallization, Data Acquisition, and Structure Determination
All enzyme crystals were grown using the batch method according to previously published methods using microbridges to hold batch solutions in sealed wells of a 24-well tray (14). Each batch contained 10 μl of 34.5 μm (5 mg/ml) enzyme mixed with 5–6 μl of 12% polyethylene glycol 8000 precipitant solution. As reported previously, the final pH of the well solution in each case was 7.0. The enzyme concentration used here refers to total monomer concentration based on an extinction coefficient at 450 nm of 37.8 mm−1 cm−1 (15).
Crystals were grown at 25 °C in the dark for 2–3 days. Hypoxanthine or 6-mercaptopurine was introduced to xanthine oxidase crystals via soaking to reach a final concentration of the substrate of 5–10 mm in the crystal well. After 1–5 min of soaking of the substrate, the crystals were mounted and flash-frozen in liquid nitrogen. A 42% solution of polyethylene glycol 200 was used as cryoprotectant. Magnetic bases for use with the automated crystallography system at LRL-CAT were obtained from MAR-USA (Evanston, IL). Mounted cryoloops, magnetic cryovials, and crystal growth materials were obtained from Hampton Research (Aliso Viejo, CA). Diffraction data were collected at the Argonne National Laboratory on the LRL-CAT beamline using a wavelength of 0.9793 Å and a MARCCD 165 detector. Data sets were collected to a resolution of 1.8 Å for the hypoxanthine complex and 2.6 Å for the 6-mercaptopurine complex.
Crystallographic data were processed using the MOSFLM package of the CCP4 program suite (17, 18). The structure of each complex was determined by molecular replacement using the MOLREP package of CCP4 with the previously reported crystal structure of xanthine oxidase of Enroth et al. (11) as the search model (Protein Data Bank code 1FIQ). The output structure was refined first by rigid body refinement and then restrained refinement using REFMAC in the CCP4 suite (19–23). The weighting term for geometric restraints was adjusted to minimize Rcryst while at the same time minimizing the difference between Rcryst and Rfree. Noncrystallographic symmetry restraints (set on “tight” in REFMAC) were used between the monomers of the homodimer in refining the structure of only the 6-mercaptopurine complex, because this symmetry averaging minimized the divergence between Rcryst and Rfree. Water molecules were added to both the crystal structures using REFMAC before building in the substrates.
Structure files for hypoxanthine and 6-mercaptopurine were constructed using the PRODRG2 server (24), and the respective Protein Data Bank codes were built into the corresponding 2Fo − Fc and Fo − Fc omit electron density maps using COOT (25). After merging the substrate structure files with those for the respectively refined protein structures, the results were refined again using the restrained refinement in REFMAC. All of the images were rendered using PyMol (26).
Steady-state Kinetic Experiments
UV-visible absorption spectra and steady-state experiments were carried out using a Hewlett-Packard 8452 diode array spectrophotometer. Substrate and enzyme were added to 3 ml of air-equilibrated 0.1 m sodium pyrophosphate at pH 8.5 or 0.1 m MOPS at pH 7.0 in a quartz cuvette and mixed manually prior to recording the time-dependent absorbance change at an appropriate wavelength for each substrate. For each substrate examined, the initial reaction mix contained a fixed concentration of functional xanthine oxidase (typically on the order of 5 × 10⁻⁹ m) and varying concentrations of substrates (in the range 1–100 μm). The initial rates were calculated from linear fits of the first 10–20 s of each transient. The kinetic parameters kcat and Km were obtained from hyperbolic fits to plots of vobs/[E] versus [S] using Equation 1.
The extinction coefficient used for the conversion of xanthine to uric acid in standard steady-state assays was Δϵ295 nm = 9600 m−1 cm−1 (15), and that for 6,8-dihydroxypurine to uric acid was Δϵ295 nm = 9530 m−1 cm−1 (as determined here from standard solutions) at pH 8.5; the extinction coefficient for the conversion of hypoxanthine to xanthine was Δϵ275 nm = 6850 m−1 cm−1 at pH 8.5 and Δϵ270 nm = 6290 m−1 cm−1 at pH 7.0 (also determined here). All wavelengths yielded the maximal absorbance change at each pH in these initial velocity experiments. The buffers included 0.1 m sodium pyrophosphate (pH 8.5) with 0.3 mm EDTA and 0.1 m MOPS (pH 7.0) with 0.1 m KCl and 0.2 mm EDTA. All of the steady-state reactions were performed aerobically at 25 °C. Each assay was repeated in triplicate and averaged.
Reductive Half-reaction Experiments
Rapid kinetic experiments were performed using an Applied Photophysics Inc. SX-18MV stopped flow apparatus equipped with a diode array detector. Enzyme was made anaerobic in glass tonometers by cycles of evacuating and flushing with O2-scrubbed argon over the course of an hour or more. Substrate solutions were made anaerobic by bubbling solutions in air-tight glass syringes for 10–15 min. The reaction conditions were 0.1 m pyrophosphate, 0.3 mm EDTA (pH 8.5) at 25 °C. The reactions were followed at 450 nm, monitoring the absorbance decrease caused by enzyme reduction. The initial reaction mix typically contained 3.6 μm functional enzyme and 10–200 μm substrate. For each substrate concentration used, the reaction was repeated in triplicate with kinetic transients fitted to a single exponential equation using manufacturer's software to obtain kobs. The kinetic parameters kred and Kd were obtained from hyperbolic fits to plots of kobs and [S] using Equation 2.
Exhaustive Turnover with Hypoxanthine
Experiments following the exhaustive turnover of hypoxanthine by xanthine oxidase were performed by mixing hypoxanthine (10, 50, or 100 μm) with enzyme, following the reaction to completion spectrophotometrically over the wavelength range 240–330 nm. The experiments were done at pH 8.5 and 7.0 at 25 °C. The spectra were deconvoluted using the known spectra for hypoxanthine, xanthine, 6,8-dihydroxypurine, and urate to obtain the fractional levels of each species as a function of time. The contribution of enzyme (6.7 or 6.8 nm functional) was corrected by recording the base line with enzyme present to subtract out its (negligible) contribution in the near-ultraviolet. Spectral deconvolution was performed using the MATLAB 7.0.1 program running a multiple least square regression according to Equation 3 and 4.
Here, Atotal is the absorbance of the reaction mixture; A1…A4 indicate the respective absorption spectra for hypoxanthine, xanthine, 6,8-dihydroxypurine, and uric acid; and x1…x4 indicate the fractional level of each species.
RESULTS
Overall Crystal Structures of Xanthine Oxidase in Complex with Hypoxanthine and 6-Mercaptopurine
The crystal structure of xanthine oxidase in complex with hypoxanthine was solved at 1.8 Å resolution by molecular replacement with the previously reported crystal structure of xanthine oxidase of Enroth et al. (11) as the search model (Protein Data Bank code 1FIQ). The final R factors were Rcryst of 19.7% and Rfree of 23.4% (Table 1). The crystal structure of the complex of xanthine oxidase with 6-mercaptopurine was solved at 2.6 Å resolution, with final R factors Rcryst of 21.7% and Rfree of 26.9% (Table 1). The overall structure of the homodimer in both current crystal structures is very similar to that seen previously for the oxidized bovine enzyme (11) and our own previously reported structures of the enzyme in complex with 2-hydroxy-6-methylpurine, xanthine, and lumazine (13, 14). As seen previously (13, 14), finite electron density for the C-terminal residues of one monomer of the single homodimer in the asymmetric unit was evident, and these residues were added during refinement (residues 1316–1326 and 1316–1325 for the structures in complex with hypoxanthine and 6-mercaptopurine, respectively).
TABLE 1.
Statistics for data collection and refinement of the crystal structures
Ramachandran statistics indicate the percentages of residues in the most favored, additionally allowed, generously allowed, and disallowed regions of the Ramachandran diagram as defined by the program PROCHECK (36).
| Xanthine oxidase complexed with hypoxanthine (Protein Data Bank code 3NRZ) | Xanthine oxidase complexed with 6-mercaptopurine (Protein Data Bank code 3NS1) | |
|---|---|---|
| Space group | P21 | P21 |
| Resolution (Å) | 23.5–1.8 | 45.5–2.6 |
| Wavelength (Å) | 0.9793 | 0.9793 |
| Unique reflections (test set) | 234,367 (11843) | 78,350 (3922) |
| Completeness % (highest resolution shell, Å) | 95.1 (84.4) | 92.4 (92.1) |
| I/σ (highest resolution shell) | 10.5 (2.1) | 7.5 (5.3) |
| Rcryst (highest resolution shell) | 19.7 (27.8) | 21.7 (31.2) |
| Rfree (highest resolution shell) | 23.4 (32.8) | 26.9 (37.8) |
| Ramachandran statistics (%) | 89.9, 9.2, 0.5, 0.4 | 87.5, 11.2, 0.8, 0.5 |
| Mean coordinate error based on free R value (Å) | 0.132 | 0.373 |
| Mean coordinate error based on maximum likelihood (Å) | 0.089 | 0.243 |
| Root mean square deviation bond length (Å) | 0.012 | 0.016 |
| Root mean square deviation bond angles (°) | 1.4 | 1.7 |
| Average B value (Å2) | 23.9 | 27.1 |
| Number of nonhydrogen atoms in refinement | 20,353 | 19,357 |
| Number of waters | 1274 | 287 |
Orientations of Hypoxanthine and 6-Mercaptopurine in the Active Site
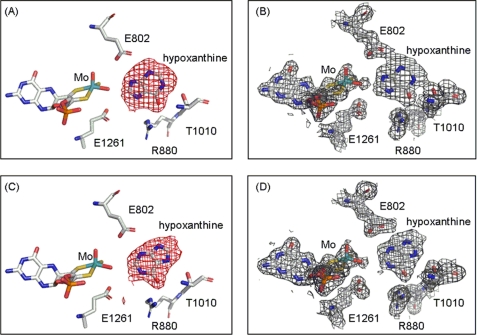
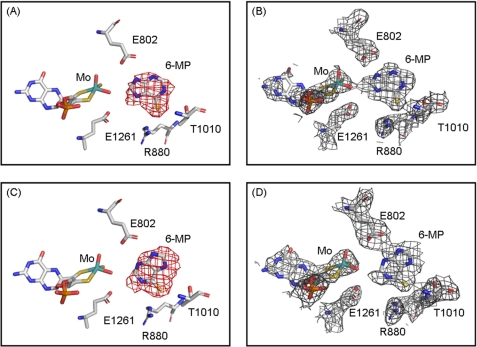
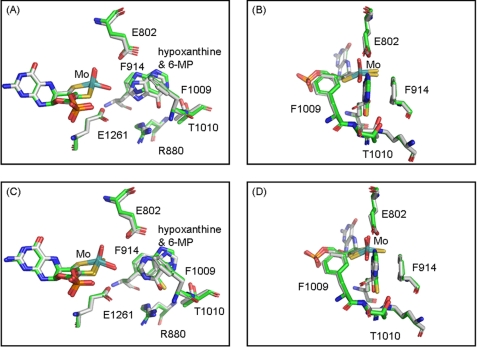
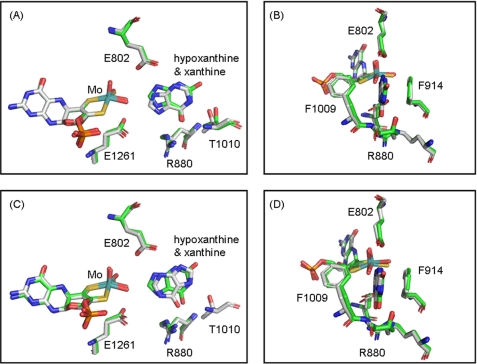
Fig. 3 shows Fo − Fc and 2Fo − Fc omit density maps for hypoxanthine bound in each of the two active sites of the asymmetric unit, contoured at 3.0 and 1.0 σ, respectively. Two distinct orientations of hypoxanthine are found based on the strong positive electron density shown in the Fo − Fc omit map. Although both orientations have C-6=O toward Arg880, in one active site hypoxanthine is oriented with C-8 toward the molybdenum center, whereas in the other active site it is the C-2 position that is so oriented. This contrasts with our previously determined structure of the desulfo enzyme in complex with xanthine, which shows the same orientation of xanthine in both active sites of the asymmetric unit. Examination of the Fo − Fc omit maps contoured at a higher and more demanding level of 4.0 σ for the present enzyme-hypoxanthine complex clearly indicates that substrate occupies two different orientations in the two active sites of the asymmetric unit (see supplemental Figs. S1 and S2). Two distinct orientations are confirmed in the crystal structure of the enzyme complex with 6-mercaptopurine (a close analog of hypoxanthine), where again two distinct orientations of substrate are observed (Fig. 4). The omit maps for the 6-mercaptopurine complex do not have the same quality as seen with the hypoxanthine complex, but the electron-rich sulfur atom of 6-mercaptopurine helps to identify the orientations unambiguously. A superposition of the two present structures (Fig. 5) indicates that both the overall orientations of substrate and positions of the several active site amino acids are very similar for hypoxanthine and 6-mercaptopurine, except that Thr1010 appears to hydrogen bond to N-1 or N-7 (for the orientations with C-2 and C-8 proximal, respectively) of hypoxanthine but not to 6-mercaptopurine. This appears to be due to a rotation of 6-mercaptopurine by ∼15° to accommodate the larger sulfur atom at the C-6 position.
FIGURE 3.
The structures of xanthine oxidase complexed with hypoxanthine. A and B show one active site in the asymmetric unit with C-8 of hypoxanthine oriented toward the molybdenum center, whereas C and D show the other active site in the asymmetric unit with C-2 toward the molybdenum center. All of the electron density maps were omit maps constructed without hypoxanthine and overlaid with the final model. Fo − Fc maps in A and C were contoured at 3.0 σ, and 2Fo − Fc maps in B and D were contoured at 1.0 σ both within 2 Å of all atoms shown. Molybdenum is in teal, carbon is in white, nitrogen is in blue, oxygen is in red, sulfur is in yellow, and phosphorus is in orange.
FIGURE 4.
The structures of xanthine oxidase complexed with 6-mercaptopurine. A and B show one active site in the asymmetric unit with C-8 of 6-mercaptopurine toward the molybdenum center, whereas C and D show the other active site in the asymmetric unit with C-2 toward the molybdenum center. Electron density maps were constructed without 6-mercaptopurine and overlaid with the final model. Fo − Fc maps in A and C were contoured at 3.0 σ, and 2Fo − Fc maps in B and D were contoured at 1.0 σ both within 2 Å of all atoms shown. Molybdenum is in teal, carbon is in white, nitrogen is in blue, oxygen is in red, sulfur is in yellow, and phosphorus is in orange.
FIGURE 5.
Superposition of the active sites of hypoxanthine- and 6-mercaptopurine-complexed xanthine oxidase. A and B show the active site in the asymmetric unit having the C-8 of substrate toward the molybdenum center, whereas C and D shows the other active site in the asymmetric unit with C-2 toward the molybdenum center. B and D are rotated ∼90° clockwise about the vertical axis from the perspective shown in A and C, respectively. Molybdenum is in teal, nitrogen is in blue, oxygen is in red, sulfur is in yellow, and phosphorus is in orange. Carbon is in white for the hypoxanthine complex and green for the 6-mercaptopurine complex. The superposition was performed by using the program PyMOL (DeLano Scientific LLC, San Carlos, CA).
In the hypoxanthine complex with C-8 oriented toward the molybdenum center, the distance between C-8 and molybdenum is 4.7 ± 0.02 Å, and that between C-8 and the Mo-OH oxygen is 2.8 ± 0.02 Å. The corresponding distances for the orientation with C-2 nearest the molybdenum center are 5.1 ± 0.02 and 3.2 ± 0.02 Å, respectively. The shape of the electron density in the omit map is consistent with hypoxanthine rather than xanthine or uric acid, as expected given the high hypoxanthine concentrations used and the short period of incubation time between adding substrate and freezing the crystal. There is no bridging electron density to suggest covalent bond formation between the molybdenum center and hypoxanthine in either active site, indicating partial progression through the catalytic sequence, most likely caused by the rather low functionality of the enzyme and the short lifetime expected for the catalytic intermediate. The two orientations of hypoxanthine bound in the present crystal structure must be considered alternate Michaelis-Menten complexes formed prior to the onset of catalysis. Our results contrast with the structure recently reported for the desulfo form of the Rhodobacter capsulatus xanthine dehydrogenase with hypoxanthine, in that only one orientation of hypoxanthine was seen with the bacterial enzyme: that with C-2 toward the molybdenum center (27). Given the high degree of structural homology between the two proteins, we suggest that the difference between the two structures is likely due to our relatively higher resolution (1.8 Å, as compared with 2.9 Å for the R. capsulatus xanthine dehydrogenase).
As seen previously (14), the structure of the hypoxanthine complex here shows that the side chain carboxylate of Glu802 is within hydrogen bonding distance (∼3.0–3.5 Å for the C-2 and C-8 proximal orientations, respectively) to N-3 and N-9 of the substrate, and the guanidinium group of Arg880 is near (3.1 and 2.8 Å, respectively) to the C-6 keto group in the two substrate orientations. The side chain hydroxyl of Thr1010 is within hydrogen bonding distance (3.1 and 3.3 Å) of either N-1 or N-7 (for the orientations with C-2 and C-8 proximal, respectively). As in all previously reported structures of substrate-analog complexes, Phe914 and Phe1009 form van der Waal's interactions with substrate that constrain substrate to a well defined plane approximately perpendicular to the base plane of the square-pyramidal coordination sphere of the molybdenum center (Fig. 5). Finally, Glu1261 is within hydrogen bonding distance (3.1 and 3.4 Å) of the Mo-OH oxygen in both active sites, supporting the role of this residue as a general base that deprotonates Mo-OH in the course of nucleophilic attack on the substrate carbon (9, 28).
Steady-state and Reductive Half-reaction Kinetics of Xanthine Oxidase with 6,8-Dihydroxypurine and Hypoxanthine
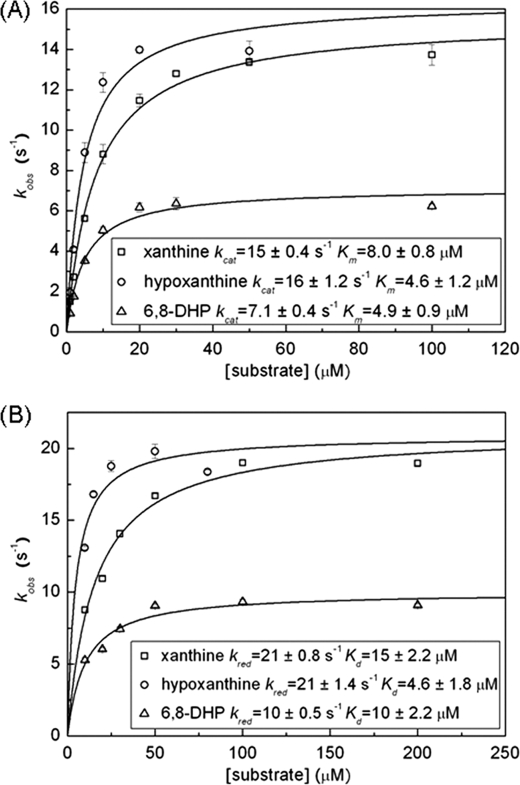
Given the structural evidence above indicating that hypoxanthine (and 6-mercaptopurine) bind in a way that should permit hydroxylation of the C-8 position as well as the C-2 position, the question arises as to whether 6,8-dihydroxypurine might in fact accumulate as an intermediate in the course of converting hypoxanthine to uric acid. We first investigated the reactivity of the putative reaction product, 6,8-dihydroxypurine, with enzyme. Fig. 6 shows plots of the steady-state and reductive half-reaction kinetics of xanthine oxidase with 6,8-dihydroxypurine and, for comparison, those for xanthine. The kinetic parameters are summarized in Table 2. The limiting rate kcat for the steady-state reaction with 6,8-dihydroxypurine is 7 ± 0.4 s−1, comparable with the 15 ± 0.4 s−1 seen for xanthine; the Michaelis constant Km is 5 ± 1 μm for 6,8-dihydroxypurine (compared with 8 ± 1 μm for xanthine). The limiting rate kred for the reductive half-reaction (i.e. the reaction of oxidized enzyme with excess substrate under anaerobic conditions) is 10 ± 0.5 s−1, and the dissociation constant Kd is 10 ± 2 μm for 6,8-dihydroxypurine (the corresponding values with xanthine as substrate were 21 ± 0.8 s−1 and 15 ± 2 μm, respectively, in good agreement with literature values of kred = 17 s−1, Kd = 17 μm; Refs. 29, 30). Thus, contrary to the literature, we find that 6,8-dihydroxypurine does indeed react readily with xanthine oxidase, being effectively converted to uric acid by hydroxylation at C-2.
FIGURE 6.
Plots of observed rate constant (B) versus [substrate] for the reaction of xanthine oxidase with xanthine, hypoxanthine, and 6,8-dihydroxypurine. A, steady-state experiments following product formation at 250 μm O2 at 25 °C. The xanthine reaction was followed at 295 nm, the hypoxanthine reaction was at 275 nm, and the 6,8-dihydroxypurine reaction was at 295 nm. B, anaerobic reductive half-reaction experiments following the reduction of enzyme by excess substrate at 25 °C at 450 nm. All of the reactions were carried out in 0.1 m sodium pyrophosphate, 0.3 mm EDTA, pH 8.5.
TABLE 2.
Kinetic parameters for the steady-state and reductive half-reactions of xanthine oxidase
–, Steady-state reactions not performed in the present work. 6,8-DHP, 6,8-dihydroxypurine.
| Substrate | pH 8.5 |
pH 7.0 |
|||||||
|---|---|---|---|---|---|---|---|---|---|
| kcat | Km | kcat/Km | kred | Kd | kred/Kd | kcat | Km | kcat/Km | |
| s−1 | μm | μm−1s−1 | s−1 | μm | μm−1s−1 | s−1 | μm | μm−1s−1 | |
| Xanthine | 15/12a/15b/16c | 8.0/6a/11b/15c | 1.9/1.9a/1.1c | 21/17a/13b | 15/17a | 1.4/1.0a | 7.3a/3.1c | 0.56a/0.26c | 13a/12c |
| Hypoxanthine | 16/15c | 4.6/13c | 3.5/1.2c | 21 | 4.6 | 4.6 | 10 | 7.5 | 1.3/0.083d |
| 6,8-DHP | 7.1 | 4.9 | 1.4 | 10 | 10 | 1.0 | – | – | – |
a From Ref. 29.
b From Ref. 30.
c From the hyperbolic fit of the data from spectral deconvolution of exhaustive turnover reactions of xanthine oxidase with hypoxanthine in the present work. Kinetics of hypoxanthine is followed by its consumption, and kinetics of xanthine is followed by production of uric acid.
d From the linear fit of the data from spectral deconvolution of exhaustive turnover reactions in the present work.
Bearing in mind complications arising from the subsequent action of enzyme on product xanthine (and possibly 6,8-dihydroxypurine) in the course of the reaction hypoxanthine, we note that initial velocity steady-state assays should be only minimally affected at the earliest times, because xanthine will not have accumulated to any significant degree. Also in the case of reductive half-reaction experiments, xanthine will be generated at most only at a stoichiometry twice that of the enzyme concentration in the course of the reaction, and given the large stoichiometric excess of hypoxanthine over enzyme in these experiments, the effect of accumulating xanthine should thus also be minimal. Fig. 6 shows plots of the steady-state and reductive half-reaction kinetics of xanthine oxidase with hypoxanthine, with the results summarized in Table 2. Interestingly, kcat/Km favors xanthine over hypoxanthine by a factor of 10 at pH 7.0, with (kcat/Km)xanthine = 1.3 × 10⁷ m−1 s−1 and (kcat/Km)hypoxanthine = 1.3 × 10⁶ m−1 s−1 but favors hypoxanthine by almost a factor of 2 at pH 8.5 (1.9 × 10⁶ and 3.5 × 10⁶ m−1 s−1, respectively). This is principally due to the effect of pH on Km and reflects the different ionization constants for the two substrates: the pKa for the equilibrium between neutral and monoanion forms is 7.4 for xanthine and 8.9 for hypoxanthine (31). Given that enzyme acts on the neutral form of substrate (29), the higher pKa for hypoxanthine relative to xanthine means that it remains in the catalytically relevant ionization state to a significantly greater degree at the higher pH. The kinetic parameters for the reductive half-reaction of xanthine oxidase with hypoxanthine agree well with the steady-state parameters, kred/Kd = 4.6 × 10⁶ m−1 s−1 at pH 8.5 at 25 °C.
Exhaustive Turnover with Hypoxanthine
Having demonstrated that 6,8-dihydroxypurine is indeed an effective substrate for xanthine oxidase, we next examined whether 6,8-dihydroxypurine was formed to any significant degree in the course of enzyme hydroxylation of hypoxanthine. To do so, we followed the exhaustive consumption of hypoxanthine by xanthine oxidase as a function of time, monitoring the reaction throughout the near-UV. Each spectrum obtained in the course of the reaction was subsequently deconvoluted in the 240–330-nm region using the known absorption spectra for hypoxanthine, xanthine, 6,8-dihydroxypurine, and uric acid to give the time-dependent concentrations of each species. The parent spectra for the pure compounds used in the deconvolution (for both pH 7.0 and 8.5) are shown in the supplemental materials.
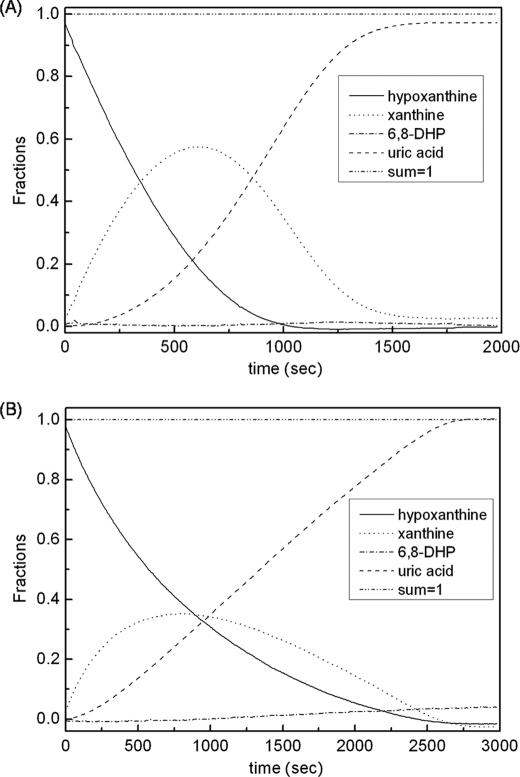
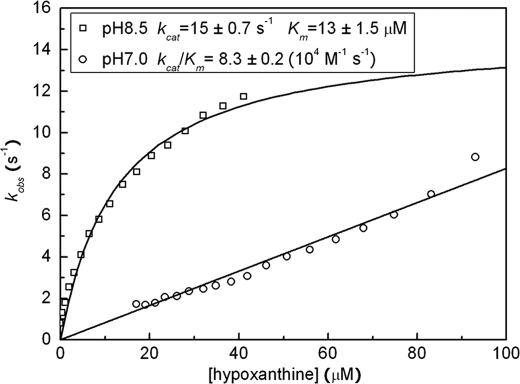
Fig. 7 shows the results for the reaction of 50 μm hypoxanthine with xanthine oxidase, at both pH 8.5 and 7.0. Plots of the rate of hypoxanthine consumption as a function of [hypoxanthine] at each pH, obtained as the first derivative of the plot of [hypoxanthine] versus time in Fig. 7, are shown in Fig. 8. Reactions with initial hypoxanthine concentrations of 10 or 100 μm yielded similar results. The kinetic parameters obtained are summarized in Table 2. At pH 8.5, the consumption rate of hypoxanthine from the spectral deconvolution can still be fit to a hyperbolic plot with a kcat for hypoxanthine of 15 ± 0.7 s−1, very close to kcat with hypoxanthine from the steady-state reaction above (16 ± 1.2 s−1). The results at pH 8.5 are quantitatively consistent with the steady-state results for both hypoxanthine and xanthine, particularly with regard to kcat. They also reflect the fact that xanthine accumulates in the course of the exhaustive reaction with hypoxanthine competing to some degree for enzyme (given the 2.8 times larger apparent Km for hypoxanthine obtained from the exhaustive reaction compared with Km from steady-state reaction). At pH 7.0, the plot of the consumption rate of hypoxanthine from the deconvolution is linear, giving an apparent value for kcat/Km of 8.3 × 10⁴ m−1 s−1 some 16 times smaller than the value of 1.3 × 10⁶ m−1 s−1 from the steady-state reaction. We attribute this to the much greater extent to which xanthine competes with hypoxanthine at pH 7.0 relative to pH 8.5 (Kmxanthine is 13 times smaller than Kmhypoxanthine at pH 7.0, but the Km values are comparable at pH 8.5). These results place on a more quantitative basis the earlier results of Jezewska (32), who also observed significant accumulation of xanthine in the course of enzyme action on hypoxanthine.
FIGURE 7.
Time courses for hypoxanthine, xanthine, uric acid, and 6,8-dihydroxypurine obtained from spectral deconvolution of the spectra observed in the course of enzyme action on a 50 μm solution of hypoxanthine. A, the time course as seen in 0.1 m pyrophosphate, 0.3 mm EDTA, pH 8.5. B, the time course as seen at 0.1 m phosphate, 0.3 mm EDTA, pH 7.0. The functional enzyme concentration was 6.7 nm at pH 8.5 and 6.8 nm at pH 7.0. The reaction conditions were 250 μm O2 at 25 °C.
FIGURE 8.
Plots of the hypoxanthine consumption rate from the spectral deconvolution of exhaustive-turnover reactions of xanthine oxidase with hypoxanthine. At pH 8.5, the kinetic parameters were obtained by fitting the data to a hyperbola plot. At pH 7.0, an apparent value for kcat/Km was obtained from a linear fit to the data. The initial concentration of hypoxanthine in the reaction was 50 μm at pH 8.5 and 100 μm at pH 7.0.
It is evident from the results shown in Fig. 7 that 6,8-dihydroxypurine does not accumulate to a detectable level in the course of enzyme action on hypoxanthine, implying that xanthine is the only intermediate formed during the conversion of hypoxanthine to uric acid, i.e. that hypoxanthine is hydroxylated exclusively at the C-2 position. Furthermore, that the accumulation of xanthine grossly exceeds the concentration of enzyme in the course of the experiment means that xanthine, once formed by hydroxylation of hypoxanthine, must dissociate from the active site before subsequently being hydroxylated on to uric acid. Were newly formed xanthine, with its C-2=O oriented toward the molybdenum center after the first hydroxylation, able to simply rotate in the active site to present its C-8 position to the molybdenum center for the second hydroxylation step, it would not accumulate to so great an extent. Although the active site of the enzyme is shaped such that in-plane rotation of newly formed xanthine between the two phenylalanines so as to position C-8 appropriately for hydroxylation is probably sterically allowed, doing so positions xanthine such that its C-6=O is oriented away from Arg880 rather than toward. We have previously argued that this is a catalytically less effective orientation, with neither Arg880 nor Glu802 positioned appropriately relative to the purine ring for optimal catalysis (12). The slower rate of reaction thus would allow dissociation of xanthine to a greater extent than would otherwise be the case, allowing it to accumulate in solution as is observed experimentally.
DISCUSSION
Proper substrate orientation is essential in enzyme catalysis so that active site residues can be aligned to most effectively lower the overall thermodynamic barrier to reaction. In the present work, the crystal structures of xanthine oxidase in complex with hypoxanthine and 6-mercaptopurine show that each substrate is able to assume two alternate orientations in the enzyme active site. In each case, the two orientations differ in that either the C-2 or C-8 position of substrate is oriented toward the molybdenum center of the enzyme, suggesting in the case of hypoxanthine that hydroxylation at C-8 prior to C-2 should be feasible. This observation runs counter to the literature, however, and with our own results here that although 6,8-dihydroxypurine is an effective substrate for xanthine oxidase, being converted by hydroxylated at the C-2 position to give uric acid at approximately half the overall catalytic rate that xanthine is hydroxylated at C-8 (also to generate uric acid), it is not a product of enzyme action on hypoxanthine.
It is thus evident that the crystallographically observed orientation for hypoxanthine with C-8 proximal to the molybdenum is not readily hydroxylated. There appear to be several reasons for this. First, superposition of the structures of the hypoxanthine complex with C-8 oriented toward the molybdenum center with that of enzyme complexed with xanthine (which may be taken as the template for a catalytically effective orientation) reveals some differences in the two substrate orientations (Fig. 9). With hypoxanthine, C-8 lies further below the base plane of the square-pyramidal molybdenum center (1 Å) than is seen with xanthine (0.4 Å), and this less than ideal orientation might compromise catalysis. The effect may be modest, however, and it is in any case clear that the active site residues known to be important in catalysis (including Glu802, Arg880, and Glu1261) occupy essentially identical positions in the hypoxanthine and xanthine complexes (Fig. 9).
FIGURE 9.
Superposition of the molybdenum active site structures of bovine Xanthine oxidase hypoxanthine complex and desulfo bovine XO-xanthine complex (Protein Data Bank code 3EUB from Ref. 9). A and B show one active site with C-8 of substrates toward molybdenum, whereas C and D show the other with C-2 toward molybdenum. B and D show ∼90° clockwise rotation about the vertical axis from A and C, respectively. Molybdenum is in teal, nitrogen is in blue, oxygen is in red, sulfur is in yellow, and phosphorus is in orange. Carbon is in white for hypoxanthine complex and green for xanthine complex. The superposition is performed by using PyMol (26).
A second factor likely contributing to greater reactivity of the C-2 position of hypoxanthine relative to its C-8 position may be less effective stabilization of the negative charge that accumulates on the heterocycle in the course of nucleophilic attack in the latter case. A kinetic study of xanthine oxidase with a series of substrates (10) showed that 2-thioxanthine is nearly as good a substrate as xanthine. Guanine, on the other hand, is essentially unreactive, and 2-chloroxanthine is also a poor substrate (kred = ∼0.12 s−1). Both xanthine and 2-thioxanthine have resonance structures with formal negative charge on the corresponding C-O− and C-S− groups, which would be expected to facilitate the transition state in the course of nucleophilic attack; 2-chloroxanthine and guanine are unable to form comparable tautomeric forms. In addition, a MOPAC calculation2 of the lowest unoccupied molecular orbital of C-2 substituted xanthine analogs showed that a C=O or C=S group at the C-2 position increases the orbital contribution of the C-6=O to the lowest unoccupied molecular orbital by 2–3-fold as compared with singly bonded substituents, irrespective of the electron-withdrawing properties of the latter. This is again due to the formation of C-6–O− and better stabilization of the negative charge accumulating during the transition state through the interaction with the positively charged Arg880.
A final reason why hypoxanthine is selectively hydroxylated at C-2 rather than C-8, however, likely has to do with the inherent electronic structure of the substrate. A MOPAC calculation of charge distribution for the predominant N-9–H tautomer of neutral hypoxanthine shows a partial charge of +0.232 on C-2 and −0.002 on C-8. Furthermore, the partial charges on the hydrogen atoms of C-2 and C-8 are +0.182 and +0.196, respectively. Both of these factors indicate that the C-2 position is more intrinsically susceptible to nucleophilic attack, and the C-2–H is more labile for hydride transfer. The different bond polarizations for C-2–H relative to C-8–H appear to be the principal contributing factor to the 6 kcal/mol lower bond dissociation energy calculated (again using MOPAC) for the C-2–H bond relative to the C-8–H bond of hypoxanthine (111.2 kcal/mol versus 116.6 kcal/mol, respectively). This corresponds to a 104-fold difference in reaction rate (assuming full bond cleavage in the transition state). The bond dissociation energy for the C-2–H of hypoxanthine is in fact comparable with that for the C-8–H of the predominant N-7–H tautomer of xanthine (113.8 kcal/mol), indicating that C-2 of hypoxanthine is comparably reactive as C-8 of xanthine.
Nishino and co-workers (33) have recently compared the effects of mutation of Glu803 and Arg881 of human xanthine oxidoreductase (equivalent to Glu802 and Glu880 for the bovine enzyme examined here) on the steady-state kinetics of both xanthine and hypoxanthine. With xanthine, the parameter kcat/Km (which tracks the reaction through the first irreversible step of the reaction, in this case the formation of the initial LMoIVO(SH)(OR) catalytic intermediate) decreases from 2.17 × 10⁶ to 1.80 × 10⁴ m−1 s−1 upon mutation of Glu803 to glutamine (21). A comparable effect is seen on the rapid reaction parameter kred/KDxanthine upon mutation of the equivalent Glu232 in the R. capsulatus xanthine dehydrogenase (9). Mutation of Arg881 to methionine reduces kcat to below the detectable limit in steady-state experiments (0.1–1% of the wild-type activity), indicating that kcat/Kmxanthine is affected by at least another order of magnitude greater than is seen with mutation of Glu803 and is no greater than 2 × 10³ m−1 s−1. The reverse is true with hypoxanthine: mutation of Arg881 to methionine reduces kcat/Kmhypoxanthine by 3 orders of magnitude (from 1.67 × 10⁷ to 1.56 × 10⁴ m−1 s−1), whereas mutation of Glu803 to glutamine yields no detectable activity (again, reflecting a reduction in kcat by at least another order of magnitude than is seen with the R881M mutant) and a value for kcat/Kmhypoxanthine no greater than 1 × 10³ m−1 s−1 (33).
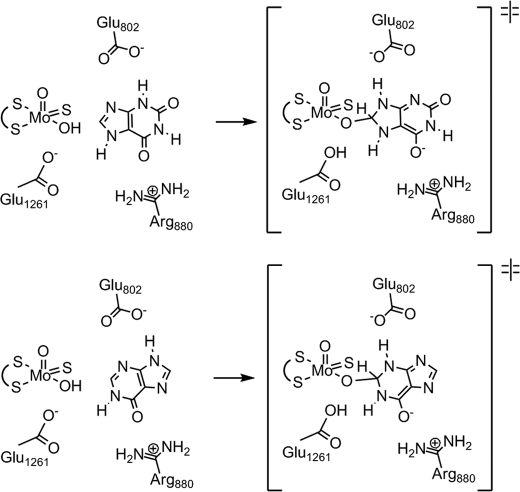
We have previously suggested (12) that Arg880/881 (Arg310 in the R. capsulatus enzyme) is involved in transition state stabilization by compensation of negative charge accumulation on the C-6=O oxygen of xanthine in the course of hydroxylation at C-8, and the orientation we see here indicates that this is also likely to be the case for hydroxylation of hypoxanthine at C-2, because the C-6 carbonyl is again oriented toward the arginine. Similarly, we have suggested (14, 34) that Glu802/803 (Glu232 in the R. capsulatus enzyme) is involved in proton tautomerization from N-3 to N-9 of xanthine in the course of hydroxylation at C-8, as shown in Fig. 10. Interestingly, whereas a MOPAC calculation confirms that the most stable tautomer of xanthine has N-7 rather than N-9 is protonated, the reverse is true for hypoxanthine.2 This being the case, we suggest that Glu802/803 plays a similar role in the hydroxylation of hypoxanthine, being positioned to facilitate a tautomerization involving proton transfer from N-9 to N-3 in the course of hydroxylation at C-2, as indicated in Fig. 10. The kinetic results indicate that negative charge stabilization by Arg880/881 is more important for hydroxylation of xanthine, whereas the tautomerization facilitated by Glu802/803 is more important for hydroxylation of hypoxanthine.
FIGURE 10.
Proposed role of Glu802/803 in facilitating tautomerization in the course of hydroxylating xanthine (top panel) and hypoxanthine (bottom panel). Glu1261 and Arg880 are also shown.
Supplementary Material
Acknowledgments
We thank Dr. Ting Wu (Department of Economics, The Ohio State University) for kindly developing the software code for the spectral deconvolution. We also thank Drs. Rob Hausinger and Scott Mulrooney (Department of Biochemistry and Molecular Biology, Michigan State University) and Dr. Claudio Scazzocchio (Institut de Génétique et de Microbiologie, Université Paris-Sud, France) for graciously providing 6,8-dihydroxypurine.
Footnotes
This work was supported in part by the United States Department of Energy, Office of Science, Office of Basic Energy Sciences Contract DE-AC02-06CH11357 and by Eli Lilly & Company.

The on-line version of this article (available at http://www.jbc.org) contains supplemental Figs. S1 and S2.
The atomic coordinates and structure factors (codes 3NRZ and 3NS1) have been deposited in the Protein Data Bank, Research Collaboratory for Structural Bioinformatics, Rutgers University, New Brunswick, NJ (http://www.rcsb.org/).
Calculation of energy, partial charge, and lowest unoccupied molecular orbital of neutral hypoxanthine and xanthine as well as C-2 derivatives of xanthine were performed using MOPAC 2009 software with PM6 semi-empirical Hamiltonians (35). For xanthine, calculations confirm that the N-7–H tautomer is more stable than that with N-9 protonated (by 6.0 kcal/mol), whereas for hypoxanthine the N-9–H form is favored over the N-7–H form by a more modest 1.3 kcal/mol, corresponding to an equilibrium constant of approximately 10 in favor of the N-9–H tautomer.
REFERENCES
- 1.Hille R. (1996) Chem. Rev. 96, 2757–2816 [DOI] [PubMed] [Google Scholar]
- 2.Hille R. (2002) Trends Biochem. Sci. 27, 360–367 [DOI] [PubMed] [Google Scholar]
- 3.Cultrone A., Scazzocchio C., Rochet M., Montero-Morán G., Drevet C., Fernández-Martín R. (2005) Mol. Microbiol. 57, 276–290 [DOI] [PubMed] [Google Scholar]
- 4.Montero-Morán G. M., Li M., Rendòn-Huerta E., Jourdan F., Lowe D. J., Stumpff-Kane A. W., Feig M., Scazzocchio C., Hausinger R. P. (2007) Biochemistry 46, 5293–5304 [DOI] [PMC free article] [PubMed] [Google Scholar]
- 5.de la Riva L., Badia J., Aguilar J., Bender R. A., Baldoma L. (2008) J. Bacteriol. 190, 7892–7903 [DOI] [PMC free article] [PubMed] [Google Scholar]
- 6.Pope S. D., Chen L. L., Stewart V. (2009) J. Bacteriol. 191, 1006–1017 [DOI] [PMC free article] [PubMed] [Google Scholar]
- 7.Hille R., Nishino T. (1995) FASEB J. 9, 995–1003 [PubMed] [Google Scholar]
- 8.Hille R. (2005) Arch. Biochem. Biophys. 433, 107–116 [DOI] [PubMed] [Google Scholar]
- 9.Leimkühler S., Stockert A. L., Igarashi K., Nishino T., Hille R. (2004) J. Biol. Chem. 279, 40437–40444 [DOI] [PubMed] [Google Scholar]
- 10.Stockert A. L., Shinde S. S., Anderson R. F., Hille R. (2002) J. Am. Chem. Soc. 124, 14554–14555 [DOI] [PubMed] [Google Scholar]
- 11.Enroth C., Eger B. T., Okamoto K., Nishino T., Nishino T., Pai E. F. (2000) Proc. Natl. Acad. Sci. U.S.A. 97, 10723–10728 [DOI] [PMC free article] [PubMed] [Google Scholar]
- 12.Pauff J. M., Hemann C. F., Jünemann N., Leimkühler S., Hille R. (2007) J. Biol. Chem. 282, 12785–12790 [DOI] [PubMed] [Google Scholar]
- 13.Pauff J. M., Zhang J., Bell C. E., Hille R. (2008) J. Biol. Chem. 283, 4818–4824 [DOI] [PubMed] [Google Scholar]
- 14.Pauff J. M., Cao H., Hille R. (2009) J. Biol. Chem. 284, 8760–8767 [DOI] [PMC free article] [PubMed] [Google Scholar]
- 15.Massey V., Brumby P. E., Komai H., Palmer G. (1969) J. Biol. Chem. 244, 1682–1691 [PubMed] [Google Scholar]
- 16.Edmondson D., Massey V., Palmer G., Beacham L. M., 3rd, Elion G. B. (1972) J. Biol. Chem. 247, 1597–1604 [PubMed] [Google Scholar]
- 17.Collaborative Computational Project, Number 4 (1994) Acta Crystallogr. D Biol. Crystallogr. 50, 760–76315299374 [Google Scholar]
- 18.Potterton E., Briggs P., Turkenburg M., Dodson E. J. (2003) Acta Crystallogr. D Biol. Crystallogr. 59, 1131–1137 [DOI] [PubMed] [Google Scholar]
- 19.Murshudov G., Vagin A., Dodson E. J. (1996) The Refinement of Protein Structures, pp. 93–104, Proceedings of Daresbury Study Weekend, Daresbury, UK [Google Scholar]
- 20.Murshudov G. N., Vagin A. A., Dodson E. J. (1997) Acta Crystallogr. D Biol. Crystallogr. 53, 240–255 [DOI] [PubMed] [Google Scholar]
- 21.Pannu N. S., Murshudov G. N., Dodson E. J., Read R. J. (1998) Acta Crystallogr. D Biol. Crystallogr. 54, 1285–1294 [DOI] [PubMed] [Google Scholar]
- 22.Murshudov G. N., Vagin A. A., Lebedev A., Wilson K. S., Dodson E. J. (1999) Acta Crystallogr. D Biol. Crystallogr. 55, 247–255 [DOI] [PubMed] [Google Scholar]
- 23.Winn M. D., Isupov M. N., Murshudov G. N. (2001) Acta Crystallogr. D Biol. Crystallogr. 57, 122–133 [DOI] [PubMed] [Google Scholar]
- 24.Schüttelkopf A. W., van Aalten D. M. (2004) Acta Crystallogr. D Biol. Crystallogr. 60, 1355–1363 [DOI] [PubMed] [Google Scholar]
- 25.Emsley P., Cowtan K. (2004) Acta Crystallogr. D Biol. Crystallogr. 60, 2126–2132 [DOI] [PubMed] [Google Scholar]
- 26.Deleted in proof
- 27.Dietzel U., Kuper J., Doebbler J. A., Schulte A., Truglio J. J., Leimkühler S., Kisker C. (2009) J. Biol. Chem. 284, 8768–8776 [DOI] [PMC free article] [PubMed] [Google Scholar]
- 28.Huber R., Hof P., Duarte R. O., Moura J. J., Moura I., Liu M. Y., LeGall J., Hille R., Archer M., Romão M. J. (1996) Proc. Natl. Acad. Sci. U.S.A. 93, 8846–8851 [DOI] [PMC free article] [PubMed] [Google Scholar]
- 29.Kim J. H., Ryan M. G., Knaut H., Hille R. (1996) J. Biol. Chem. 271, 6771–6780 [DOI] [PubMed] [Google Scholar]
- 30.Edmondson D., Ballou D., Van Heuvelen A., Palmer G., Massey V. (1973) J. Biol. Chem. 248, 6135–6144 [PubMed] [Google Scholar]
- 31.Kulikowska E., Kierdaszuk B., Shugar D. (2004) Acta Biochim. Pol. 51, 493–531 [PubMed] [Google Scholar]
- 32.Jezewska M. M. (1973) Eur. J. Biochem. 36, 385–390 [DOI] [PubMed] [Google Scholar]
- 33.Yamaguchi Y., Matsumura T., Ichida K., Okamoto K., Nishino T. (2007) J. Biochem. 141, 513–524 [DOI] [PubMed] [Google Scholar]
- 34.Ilich P., Hille R. (1997) Inorg. Chim. Acta 263, 87–94 [Google Scholar]
- 35.Stewart J. J. (2008) MOPAC2009, Stewart Computational Chemistry, Colorado Springs, CO [Google Scholar]
- 36.Laskowski R. A., MacArthur M. W., Moss D. S., Thornton J. M. (1993) J. Appl. Crystallogr. 26, 283–291 [Google Scholar]
Associated Data
This section collects any data citations, data availability statements, or supplementary materials included in this article.


