Abstract
Transmembrane stretch M2C from the bacterial K+-translocating protein KtrB is unusually long. In its middle part, termed M2C2, it contains several small and polar amino acids. This region is flanked by the two α-helices M2C1 and M2C3 and may form a flexible gate at the cytoplasmic side of the membrane controlling K+ translocation. In this study, we provide experimental evidence for this notion by using continuous wave and pulse EPR measurements of single and double spin-labeled cysteine variants of KtrB. Most of the spin-labeled residues in M2C2 were shown to be immobile, pointing to a compact structure. However, the high polarity revealed for the microenvironment of residue positions 317, 318, and 327 indicated the existence of a water-accessible cavity. Upon the addition of K+ ions, M2C2 residue Thr-318R1 (R1 indicates the bound spin label) moved with respect to M2B residue Asp-222R1 and M2C3 residue Val-331R1 but not with respect to M2C1 residue Met-311R1. Based on distances determined between spin-labeled residues of double-labeled variants of KtrB in the presence and absence of K+ ions, structural models of the open and closed conformations were developed.
Keywords: Electron Paramagnetic Resonance (EPR), Membrane Proteins, Membrane Reconstitution, Potassium Transport, Protein Motifs, Protein Structure
Introduction
Proteins of the superfamily of potassium transporters (termed SKT proteins) occur in all organisms except most animals and are involved in the uptake of K+ and in some cases Na+ by the cells (1–3). They are of high importance because the monovalent cations Na+ and K+ play a major role in pH homeostasis and osmoregulation of the cells (4–7). SKT proteins contain a 4-fold repeated M1PM2 domain, in which M1 and M2 represent transmembrane stretches and P represents a p-loop that folds back from the external medium to the middle of the membrane. They are believed to have evolved from simple KcsA-like potassium channels by multiple gene duplications and gene fusions (1, 8–10). The four domains M1APAM2A to M1DPDM2D are covalently linked via cytoplasmic loops to one subunit, which differs from the homotetrameric KcsA channel composed of four identical M1PM2 subunits. The four p-loops are supposed to form together the narrowest part of the K+ permeation pathway and function as a K+ selectivity filter (1–3, 11). In most SKT proteins, one conserved glycine residue within each p-loop is part of this filter (3, 12–15). Its composition is less complex than in potassium channels, where the filter is formed by the well conserved sequence TVGYG from each subunit (16). Sequence alignment studies have shown that major parts of the four M1PM2 domains of the different SKT proteins are similar to those of KcsA (11). However, in particular their transmembrane stretches M2C and M2D are different. These deviations in SKT proteins are thought to distinguish a cation transporter from a cation channel by either hindering the free diffusion of ions down their electrochemical gradient or by enabling the active transport of ions against this gradient. Positively charged residues in M2D of different SKT proteins have been shown to be essential for cation transport activity (17). Kato et al. (17) proposed that one or more salt bridges are formed between these residues and negatively charged residues in the pore region, which might reduce electrostatic repulsion during cation permeation and stabilize the transporter structure. Less is known about the function of the deviating region M2C. With about 30 residues, it is unusually long, and in the middle it contains a cluster of small and polar residues like alanine, glycine, serine, and threonine. This feature is conserved among the prokaryotic SKT protein families KtrB, TrkH, and KdpA (1, 2, 11). Only these three families require for activity at least one additional subunit, which leads to the hypothesis that an interaction of the additional subunit with the M2C region might control the transporter activity (11).
KtrAB is a sodium-dependent bacterial K+-uptake system with KtrB as the potassium-translocating subunit and KtrA as the regulatory subunit (3, 12, 18–21). KtrA is located on the cytoplasmic site of the membrane and is a member of the KTN/RCK protein family (4, 22). It is proposed to regulate K+ transport by binding of ATP (23, 24). It confers velocity, K+ selectivity, and Na+ dependence to the transporter (3). The SKT protein KtrB alone transports K+ slowly and independently of sodium ions. In addition, it transports Na+ with a relatively low affinity (3). The structure of KtrB has been modeled according to the crystal structure of KcsA (11). Most parts were comparable with KcsA but especially the C termini of M2C and M2D deviated. Cross-linking studies support the notion that the external half of KtrB is similar to that of KcsA but also show that its cytoplasmic half is different (25). A problem in the modeling of KtrB was the structure of transmembrane stretch M2C. Durell and Guy (11) divided this region into three parts, M2C1 to M2C3. Although M2C1 and M2C3 are likely to form α-helices, M2C2 with its above mentioned residues alanine, glycine, serine, and threonine may form a random coil or β-turn structure. The authors (11) proposed two possible models. In the first, M2C1 and M2C3 span the membrane as α-helices, and M2C2 forms a flexible linker inside the cavity just below the selectivity filter. In model 2, M2C1 and M2C2 span the membrane, with the latter in a coiled conformation, whereas according to its partial amphipathic character, M2C3 lies on the inner surface of the membrane. In both models, a salt bridge is proposed to be present between a highly conserved lysine residue in M2C2 (residue Lys-325 in VaKtrB)4 and a not universally conserved aspartate residue at the C terminus of M2B (residue Asp-222 in VaKtrB).
In a recent mutation study, we showed the functional importance of the M2C2 region from VaKtrB for the transport mechanism (26). Point and deletion mutations led to an increased K+ transport velocity, whereas the affinity was mostly unaffected. The presence of KtrA did not suppress this gain of function effect. Deletions in M2C2 diminished the binding of KtrA to KtrB, supporting the notion that this region is important for the interaction of the translocating subunit KtrB with the regulatory subunit KtrA. PhoA fusion studies showed that M2C2 possesses a flexible structure (26). Together, these results led us to propose that region M2C2 forms a flexible gate at the cytoplasmic side of KtrB controlling K+ translocation. In this study, we present evidence in support of this notion. We investigated K+-dependent dynamic and structural properties of the M2C region of VaKtrB by electron paramagnetic resonance (EPR), using the technique of site-directed spin labeling of single and double cysteine VaKtrB variants. The data allowed us to test and reject the two Durell and Guy (11) models. We propose two new models, one for the open state of KtrB in the presence of K+ ions and one for its closed state in the absence of K+. Both from EPR measurements and from K+ transport studies with VaKtrB variants in which residues Asp-222 and Lys-325 were replaced, we conclude that these two residues do not form a salt bridge.
EXPERIMENTAL PROCEDURES
Strains, Plasmids, and Growth Conditions
The strain and plasmids used in this study are listed in supplemental Table 1. Plasmids containing point mutations in VaktrB codons were generated from plasmid pEL903-100 by PCR using the QuikChange mutagenesis kit from Stratagene (La Jolla, CA). Cells of Escherichia coli LB2003 (27) containing plasmid pEL903-100 or its derivates were grown aerobically in medium K3 or K30 (3, 28) with 0.2% glycerol as a carbon source. The expression of ktrB was induced by the presence of 0.02% l-arabinose. The cells were harvested either in the late exponential growth phase (for protein purification) or at an OD578 of 0.8 (for transport assays).
Overproduction, Purification, and Spin Labeling of KtrB-His6 Variants
Cells of strain LB2003 containing plasmid pEL903 or one of its derivates were fermented in 30 liters of K3 or K30 (29) medium at 37 °C in the presence of 0.2% glycerol (v/v) and 0.02% l-arabinose (w/v) up to an OD578 of 1.0–1.5. The cells were broken, and the protein was solubilized with β-d-dodecylmaltoside (DDM) as described previously (26). The supernatant was incubated at a concentration of 150 mg of protein/ml of packed Ni2+-NTA-agarose (Qiagen, Hilden, Germany) in the presence of 10 mm imidazole in a 50-ml polypropylene column for 1 h. Subsequently, the agarose was washed with 30 volumes of buffer W, containing 200 mm NaCl, 20 mm Tris-Cl, pH 8, 5 mm β-mercaptoethanol, 10% glycerol (w/v), 0.04% DDM (w/v) plus 50 mm imidazole. To remove the β-mercaptoethanol, the agarose was washed with 15 volumes of degassed buffer W without β-mercaptoethanol plus 50 mm imidazole. The spin label (1-oxyl-2,2,5,5-tetramethlpyrroline-3-methyl)-methanethiosulfonate (TRC, Toronto, Canada), dissolved at a concentration of 1 mm in the same buffer, was added to the Ni2+-NTA bed in order to react overnight at 4 °C with the cysteine residues. Subsequently, free spin label was washed out with 30 volumes of buffer W without β-mercaptoethanol plus 50 mm imidazole. His-tagged, spin-labeled protein was eluted with 3 volumes of buffer W without β-mercaptoethanol containing 500 mm imidazole. The protein-containing samples were pooled and concentrated in a spin concentrator (Amicon Ultra-15, PLHK Ultracel-PL membrane, 100 kDa; Millipore, Billerica, MA) to 0.5 ml. The concentrates were further purified using size exclusion chromatography on a Superdex 200 10/300 column (flow rate 0.5 ml/min) in buffer W without β-mercaptoethanol. Small samples of the different fractions were diluted with an equal volume of twice concentrated sample buffer, containing 4% SDS (w/v), 12% glycerol (v/v), 50 mm Tris-Cl (pH 6,8), 2% β-mercaptoethanol (v/v), and 0.01% Serva Blue G (w/v). The proteins in these samples were separated by SDS-PAGE (29) and stained with Coomassie Brilliant Blue.
Reconstitution into Liposomes
For the reconstitution of purified, spin-labeled proteins, liposomes were prepared from acetone/ether-washed E. coli lipids (Avanti total lipid extract) and egg yolk l-α-phosphatidylcholine (Sigma) in a ratio of 3:1 (w/w) (30). Unilamellar, small vesicles with relatively homogenous size were prepared by suspending lipids at 20 mg/ml of 50 mm potassium-phosphate buffer, pH 7.0, and sonicating the suspension under a stream of nitrogen until transparency with a Branson 250 Sonifier II Cell Disruptor. The liposomes were then subjected to three cycles of freezing in liquid nitrogen, slow thawing at room temperature, and extrusion through a 400-nm polycarbonate filter (Avestin) (31). Subsequently, the liposomes were diluted with buffer W without DDM and β-mercaptoethanol to 4 mg/ml and titrated with Triton X-100 (Sigma) to a value just below “detergent saturation” point, as monitored by the turbidity of the suspension at 540 nm (32, 33). The detergent-destabilized liposomes were mixed with purified, spin-labeled protein in a 1:30 ratio (w/w) and incubated for 30 min at room temperature under gentle agitation. In order to remove the detergent, polystyrene beads (Biobeads SM2) were added at a wet weight of 40 mg/ml, and the sample was incubated for 15 min at room temperature. Fresh Biobeads SM2 (40 mg/ml) were added four times with incubations at 4 °C of 15 min, 30 min, overnight, and 1 h, respectively. The beads were removed, and the mixture was diluted at least 2.5-fold with the appropriate buffer in order to decrease the glycerol concentration below 4%. After collecting the proteoliposomes by ultracentrifugation, they were washed twice with the same buffer. Finally, the proteoliposomes were dissolved to 20 mg/ml and three times frozen and thawed before further use. For EPR measurements of single spin-labeled mutants, buffer W without β-mercaptoethanol, glycerol, and DDM was used. In order to determine distances between two spin-labeled residues by EPR, the proteoliposomes were dissolved in buffer containing 200 mm triethanolamine Hepes, pH 7.5. After the EPR spectrum was taken, 0.1 mm KCl was added to the samples directly before the second EPR measurement.
EPR Measurements
Room temperature continuous wave (cw) EPR spectra at X-band were recorded using a Magnettech Miniscope MS200 X-band (∼9.4 GHz) spectrometer equipped with a rectangular TE102 resonator. A sample volume of 10 μl was loaded into glass capillaries with a 0.9-mm inner diameter. The microwave power was set to 10 milliwatts, and the B-field modulation amplitude was adjusted to 0.15 mT in order to avoid saturation and to obtain high signal-to-noise ratio EPR spectra.
For interspin distance determination in the range of 1–2 nm, low temperature cw EPR spectra at X-band (∼9.4 GHz) and 160 K were recorded using a homemade EPR spectrometer equipped with a super high sensitivity probe head (Bruker). Temperature stabilization was achieved by a continuous flow helium cryostat (ESR 900, Oxford Instruments) in combination with a temperature controller (ITC 503S, Oxford Instruments). The microwave power was adjusted to 0.2 milliwatt, and the B-field modulation amplitude was adjusted to 0.25 mT, whereas the magnetic field was measured by a B-NM 12 B-field meter (Bruker). Sample volumes of 30–40 μl were loaded into EPR quartz capillaries for cw EPR measurements and frozen in liquid nitrogen before insertion into the resonator.
Pulse EPR experiments (DEER) were performed at X-band (∼9.4 GHz) and 50 K using a Bruker Elexsys 580 spectrometer in order to determine interspin distances in the range of 2–6 nm. The spectrometer was equipped with a 3-mm split ring resonator (ER 4118X-MS3, Bruker) and a continuous flow helium cryostat (ESR900, Oxford Instruments) controlled by a temperature controller (ITC 503S, Oxford Instruments). All measurements were performed using the four-pulse DEER sequence (34), π/2(υobs) - τ1 − π(υobs) − t′ − π (υpump) − (τ1 + τ2 − t′) − π(υobs) - τ2 − echo.
A two-step phase cycling (+〈x〉, −〈x〉) was performed on π/2(υobs), whereas for all pulses at the observer frequency, the 〈x〉 channels were applied. The dipolar evolution time is given by t = t′ − τ1, whereas time t′ is varied, and τ1 and τ2 are kept constant. Data were analyzed only for t > 0 with DeerAnalysis 2006 (35, 36). The resonator was overcoupled to Q ∼100; the pump frequency υpump was set to the center of the resonator dip, which coincided with the maximum of the nitroxide EPR spectrum. The observer frequency υobs was set to the low field local maximum of the absorption spectrum, which resulted in a 65 MHz offset. All experiments were realized with observer pulse lengths of 16 ns for π/2 and 32 ns for π pulses and a pump pulse length of 12 ns. Deuterium modulation was averaged by adding traces at eight different τ1 values, starting at τ1,0 = 200 ns and incrementing by Δτ1 = 8 ns. For all DEER measurements, 30–40 μl of the sample solution was filled into EPR quartz capillaries and frozen in liquid nitrogen before insertion into the resonator.
Analysis of Dipolar Broadened cw EPR Spectra
Analysis of dipolar broadened cw EPR spectra detected at low temperature reveals the average interspin distance in the range of 1–2 nm. For this purpose, simulated dipolar broadened EPR spectra were fitted to the experimental ones using the program DipFit (37), and best fit parameters for the interspin distance and distance distribution considering a Gaussian distribution of interspin distances were determined. During the fitting procedure, the g tensor values, the Axx and Ayy values of the hyperfine tensor, and the Lorentzian and Gaussian line width parameters were fixed. In detail, Axx and Ayy were set to 0.52 and 0.45 mT, respectively, and the g tensor values were set to gxx = 2.0085, gyy = 2.0063, gzz = 2.0023. The Azz value of the hyperfine tensor and the fraction of singly spin-labeled protein were variable. The EPR spectra were convoluted with a field-independent line shape function composed of a superposition of 28% Lorentzian and 72% Gaussian of 0.50 and 0.41 mT widths, respectively. The fraction of the singly spin-labeled component of the present samples was determined to be in the range of 30–50%.
Analysis of DEER Spectra
The analysis of the experimental DEER spectra yields information about interspin distances and distance distributions if the distances are in the range of 2–6 nm. Separation of the intermolecular background contribution from the intramolecular contribution elucidates interspin distances within one nanoscopic object. The experimental echo decay was background-corrected using a homogeneous three-dimensional spin distribution followed by normalization of the function. Interspin distances and distance distributions were derived by fitting the background-corrected dipolar evolution function using Tikhonov regularization as implemented in DEERAnalysis2006 (35, 36).
Rotamer Library Analysis
Interspin distances and distance distributions were simulated using a precalculated rotamer library based on spin-labeled residues as described before (38). The rotamer library comprises 98 rotamers of (1-oxyl-2,2,5,5-tetramethlpyrroline-3-methyl)-methanethiosulfonate bound to cysteine, which replace the individual native residues of interest. The energy and thereby the population for each of the rotamers was calculated in consideration of a Lennard-Jones potential at 175 K, which is equivalent to the glass transition temperature for a water-glycerol mixture. The glass transition temperature most likely reflects the ensemble of spin label conformations obtained at 50 K. Finally, the populations for the respective rotamer were then used as weights in the simulation of the interspin distance and distance distribution.
86Rb Uptake into Proteoliposomes
The uptake of 86Rb+ by proteoliposomes was determined in principle as described (39, 40). Briefly, proteoliposomes preloaded with loading buffer (400 mm KCl, 10 mm Hepes, and 5 mm N-methyl-d-glucamine, pH 7.6) were extruded through a 400-nm polycarbonate filter (Avestin) and diluted with the same buffer to 10 mg/ml. Subsequently, the extraproteosomal buffer was exchanged against uptake buffer containing 400 mm sorbitol, 10 mm Hepes, and 5 mm N-methyl-d-glucamine, pH 7.6, by spinning 80 μl of the proteoliposomes through a spin desalting column preincubated with uptake buffer (Zeba Spin Desalting Columns, molecular weight cut-off 7000, 0.5 ml; Pierce). Directly afterward, 50 μl of the suspension were diluted with 150 μl of uptake buffer and preincubated for 5 min at room temperature. Uptake was started by the addition of 2.3 μCi/ml 86Rb+ (PerkinElmer Life Sciences). Samples were taken at different time points by diluting 40 μl of the suspension with 2 ml of an ice-cold 0.1 m LiCl solution and immediate filtering through a 200-nm cellulose nitrate filter (Millipore). The filter was washed twice with 2 ml of ice-cold 0.1 m LiCl and put into 3 ml of liquid scintillation fluid in a 5-ml counting vial. Radioactivity was determined in a liquid scintillation counter. In parallel, the proteoliposomes remaining after the external buffer exchange step were used to determine the maximally possible 86Rb+ uptake (100% value). To this end, 16 μm valinomycin was added to the suspension, and 86Rb+ uptake was determined as described above. In addition, uptake experiments were performed with equally treated liposomes without KtrB protein as a negative control.
Other Methods
Protein concentrations were determined according to Ref. 41 or by measuring the A280 and by using the KtrB-specific molar extinction coefficient ϵ calculated from its amino acid composition. A cell suspension with an OD578 value of 1.0 was taken to contain 0.3 mg, dry weight/ml (42). Depletion of the cells from K+ and net K+ uptake by K+-depleted LB2003 cells were carried out as described in (3). The kinetics of K+ uptake were determined by the Eadie-Hofstee method (43).
RESULTS
Sample Preparation and Purification of KtrB-His6 Variants to Perform EPR Measurements
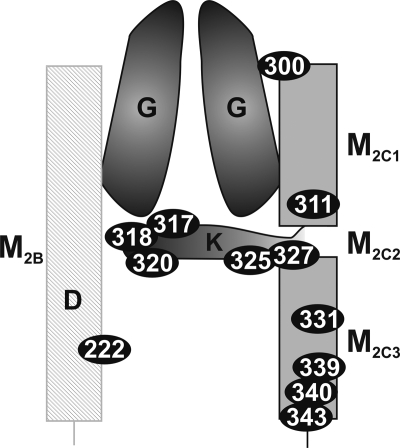
From our previous studies, we concluded that region M2C2 with its small and polar amino acids is involved in the K+ transport process by forming a gate inside the pore region of KtrB controlling the passage of K+ through the protein. In order to obtain more information about the structure of the M2C2 region, we inserted single cysteine residues into Cys-less VaKtrB-His6. These variants were overproduced in an active form in E. coli LB2003 by growing the cells at low K+ concentrations (26). Subsequently, cw EPR measurements on purified, spin-labeled, and reconstituted KtrB variants were conducted. The activity of the unlabeled variants was analyzed in whole cell transport experiments by measuring net K+ uptake by K+-depleted LB2003 cells. Most of these variants were analyzed in the previous study, where several were found to be inactive or their overproduction was strongly inhibited (i.e. KtrBG314C, KtrBG316C, KtrBG321C, KtrBG322C, KtrBG323C, and KtrBK325C (26)). Other variants like KtrBA315C, KtrBI324C, and KtrBV326C aggregated during overproduction or purification (data not shown). Thus, only a few amino acid residues mutated to cysteines remained for the analysis of region M2C2 (i.e. S317C, T318C, T320C, K325C, and S327C). In addition, we examined the following variants with single cysteine exchanges: D222C (which forms presumably a salt bridge with residue Lys-325); Cys-90 (the natural single residue in VaKtrB); T300C (presumably at the N terminus of M2C); M211C (an M2C1 residue); V331C, F339C, and L340C (all M2C3 residues); and R343C (presumably at the C terminus of M2C). Finally, we constructed double cysteine variants in order to measure distances between the two spin-labeled residues (i.e. D222C/T318C, D222C/S327C, M311C/T318C, T318C/V331C, and T327C/V331C). A schematic illustration of the regions M2B and M2C with the spin-labeled positions is represented in Fig. 1. The K+ uptake activity of most of these variants was examined in E. coli LB2003 as described (3). The results exhibited equal affinities and similar or slightly increased Vmax values compared with His-tagged KtrB or its Cys-less KtrB derivative (26) (data not shown).
FIGURE 1.
Schematic representation of the regions M2B and M2C with spin-labeled positions. A schematic illustration of how the residues could be located in the protein is depicted. Spin-labeled positions are highlighted by the KtrB residue numbers within black ellipses.
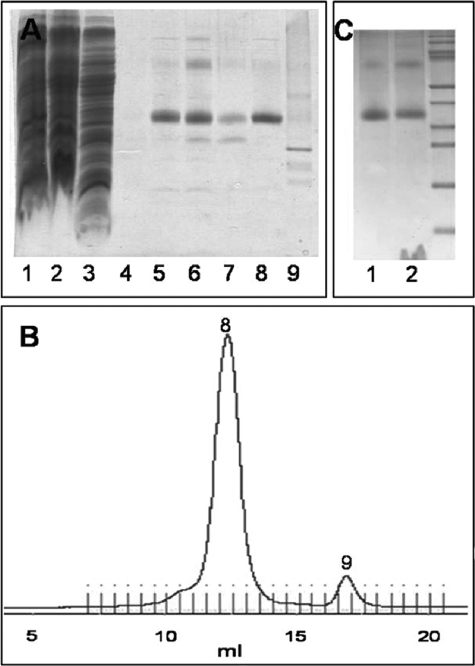
The SDS-PAGE of Fig. 2A documents exemplarily the solubilization and purification of KtrBT318C. Proteins were solubilized effectively from the cytoplasmic membrane with 1% (w/v) of the detergent DDM (Fig. 2A, lanes 1 and 2). From the Ni2+-NTA affinity chromatography with its washing and labeling steps (Fig. 1A, lane 4), a relatively pure KtrBThr-318R1-His6 preparation resulted (Fig. 2A, lanes 5–7) (R1 indicates the bound spin label). The protein was further purified by gel filtration on a Superdex 200 10/300 column, which resulted in the separation of the KtrB variant protein from its degradation products (Fig. 2A, lanes 8 and 9, and Fig. 2B, numbers 8 and 9, respectively). Subsequently, spin-labeled KtrBThr-318R1-His6 was reconstituted in a 1:30 protein/lipid ratio into liposomes with an efficiency of ∼80% (Fig. 2C). The proteoliposomes were washed and dissolved in the desired buffer.
FIGURE 2.
Purification and reconstitution of spin-labeled KtrBThr-318R1-His6. A, SDS-PAGE during solubilization and purification. Lane 1, membrane fraction; lane 2, supernatant after solubilization of the membrane fraction; lane 3, flow-through of the Ni2+-NTA column after 1 h of binding the solubilisate to it; lane 4, flow-through after spin label binding to the protein on the column and extensive washing with buffer W with 50 mm imidazole without β-mercaptoethanol; lanes 5–7, elution fractions E1–E3 of the spin-labeled protein from the Ni2+-NTA column with buffer W with 500 mm imidazole without β-mercaptoethanol; lane 8, spin-labeled KtrBThr-318R1-His6 eluted at 12.5 ml via gel filtration in buffer W without imidazole and β-mercaptoethanol; lane 9, degradation product of KtrB separated via gel filtration at 17.5 ml. 10 μl of a sample were added per lane. B, chromatogram giving A280 against the volume (in ml) of the gel filtration of the spin-labeled KtrBThr-318R1-His6 variant in buffer W without β-mercaptoethanol on a Superdex 200 column. Numbers 8 and 9 correspond to the fractions analyzed in lanes 8 and 9 of A, respectively. C, SDS-PAGE of the reconstitution of spin-labeled KtrB variants. Lane 1, 5 μg of solubilized protein; lane 2, the theoretically equivalent amount of KtrB after reconstitution in liposomes from E. coli phospholipids and egg l-α-phosphatidylcholine.
Spin Labels Do Not Affect the Uptake Activity of KtrB Variants
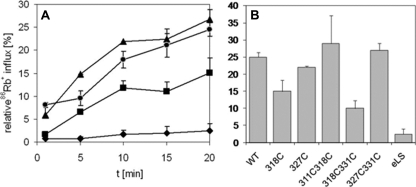
The influx of 86Rb+ into K+-loaded proteoliposomes was measured exemplarily for some mutants in an assay similar to that described (39, 40) in order to show that spin-labeled, reconstituted KtrB-His6 variants were active in this system. Reconstituted KtrB-His6 served as positive control. The relatively slow 86Rb+ uptake observed for this construct was in accordance with the findings of Albright et al. (25). Within 20 min, 25% of the maximum uptake was achieved (Fig. 3B). Fig. 3A shows time courses of normalized 86Rb+ uptakes into some KtrB variants containing proteoliposomes. Although the control liposomes were almost inactive (Fig. 3A, diamonds), the activity of KtrBSer-327R1/Val-331R1-containing proteoliposomes was similar to that of the WT-KtrB-containing liposomes (Fig. 3A, triangles and circles, respectively). The activity of KtrBThr-318R1 was a factor of 1.5 lower than that of wild type (Fig. 3A, squares and circles, respectively) but was still significantly higher than the activity of liposomes. As shown in Fig. 3B, influx through KtrBSer-327R1 and KtrBMet-311R1/Thr-318R1 was also comparable with that of the WT-KtrB, whereas uptake through KtrBThr-318R1/Val-331R1 was reduced by 50%. We conclude that the spin-labeled variants are active and that the presence of the label neither inhibits nor activates 86Rb+ uptake via KtrB in proteoliposomes.
FIGURE 3.
86Rb+ uptake by proteoliposomes containing spin-labeled KtrB-His6 variants. A, time dependence of normalized rubidium uptake of WT-KtrB-containing proteoliposomes (●), KtrBSer-327R1/Val-331R1-containing proteoliposomes (▲), KtrBThr-318R1-containing proteoliposomes (■), and control liposomes without protein prepared according to the same procedure as proteoliposomes (♦). B, normalized rubidium uptake after 20 min by proteoliposomes containing spin-labeled KtrB variants. Error bars, S.D. values calculated from two independent measurements. Uptakes were normalized against the uptake measured after the addition of 16 μm valinomycin to the same proteoliposome preparation. eLS, control liposomes.
Analysis of Side Chain Mobility and Environmental Polarity in the Membrane Region M2C
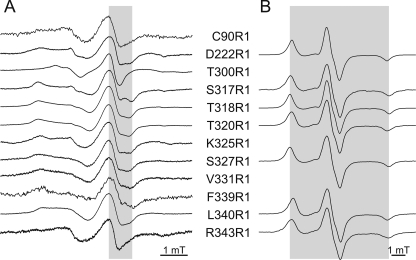
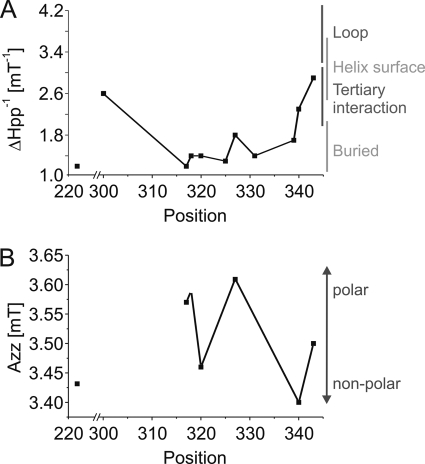
In order to obtain information about the orientation of single labeled cysteine residues, room temperature EPR spectra were recorded for the reconstituted samples. The inverse central line width [ΔHPP−1] is an indicator for the structural environment of the spin label. The higher this value, the higher is the mobility of the spin label side chain and the less probable are secondary and tertiary interactions. Almost all of the spectra (Fig. 4A) are dominated by an immobile component. Only residues Cys-90R1, Thr-300R1, and Arg-343R1 exhibit spectra where the mobile component prevails. The ΔHPP−1 values plotted according to Refs. 44 and 45 show (Fig. 5A) that the whole M2C region is imbedded inside a compact structure. The two-component spectrum revealed for Lys-325R1, however, points to flexibility of the region because a heterogeneous distribution of secondary or tertiary interactions of this residue must have been present. Residues Thr-300R1 and Arg-343R1 seem to come off of the membrane, confirming that they are N- and C-terminal to the M2C-transmembrane stretch, respectively.
FIGURE 4.
Continuous wave EPR spectra of single labeled reconstituted KtrB variants at room and low temperature (160 K). A, low and center field resonance peaks of EPR spectra of the spin-labeled variants recorded at room temperature. In order to allow comparison of the line widths of the center lines, ΔHPP, the value for Ser-317R1 is highlighted in gray. B, experimental EPR spectra recorded at low temperature. The gray area corresponds to the 2AZZ value of the hyperfine tensor for spin-labeled KtrB variant Ser-327R1.
FIGURE 5.
Inverse central line width ΔHPP−1 (A) and Azz values (B) of the hyperfine tensor of single labeled reconstituted KtrB variants. These values are plotted versus the VaKtrB residue number. ΔHPP−1 values were determined according to Mchaourab et al. (44) and Hubbel et al. (45). They demonstrate the mobility and orientation of the spin-labeled residues. Azz values give a measure of the polarity of the microenvironment of the labeled residues.
Preparations with sufficient spin-labeled KtrB were frozen and measured at 160 K to obtain the powder spectra of the corresponding samples. The hyperfine splitting values, Azz, derived from these spectra provide information about the polarity of the microenvironment of these residues. As determined for transmembrane helix F of bacteriorhodopsin, an Azz value of 3.7 mT indicates a high polarity as found in the aqueous phase outside the membrane, whereas a value of 3.35 mT argues for a low polarity corresponding to a location of the spin label side chain close to the middle of a lipid bilayer (46).
The spectra detected for the spin-labeled KtrB variants are shown in Fig. 4B, and a plot of the derived Azz values against their position is shown in Fig. 5B. The Azz values vary from 3.4 mT for residue Leu-340R1 to 3.61 mT for residue Val-327R1. In the proposed two- and three-dimensional model of VaKtrB (see Fig. 8, models 3 and 4), Val-327 is located in the middle of the membrane, whereas Leu-340 is close to the cytoplasmic surface. Because region M2C is proposed to be part of the permeation pathway, its polarity profile does not follow the profile of a transmembrane helix as for helix F of bacteriorhodopsin. The cavity of the protein should be filled with water, allowing higher environmental polarities of residues orientated to the central pore. From the detected Azz values, we conclude that residues Ser-317R1, Thr-318R1, and Val-327R1 are oriented to the cavity and are accessible to water molecules, whereas residues Asp-222R1, Thr-320R1, and Leu-340R1 sense a relative nonpolar environment and are buried either within the protein or within the membrane phospholipids. Residue Lys-343R1 displays an intermediate value of 3.5 mT and appears to be located close to the water-membrane interface. A schematic illustration of how the residues could be located within the protein is shown in Fig. 1. Exemplary measurements of singly labeled variants in the absence of both K+ and Na+ by using triethanolamine Hepes, pH 7.5, did not show remarkable changes in their mobilities or their polarities (data not shown).
FIGURE 8.
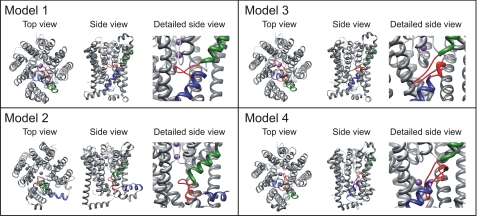
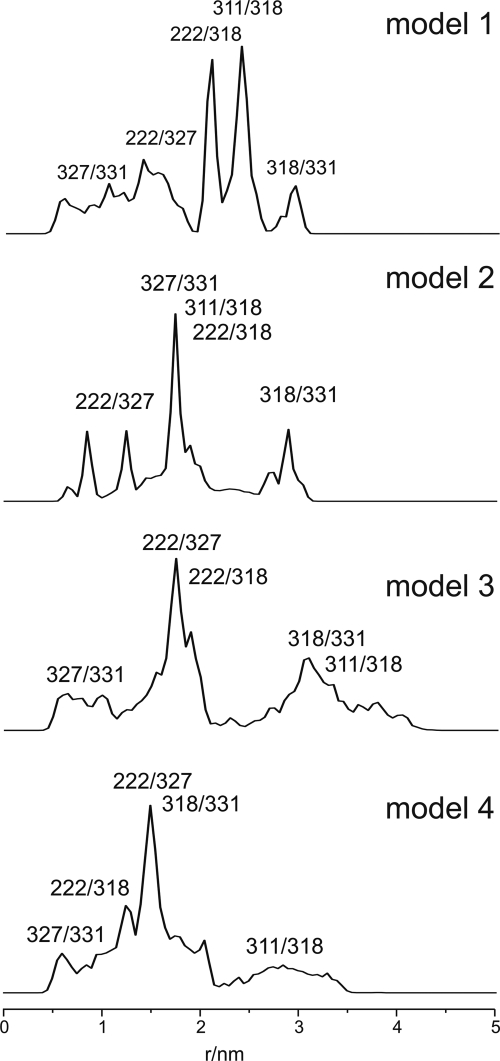
Schematic representation of different KtrB models. Models 1 and 2 are taken from Ref. 11. In model 1, m2C1 and M2C3 span the membrane together, and M2C2 forms a loop inside the protein. In model 2, m2C1 and M2C2 span the membrane, and M2C3 lies as an α-helix on the cytoplasmic surface of the membrane. Models 3 (closed structure) and 4 (open structure) are based on model 1, taking into account the measured distances between double spin-labeled residues in the presence and absence of K+ ions, respectively (Table 1). Regions M2C1 and M2C3 are highlighted in green and blue, respectively, the linker region M2C2 in red, and two potassium ions in purple. The top view is taken from the periplasm. In the side views, the top and bottom represent the periplasm and cytoplasm, respectively. For the detailed side view of M2C, residues 216–244 of regions M2B to M1C are removed.
Distances between Spin-labeled Double Cysteine Variants Reveal a K+-dependent Motion of M2C2 Residue Thr-318R1
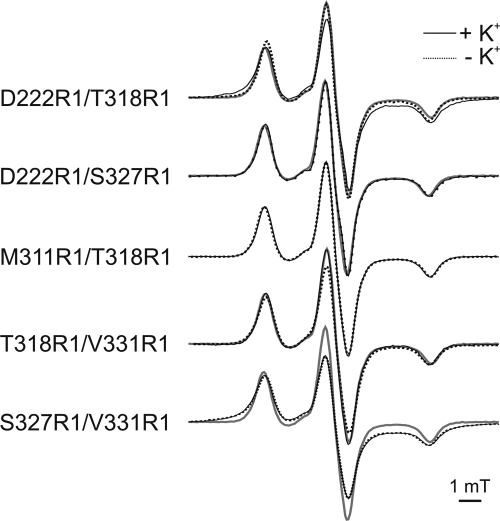
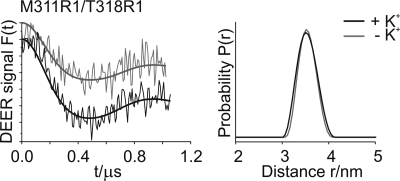
In order to reveal the structure and the movement of the subregion M2C2 upon the addition of potassium ions, interspin distances within double labeled variant molecules were obtained by using cw and pulse EPR spectroscopy at 160 and 50 K, respectively. For this purpose, low temperature experiments were taken in the absence and in the presence of K+ ions, as depicted in Figs. 6 and 7. Mean distances of the experimentally determined EPR spectra are given in Table 1. For double mutant Asp-222R1/Thr-318R1, the interspin distance decreased from 1.8 ± 0.1 to 1.4 ± 0.1 nm upon the addition of K+. The data for Thr-318R1/Val-331R1 revealed a mean distance of 1.5 ± 0.1 nm, which shifted to 1.7 ± 0.1 nm upon K+ activation. The interspin distances between Asp-222R1 and Ser-327R1 in the absence and presence of K+ were above 1.8 nm, which is equivalent to the upper limit for a precise determination of interspin distances using cw EPR spectroscopy. Due to the poor signal-to-noise ratio, a pulse EPR experiment could not be realized, and therefore potential changes in the interspin distance could not be resolved. In contrast, using pulse EPR spectroscopy, the experimentally derived interspin distances for the KtrB variant Met-311R1/Thr-318R1 exhibited distance distributions with one well defined peak centered at 3.5 ± 0.2 nm both in the presence and the absence of K+. The distance distributions in presence and absence of K+ were also identical for Ser-327R1/Val-331R1, exhibiting a mean distance of 1.1 ± 0.1 nm. We conclude that the addition of K+ causes a movement of M2C2 residue Thr-318R1 with respect to both membrane stretch M2B residue Asp-222R1 and M2C3 residue Val-331R1 but not with respect to the unexpectedly remote M2C1 residue Met-311R1. Distance changes could not be detected between residues Ser-327R1 and Val-331R1.
FIGURE 6.
Low temperature (160 K) cw EPR spectra of double labeled reconstituted KtrB variants in the absence and in the presence of K+. Comparison of the observed EPR spectra in the presence (solid black lines) and in the absence of K+ (dotted gray lines), respectively. The EPR spectrum of Met-311R1/Thr-318R1 is represented by a solid gray line in comparison with each double mutant to visualize dipolar broadening. All spectra are spin-normalized.
FIGURE 7.
DEER analysis of the double mutant Met-311R1/Thr-318R1 in the absence and in the presence of K+. Left, background-corrected dipolar evolution data F(t) in the presence (black lines) and in the absence of K+ (gray lines), respectively. Tick marks are separated by 0.01. Right, distance distributions P(r) obtained by Tikhonov regularization (DeerAnalysis2006) (36). Distance distributions are normalized by amplitude.
TABLE 1.
Experimental and calculated interspin distances
Experimental interspin distances in the absence and in the presence of potassium were derived using DEERAnalysis2006 (36) and DipFit (37). Interspin distances of different KtrB models were calculated using the rotamer library approach (38). Models 3 and 4 are based on model 1 (see Fig. 8), taking into account the distances of columns 2 and 3, respectively.
| Experimental interspin distance r |
Calculated interspin distance r |
|||||
|---|---|---|---|---|---|---|
| −K+ | +K+ | Model 1 | Model 2 | Model 3 | Model 4 | |
| nm | nm | |||||
| Asp-222R1/Thr-318R1 | ≥1.8a | 1.4 ± 0.1 | 2.1 and 2.4 | 1.9 | 1.8 | 1.5 |
| Asp-222R1/Ser-327R1 | >1.8 | >1.8 | 1.5 | 0.9 and 1.25 | 1.7 | 1.5 and 2.0 |
| Met-311R1/Thr-318R1 | 3.5 ± 0.2 | 3.5 ± 0.2 | 2.3 | 2.0 | 2.9 and 3.7 | 3.0 |
| Thr-318R1/Val-331R1 | 1.5 ± 0.1 | 1.7 ± 0.2 | 2.4 and 2.9 | 2.9 | 3.2 | 1.7 |
| Ser-327R1/Val-331R1 | 1.1 ± 0.1 | 1.1 ± 0.1 | 0.8 | 1.8 | 1.0 | 0.6 and 1.0 |
a The fraction of the singly spin-labeled component is in the range of 30–50%.
Rotamer Library Analysis for Different KtrB Models
In order to compare the distance distributions obtained by cw and pulse EPR spectroscopy with structural models of KtrB, we performed a rotamer library analysis for positions Asp-222, Met-311, Thr-318, Ser-327, and Val-331 based on the two structure models from Durell and Guy (11) (Fig. 8, model 1 and 2, respectively). Fig. 9 shows distance distributions derived from the rotamer library analysis. The mean interspin distances expected on the basis of these two models are compared with the experimental values in Table 1. It is evident that both models are not well supported by the experimental data. For model 1, the interspin distances between the chosen positions differ by about 0.3–1.2 nm from the data of Table 1. For model 2, the distance between Asp-222R1 and Thr-318R1 agrees with the experimental data in the absence of K+, but the other distances are off by 0.6–1.5 nm. In view of these discrepancies, we developed two new models for the structure of KtrB, taking into account both the polarity data of single residues (Figs. 4 and 5) and the interspin distance data (Table 1). As in model 1, we assumed that region M2C2 forms a flexible loop inside the protein. For molecular modeling, we fixed the residual molecular structure of model 1 except for that of M2C2. Using Yasara dynamics (47), the flexible loop M2C2 was adapted in such a way that the modeled interspin distances are in accordance with the experimentally determined ones, resulting in two molecular models that represent the closed state of KtrB in the absence of K+ ions (Fig. 8, model 3) and the open state in presence of K+ ions (Fig. 8, model 4). In model 3, m2C2 spans and thereby blocks the cavity and points toward helices M1B and M2B. With one exception, the modeled interspin distances and the experimental data agree within the limits of 0.1–0.6 nm. The corresponding distance values for Thr-318R1/Val-331R1 deviate by 1.7 ± 0.1 nm (Table 1). An additional displacement of helix M2B would be required to allow a closer approach of residues Thr-318 and Val-331. Model 4 represents the structure with an open M2C2 gate based on the distance values in the presence of K+ ions. In this model, the region M2C2 is oriented alongside the cavity. The calculated distances in this model for the double labeled variants reproduce the obtained experimental data within 0.1–0.5 nm (Table 1). We conclude that during the transport cycle, K+ causes a downward movement of the linker region M2C2 alongside the cavity, thereby opening its gate.
FIGURE 9.
Simulated interspin distance distributions of different KtrB models using the rotamer library approach (38). Residue numbers indicate the spin label pair that contributes to the calculated distance distribution. See Table 1 for the measured distances. Models 1–4 are described under “Results, rotamer library analysis for different K to B models” and in the legend to Fig. 8.
No Salt Bridge Is Formed between Residues Asp222 and Lys325
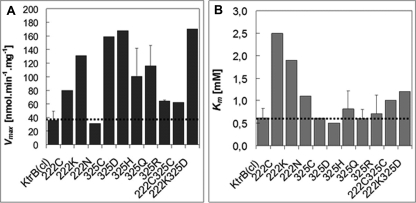
Durell and Guy (11) proposed for both structural models of KtrB the formation of a salt bridge between a lysine residue in M2C3 and an aspartate residue at the N terminus of M2B, corresponding to the VaKtrB residues Lys-325 and Asp-222, respectively. The large distance of more than 1.8 nm both in the presence and absence of K+ between Asp-222R1 and Val-327R1, which is located 2 residues C-terminal to Lys-325 (Table 1), suggests that salt bridge formation between residues Lys-325 and Asp-222 is unlikely. In order to test the salt bridge hypothesis, residues Asp-222 and Lys-325 were changed to neutral, equally charged, or pairwise to oppositely charged amino acids, and net K+ uptake via these KtrB variants into LB2003 cells was determined. A neutral amino acid at one of the two positions would avoid the formation of the putative salt bridge and could result in an increased transport activity. In contrast, an exchange of the charged amino acids against each other or the replacement of one amino acid with an equally charged amino acid should enable the formation of the salt bridge and would not affect KtrB activity. As shown in Fig. 10A, Vmax values of the single amino acid variants KtrBD222C, KtrBD222K, KtrBK325C, KtrBK325D, KtrBK325H, and KtrBK325Q were increased. Also, the double mutant KtrBD222C/K325C and the exchange mutant KtrBD222K/K325D transported K+ significantly faster than did WT-KtrB. However, variants KtrBK325R and especially KtrBD222N showed transport activities similar to that of the wild type. In addition, for variants KtrBD222C and KtrBD222K, the affinity for potassium was decreased (Fig. 10B). Because on the one hand the uptake velocity of the exchange variant KtrBD222K/K325D was increased and on the other hand the mutation from the negatively charged aspartate to the neutral asparagine at position 222 had no effect, the presence of the salt bridge between VaKtrB residues Asp-222 and Lys-325 can be excluded.
FIGURE 10.
Kinetic parameters of K+ uptake by cells containing KtrB variants with single or double amino acid changes in the putative salt bridge residues Asp222 and Lys325. Plasmid-containing cells of strain LB2003 were grown and induced for ktrB expression with 0.02% l-arabinose as described under “Experimental Procedures.” For the K+ uptake experiment, K+-depleted cells were suspended at 1 mg dry weight/ml of medium containing 200 mm NaHepes, pH 7.5, 0.2% glycerol, and 0.02% l-arabinose. The suspension was shaken at room temperature. After 10 min, KCl was added at following concentrations: 0.5, 1, 2, and 5 mm. For each data point, a 1.0-ml sample was taken from the suspension, and its cell K+ content was determined by flame photometry. Vmax (A) and Km (B) were determined by the Eadie-Hofstee method. Error bars, S.D.
DISCUSSION
In a recent publication (26), we have shown that subregion M2C2 of the potassium-translocating subunit KtrB is of a flexible nature. Point and deletion mutations in this region caused a gain of function due to a 10-fold increase of Vmax for K+ transport. These findings led us to the hypothesis that M2C2 might form a gate at the cytoplasmic side of KtrB controlling K+ translocation. However, we could not distinguish between the two models proposed by Durell and Guy (11) (Fig. 8, models 1 and 2, respectively). In order to gain more information about the structure and the dynamics of the M2C2 region, we performed EPR measurements in the presence and absence of K+ ions. In these studies, we focused on residue Thr-318, because it is the only M2C2 residue for which a change to cysteine did not affect the kinetics of K+ transport (26). Depending on the presence or absence of K+, residue Thr-318R1 moved with respect to residues in both regions, M2B and M2C3, but not with respect to residue Met-311R1 in helix M2C1, confirming that region M2C2 is flexible and that it may move during the K+ transport cycle. According to the interspin distance values obtained (Table 1), we had to conclude that both models proposed by Durell and Guy (11) have to be modified. These models are based on the structure of the KcsA channel tetramer (9, 11). Cross-linking studies of Albright et al. (25) have shown that the cytoplasmic half of KtrB differs from that of KcsA in the channel structure. They proposed several arrangements of the inner helices, leading to an expansion of the cytoplasmic part of the K+ permeation pathway in KtrB. In addition, the proposed salt bridge (11) was foreclosed by both EPR data and transport studies with changes in the involved amino acids. This result was not unexpected, because in contrast to the lysine residue (Lys-325 in VaKtrB), its putative salt bridge partner (Asp-222 in VaKtrB) is not conserved as a negative residue in all KtrB proteins.
Nevertheless, the analysis of the mobility and especially of the environmental polarity of single labeled residues as well as the above mentioned K+-dependent movement of residue Thr-318R1 argue in favor of the presence of a flexible linker inside the cavity of the protein as proposed in the Durell and Guy model 1 (11). The M2C2 region of KtrB appears to be encircled by a compact structure because the spin label mobility is restricted. The high polarities of the microenvironment of Ser-317R1, Thr-318R1, and Ser-327R1 show that parts of M2C2 are accessible for water. These data suggest that this linker lies in the cavity of the potassium permeation pathway (cf. Figs. 1 and 5). Hence, we regarded model 1 as a starting point and modeled structures for a closed and an open conformation of KtrB (Fig. 8, models 3 and 4, respectively). In model 3, which represents the KtrB conformation in absence of K+, M2C2 blocks the cavity. The interspin distances within this model agree reasonably well with the experimental data with the exception of the distance for Thr-318R1/Val-331R1. A displacement of M2B is required to enable a closer approach of these two residues. Model 4 represents the open conformation in the presence of K+. M2C2 is oriented alongside the cavity toward the cytoplasm, and all modeled interspin distances agree with the experiment. Based on our data, we cannot exclude additional rearrangements in KtrB during the K+ transport cycle. In KcsA, the bundle of M2 helices moves considerably during the transition from the closed to the open state of the channel (48, 49), and it may be that such changes also occur in KtrB during the K+ transport cycle. Further site-directed spin labeling EPR experiments on other parts of the proposed K+-permeation pathway will unravel additional structural features of KtrB in the dependence of K+ ions, thereby helping us to improve the existing KtrB models.
This study provides experimental evidence that M2C2 may form a gate for K+ permeation at the cytoplasmic side of KtrB (26). This feature distinguishes KtrB from a K+ channel and is supposed to be transporter-specific. Deletion of M2C2 increases both the Vmax and the Km values for K+ transport via KtrB but does not render KtrB into a K+ channel. We conclude that either the deletion of the M2C2 region did not remove the complete gate or KtrB contains a second gate, presumably at the periplasmic side of the membrane (26), as is proposed for all transporters (50).
A M2C2 sequence as in KtrB with its small and polar amino acids is only present in SKT proteins, which require at least one additional subunit for activity. Thus, Durell and Guy (1, 2) proposed M2C2 to be of functional importance for the interaction of the subunits. We have recently shown that parts of M2C2 are indeed involved in the binding of KtrB to the regulatory subunit KtrA (26). This raised the question of whether KtrA affects the structure and function of this region. However, transport assays combining gain of function mutants of KtrB with KtrA did not show any influence of KtrA on the activity (26). In order to further address this question, EPR measurements as presented here should be performed in the presence of KtrA. The distances between the residues might change, indicating a rearrangement of the structure. In light of the fact that KtrA did not suppress the effects of the mutations, we propose that KtrA changes the KtrB conformational equilibrium in favor of the M2C2 gate in the open state. This would explain the increased transport velocity of KtrAB compared with KtrB alone described previously (26). Thereby, KtrA determines the K+-transport activity of the Ktr complex.
Supplementary Material
Acknowledgments
We thank H. Robert Guy for making the atomic coordinates of models 1 and 2 of Fig. 8 available to us, Gea Schuurman-Wolters and Bert Poolman for introducing I. H. to the techniques of reconstitution of KtrB into proteoliposomes, and Eva Limpinsel for expert technical assistance.
This work was supported by the Deutsche Forschungsgemeinschaft SFB431 (projects P6 and P18).

The on-line version of this article (available at http://www.jbc.org) contains supplemental Table 1.
- VaKtrB
- KtrB from Vibrio alginolyticus
- DDM
- β-d-dodecylmaltoside
- cw
- continuous wave
- mT
- millitesla(s)
- DEER
- double electron electron resonance.
REFERENCES
- 1.Durell S. R., Hao Y., Nakamura T., Bakker E. P., Guy H. R. (1999) Biophys. J. 77, 775–788 [DOI] [PMC free article] [PubMed] [Google Scholar]
- 2.Durell S. R., Bakker E. P., Guy H. R. (2000) Biophys. J. 78, 188–199 [DOI] [PMC free article] [PubMed] [Google Scholar]
- 3.Tholema N., Vor der Brüggen M., Mäser P., Nakamura T., Schroeder J. I., Kobayashi H., Uozumi N., Bakker E. P. (2005) J. Biol. Chem. 280, 41146–41154 [DOI] [PubMed] [Google Scholar]
- 4.Stumpe S., Schlösser A., Schleyer M., Bakker E. P. (1996) in Handbook of Biological Physics, Vol. 2 (Konings W. N., Kaback H. R., Lolkema J. S. eds) pp. 473–500, Elsevier Science B.V., Amsterdam [Google Scholar]
- 5.Booth I. R. (1985) Microbiol. Rev. 49, 359–378 [DOI] [PMC free article] [PubMed] [Google Scholar]
- 6.Epstein W. (1986) FEMS Microbiol. Rev. 39, 73–78 [Google Scholar]
- 7.Dinnbier U., Limpinsel E., Schmid R., Bakker E. P. (1988) Arch. Microbiol. 150, 348–357 [DOI] [PubMed] [Google Scholar]
- 8.Schrempf H., Schmidt O., Kümmerlen R., Hinnah S., Müller D., Betzler M., Steinkamp T., Wagner R. (1995) EMBO J. 14, 5170–5178 [DOI] [PMC free article] [PubMed] [Google Scholar]
- 9.Doyle D. A., Morais Cabral J., Pfuetzner R. A., Kuo A., Gulbis J. M., Cohen S. L., Chait B. T., MacKinnon R. (1998) Science 280, 69–77 [DOI] [PubMed] [Google Scholar]
- 10.Kuo A., Gulbis J. M., Antcliff J. F., Rahman T., Lowe E. D., Zimmer J., Cuthbertson J., Ashcroft F. M., Ezaki T., Doyle D. A. (2003) Science 300, 1922–1926 [DOI] [PubMed] [Google Scholar]
- 11.Durell S. R., Guy H. R. (1999) Biophys. J. 77, 789–807 [DOI] [PMC free article] [PubMed] [Google Scholar]
- 12.Tholema N., Bakker E. P., Suzuki A., Nakamura T. (1999) FEBS Lett. 450, 217–220 [DOI] [PubMed] [Google Scholar]
- 13.Mäser P., Hosoo Y., Goshima S., Horie T., Eckelman B., Yamada K., Yoshida K., Bakker E. P., Shinmyo A., Oiki S., Schroeder J. I., Uozumi N. (2002) Proc. Natl. Acad. Sci. U.S.A. 99, 6428–6433 [DOI] [PMC free article] [PubMed] [Google Scholar]
- 14.van der Laan M., Gassel M., Altendorf K. (2002) J. Bacteriol. 184, 5491–5494 [DOI] [PMC free article] [PubMed] [Google Scholar]
- 15.Bertrand J., Altendorf K., Bramkamp M. (2004) J. Bacteriol. 186, 5519–5522 [DOI] [PMC free article] [PubMed] [Google Scholar]
- 16.Zhou Y., Morais-Cabral J. H., Kaufman A., MacKinnon R. (2001) Nature 414, 43–48 [DOI] [PubMed] [Google Scholar]
- 17.Kato N., Akai M., Zulkifli L., Matsuda N., Kato Y., Goshima S., Hazama A., Yamagami M., Guy H. R., Uozumi N. (2007) Channels 1, 161–171 [DOI] [PubMed] [Google Scholar]
- 18.Nakamura T., Yuda R., Unemoto T., Bakker E. P. (1998) J. Bacteriol. 180, 3491–3494 [DOI] [PMC free article] [PubMed] [Google Scholar]
- 19.Kawano M., Abuki R., Igarashi K., Kakinuma Y. (2000) J. Bacteriol. 182, 2507–2512 [DOI] [PMC free article] [PubMed] [Google Scholar]
- 20.Matsuda N., Kobayashi H., Katoh H., Ogawa T., Futatsugi L., Nakamura T., Bakker E. P., Uozumi N. (2004) J. Biol. Chem. 279, 54952–54962 [DOI] [PubMed] [Google Scholar]
- 21.Holtmann G., Bakker E. P., Uozumi N., Bremer E. (2003) J. Bacteriol. 185, 1289–1298 [DOI] [PMC free article] [PubMed] [Google Scholar]
- 22.Roosild T. P., Miller S., Booth I. R., Choe S. (2002) Cell 109, 781–791 [DOI] [PubMed] [Google Scholar]
- 23.Albright R. A., Ibar J. L., Kim C. U., Gruner S. M., Morais-Cabral J. H. (2006) Cell 126, 1147–1159 [DOI] [PubMed] [Google Scholar]
- 24.Kröning N., Willenborg M., Tholema N., Hänelt I., Schmid R., Bakker E. P. (2007) J. Biol. Chem. 282, 14018–14027 [DOI] [PubMed] [Google Scholar]
- 25.Albright R. A., Joh K., Morais-Cabral J. H. (2007) J. Biol. Chem. 282, 35046–35055 [DOI] [PubMed] [Google Scholar]
- 26.Hänelt I., Löchte S., Sundermann L., Elbers K., Vor der Brüggen M., Bakker E. P. (2010) J. Biol. Chem. 285, 10318–10327 [DOI] [PMC free article] [PubMed] [Google Scholar]
- 27.Stumpe S., Bakker E. P. (1997) Arch. Microbiol. 167, 126–136 [PubMed] [Google Scholar]
- 28.Epstein W., Kim B. S. (1971) J. Bacteriol. 108, 639–644 [DOI] [PMC free article] [PubMed] [Google Scholar]
- 29.Schägger H., von Jagow G. (1987) Anal. Biochem. 166, 368–379 [DOI] [PubMed] [Google Scholar]
- 30.Driessen A. J., Konings W. N. (1993) Methods Enzymol. 221, 394–408 [DOI] [PubMed] [Google Scholar]
- 31.Mayer L. D., Hope M. J., Cullis P. R. (1986) Biochim. Biophys. Acta 858, 161–168 [DOI] [PubMed] [Google Scholar]
- 32.Knol J., Sjollema K., Poolman B. (1998) Biochemistry 37, 16410–16415 [DOI] [PubMed] [Google Scholar]
- 33.Knol J., Veenhoff L., Liang W. J., Henderson P. J., Leblanc G., Poolman B. (1996) J. Biol. Chem. 271, 15358–15366 [DOI] [PubMed] [Google Scholar]
- 34.Pannier M., Veit S., Godt G., Jeschke G., Spiess H. W. (2000) J. Magn. Res. 142, 331–340 [DOI] [PubMed] [Google Scholar]
- 35.Jeschke G., Bender A., Paulsen H., Zimmermann H., Godt A. (2004) J. Magn. Reson. 169, 1–12 [DOI] [PubMed] [Google Scholar]
- 36.Jeschke G., Chechik V., Ionita P., Godt A., Zimmermann H., Banham J., Timmel C. R., Hilger D., Jung H. (2006) Appl. Magn. Reson. 30, 473–498 [Google Scholar]
- 37.Steinhoff H. J., Radzwill N., Thevis W., Lenz V., Brandenburg D., Antson A., Dodson G., Wollmer A. (1997) Biophys. J. 73, 3287–3298 [DOI] [PMC free article] [PubMed] [Google Scholar]
- 38.Jeschke G., Polyhach Y. (2007) Phys. Chem. Chem. Phys. 9, 1895–1910 [DOI] [PubMed] [Google Scholar]
- 39.Heginbotham L., Kolmakova-Partensky L., Miller C. (1998) J. Gen. Physiol. 111, 741–749 [DOI] [PMC free article] [PubMed] [Google Scholar]
- 40.Nimigean C. M. (2006) Nat. Protoc. 1, 1207–1212 [DOI] [PubMed] [Google Scholar]
- 41.Lowry O. H., Rosebrough N. J., Farr A. L., Randall R. J. (1951) J. Biol. Chem. 193, 265–275 [PubMed] [Google Scholar]
- 42.Bakker E. P., Mangerich W. E. (1981) J. Bacteriol. 147, 820–826 [DOI] [PMC free article] [PubMed] [Google Scholar]
- 43.Fersht A. (1985) Enzyme Structure and Mechanism, 2nd Ed., p. 475, W.H. Freeman and Co., New York [Google Scholar]
- 44.Mchaourab H. S., Lietzow M. A., Hideg K., Hubbell W. L. (1996) Biochemistry 35, 7692–7704 [DOI] [PubMed] [Google Scholar]
- 45.Hubbell W. L., Mchaourab H. S., Altenbach C., Lietzow M. A. (1996) Structure 4, 779–783 [DOI] [PubMed] [Google Scholar]
- 46.Savitsky A., Kühn M., Duché D., Möbius K., Steinhoff H. J. (2004) J. Phys. Chem. B 108, 9541–9548 [Google Scholar]
- 47.Krieger E., Koraimann G., Vriend G. (2002) Proteins 47, 393–402 [DOI] [PubMed] [Google Scholar]
- 48.Cortes D. M., Cuello L. G., Perozo E. (2001) J. Gen. Physiol. 117, 165–180 [DOI] [PMC free article] [PubMed] [Google Scholar]
- 49.Uysal S., Vásquez V., Tereshko V., Esaki K., Fellouse F. A., Sidhu S. S., Koide S., Perozo E., Kossiakoff A. (2009) Proc. Natl. Acad. Sci. U.S.A. 106, 6644–6649 [DOI] [PMC free article] [PubMed] [Google Scholar]
- 50.Gadsby D. C. (2009) Nat. Rev. Mol. Cell. Biol. 10, 344–352 [DOI] [PMC free article] [PubMed] [Google Scholar]
Associated Data
This section collects any data citations, data availability statements, or supplementary materials included in this article.


